Electricity
Oil and Gas
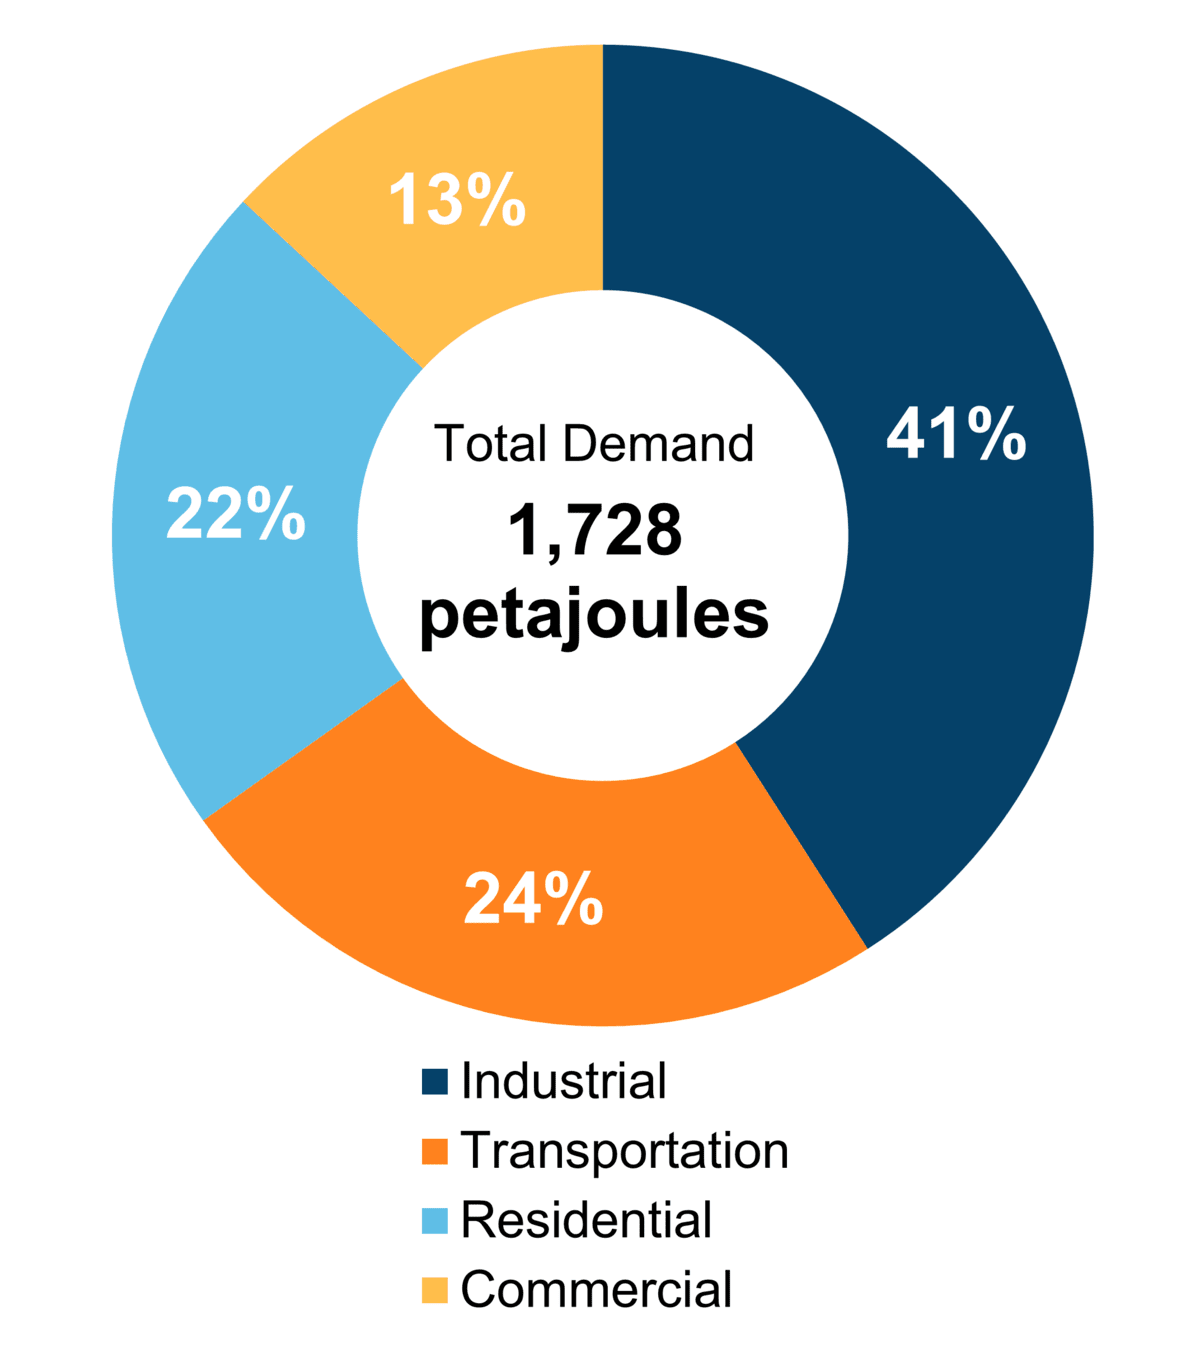
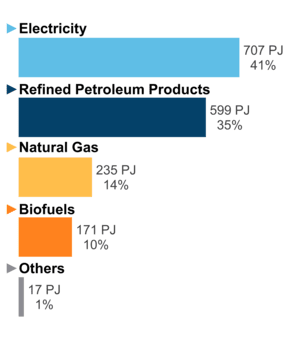
Energy Use
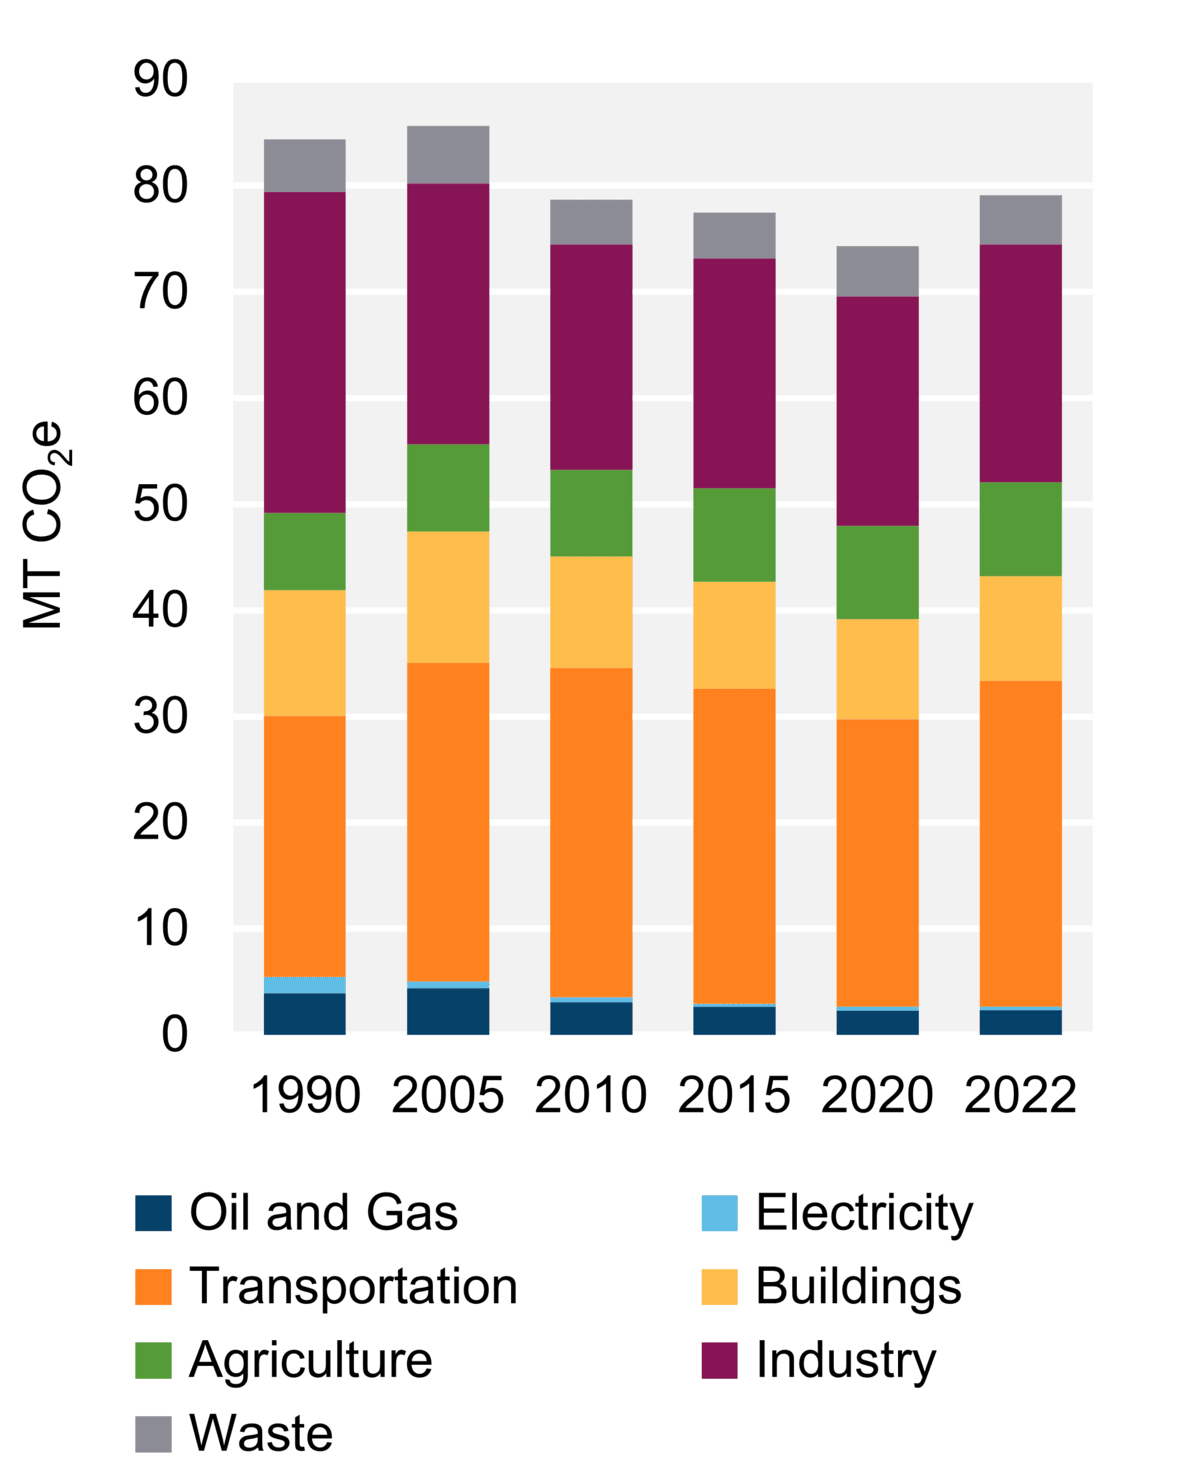
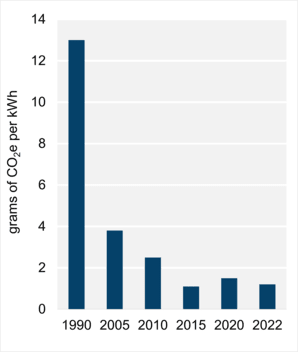
GHG Emissions
Electricity
From our Energy Futures dataset »
Figure 1: Electricity generation by Fuel Type (2021)

Text Alternative
Text Alternative: This pie chart shows electricity generation by source in Quebec. A total of 212.9 TWh of electricity was generated in 2021.
Figure 1: Electricity generation by Fuel Type (2021)
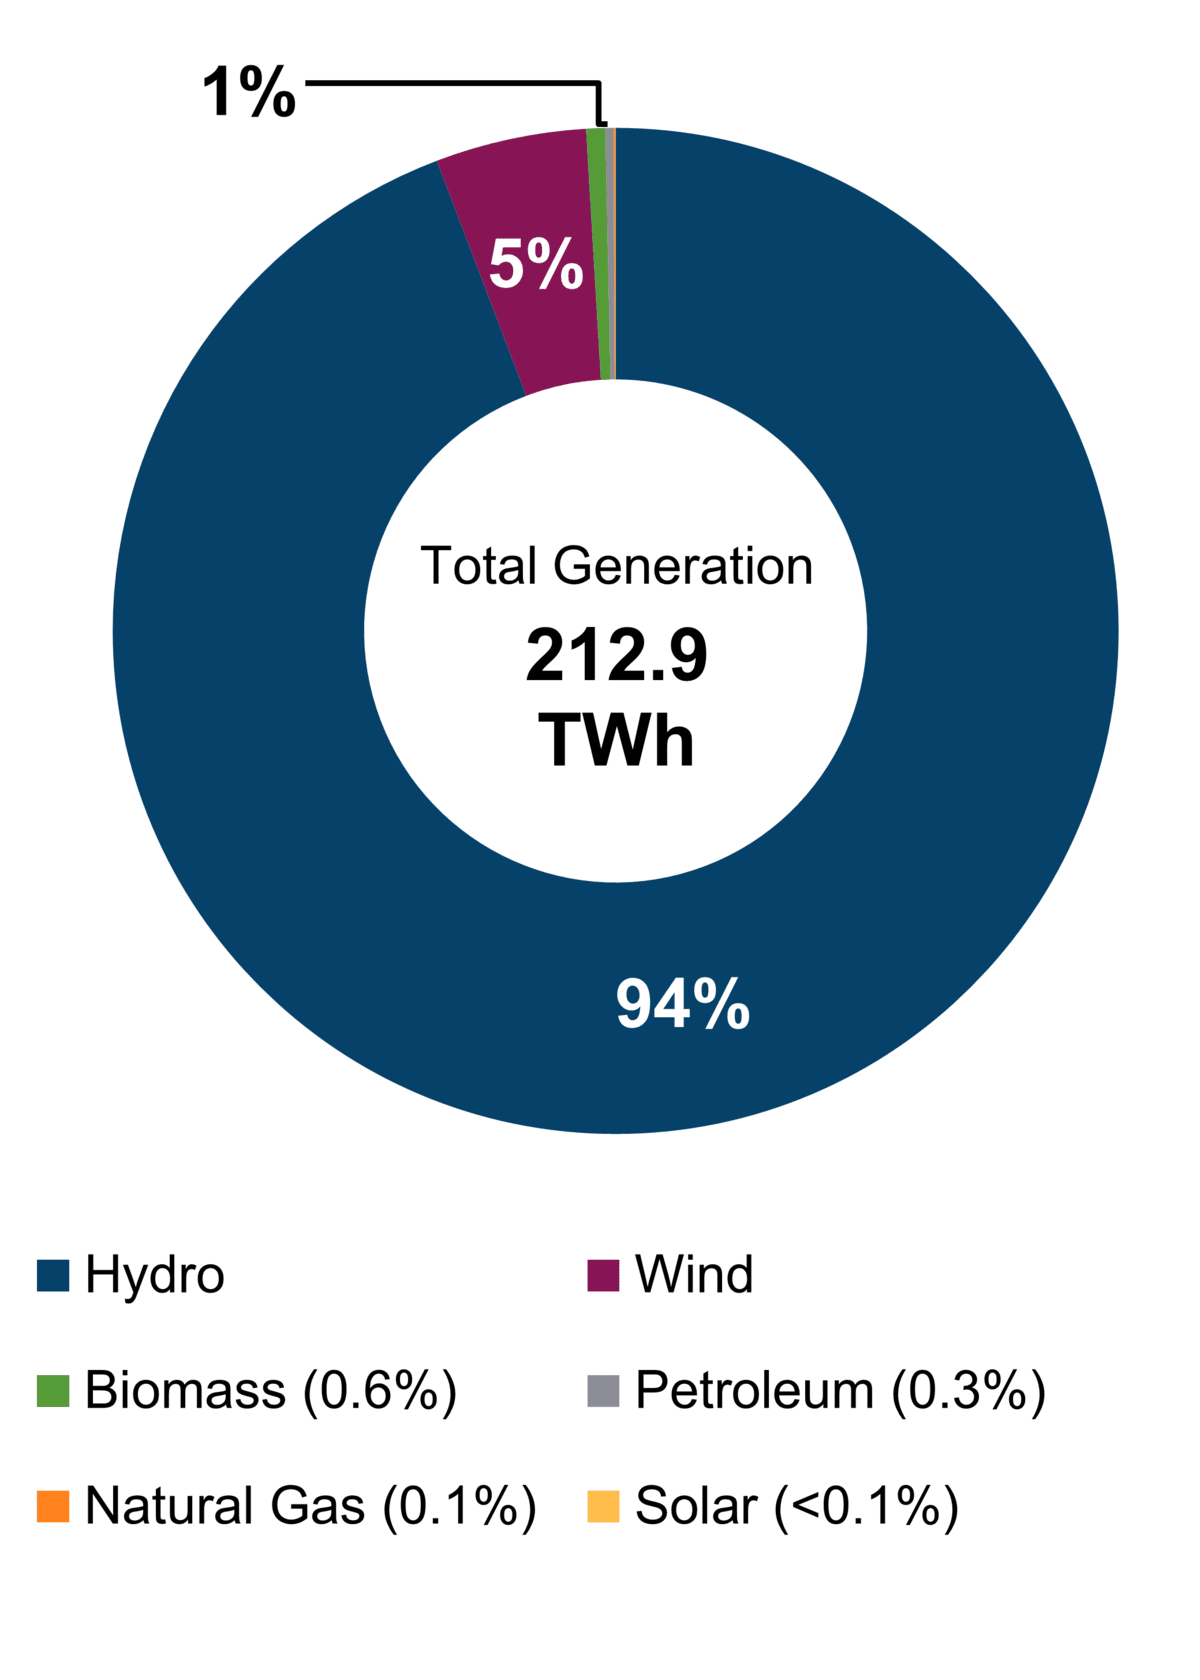
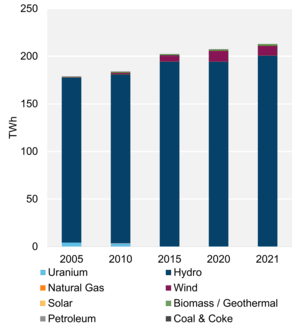
Figure 2: Electricity generation by Fuel Type, Trend (2021)
Text Alternative
Text Alternative: This chart shows electricity generation by source in Quebec from 2005 to 2021.
Figure 2: Electricity generation by Fuel Type, Trend (2021)


Connect/Contact Us
Please send comments, questions, or suggestions to
energy-energie@cer-rec.gc.ca
On this page:
Production
- In 2021, Quebec generated 212.9 terawatt-hours (TWh) of electricity (Figure 1), which was about a third of total Canadian generation. Quebec is the top electricity producer in Canada and had an estimated generating capacity of 47,078 megawatts (MW) in 2021.
- With 41,487 MW of installed hydroelectric capacity, hydropower accounted for 94% of the electricity generated in Quebec in 2021. This includes Canada’s largest hydro plant, the 5,616 MW Robert-Bourassa facility in northern Quebec. The facility underwent rehabilitation work that was completed in 2022.
- Quebec’s newest hydropower facility is the Romaine hydroelectric complex, which is located on the Romaine River in the Côte-Nord region. It is comprised of four generating stations: Romaine-1 (270 MW), Romaine-2 (640 MW), and Romaine-3 (395 MW) and Romaine-4 (245 MW). The total installed capacity is 1,550 MW. Construction began in 2009 and finished with the completion of Romaine-4 in 2023.
- Wind is the second largest source of electricity generation in Quebec, contributing about 5% of total generation in 2021. Wind capacity is estimated at 4,363 MW and accounted for 9% of the province’s generating capacity in 2021. The two largest wind farms in Canada are located in Quebec: Seigneurie de Beaupré (364 MW) and Rivière-du-Moulin (350 MW).
- Five wind farms have entered service since 2018:
- Mont Sainte-Marguerite (147 MW), 2018
- Nicolas-Riou (224 MW), 2018
- Dune-du-Nord [French only] (6.4 MW), 2020
- Belle-Rivière (24 MW), 2021
- Des Cultures (24 MW), 2022
- The 200 MW Apuiat wind farm [French only] began construction in 2023 with commissioning of the project scheduled for December 2024. The wind farm, a partnership between Innu communities and Boralex, will be constructed in Port-Cartier in the Côte-Nord region.
- Quebec’s other sources of electricity generation include bioenergy, diesel (for power in remote communities), natural gas (mainly for peak winter demand), and solar.
- Hydro-Québec’s newest solar generating stations, Robert-A.-Boyd and Gabrielle-Bodis,Footnote 1 located in Varennes and La Prairie respectively, were commissioned in June 2021. The stations have a combined capacity of 9.5 MW.
- Hydro-Québec generates most of the electricity in the province, including electricity from 61 hydroelectric plants. Independent power producers operate several smaller hydroelectric plants, as well as all bioenergy and wind facilities.
Trade and Transportation
- In 2023, Quebec’s net electricity interprovincial and international inflows were 14.2 TWh. Typically, Quebec is Canada’s largest electricity exporter. However, in 2023, exports decreased due to low water levels in hydroelectric reservoirs.Footnote 2
- Under long-term contracts signed in 1969, Hydro-Québec can access approximately 85% of the 5,428 MW of electricity produced at the Churchill Falls hydroelectric stationFootnote 3 in Labrador until 2041. It is the second largest underground hydroelectric plant in North America. Negotiations are currently underway to increase production by 1,600 MW.Footnote 4
- Quebec also trades with electricity markets in the U.S. Northeast, primarily New England and New York. In 2022, Quebec exported more electricity to the U.S. than any other province, with gross exports of 22.6 TWh.Footnote 5
- Hydro-Québec operates 34,922 km of transmission lines and 228,568 km of distribution lines.Footnote 6 Fifteen interconnections link Quebec’s electricity system with systems in Ontario, the Maritime provinces, and the U.S. Northeast.
- Construction work for the Appalaches-Maine Interconnection ProjectFootnote 7 began in summer 2023. The project will increase the electricity exchange capacity between Quebec and New England through 100 km of new 320-kilovolt direct-current electricity lines. The project received government and Canada Energy Regulator (CER) approvalsFootnote 8 in 2021 and commissioning of the line is scheduled for 2025.
- Construction work for the Hertel-New York Interconnection Project began in January 2024. The project aims to supply 1,250 MW of electricity from Quebec to New York City. In Quebec, the project involves the construction of a 57.7 km line and will connect to the Champlain Hudson Power Express project in the U.S. The project received CER approval in July 2023.Footnote 9
Related data
Energy authorities


Canadian Centre for Energy Information
Search for datasets, visualizations, publications and more at this one-stop virtual shop for independent and trusted information on energy in Canada.
- Date modified: