Electricity
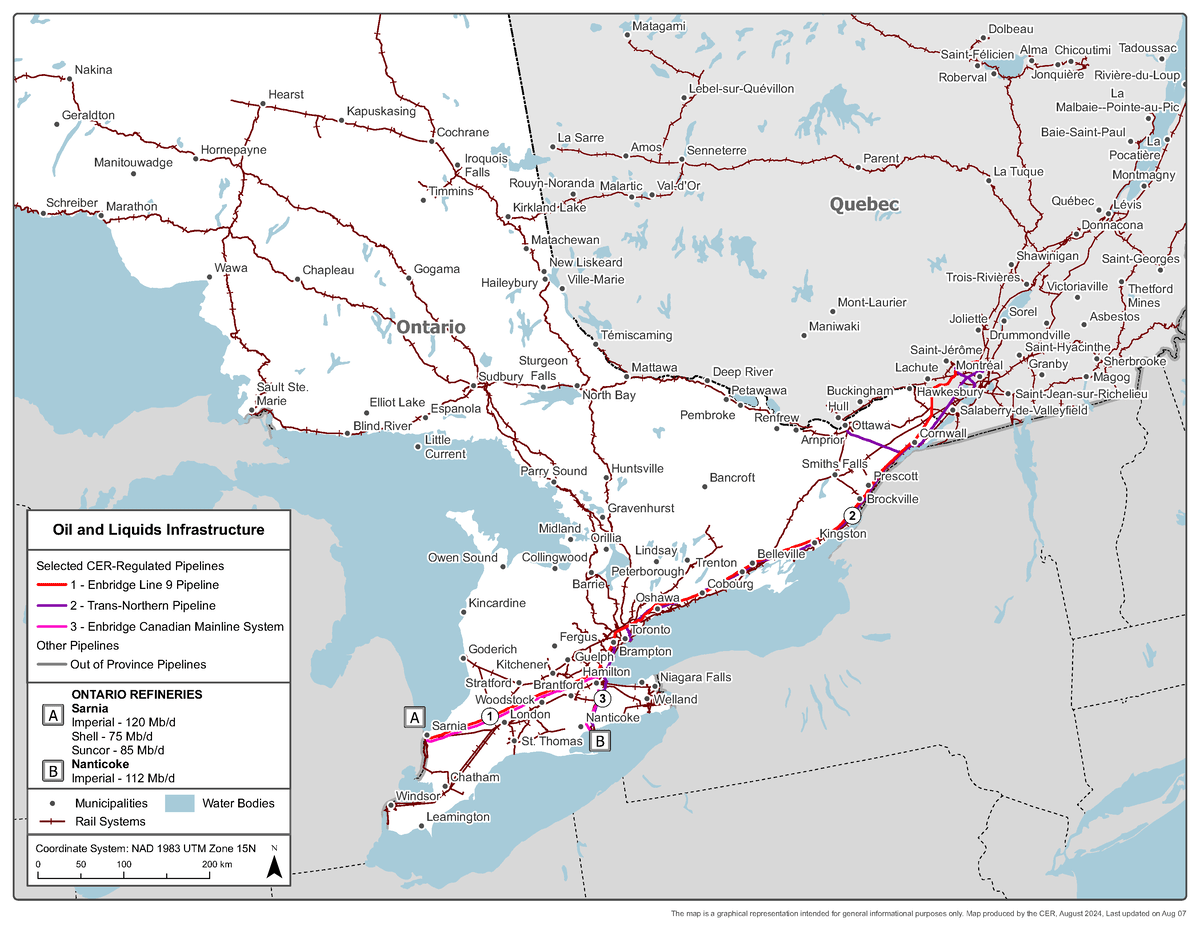
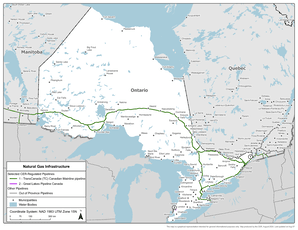
Oil and Gas
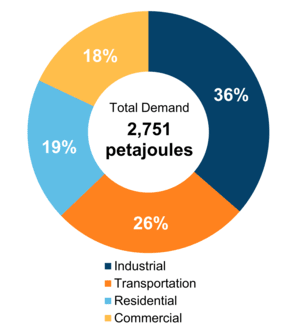
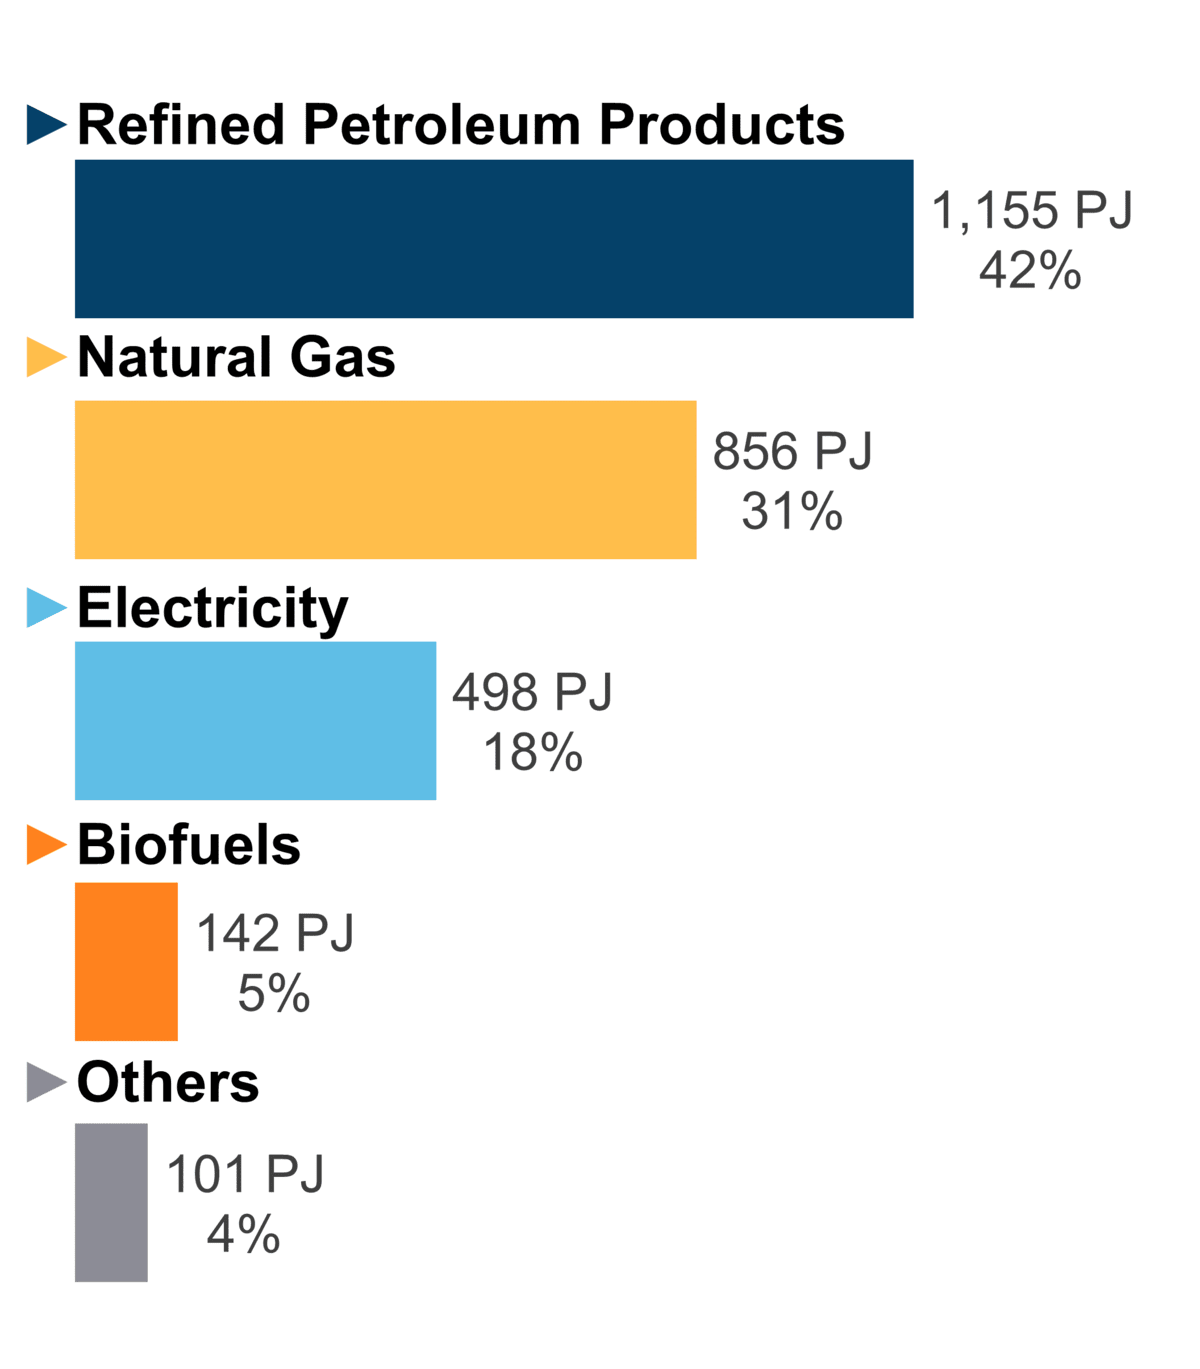
Energy Use
GHG Emissions
Electricity
From our Energy Futures dataset »
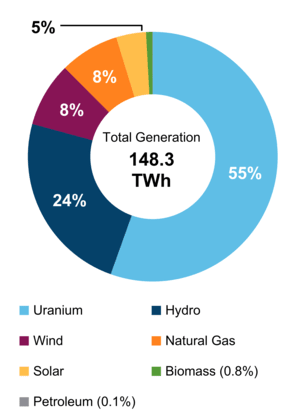
Figure 1: Electricity generation by Fuel Type (2021)
Text Alternative
Text Alternative: This pie chart shows electricity generation by source in Ontario. A total of 148.3 TWh of electricity was generated in 2021.
Figure 1: Electricity generation by Fuel Type (2021)

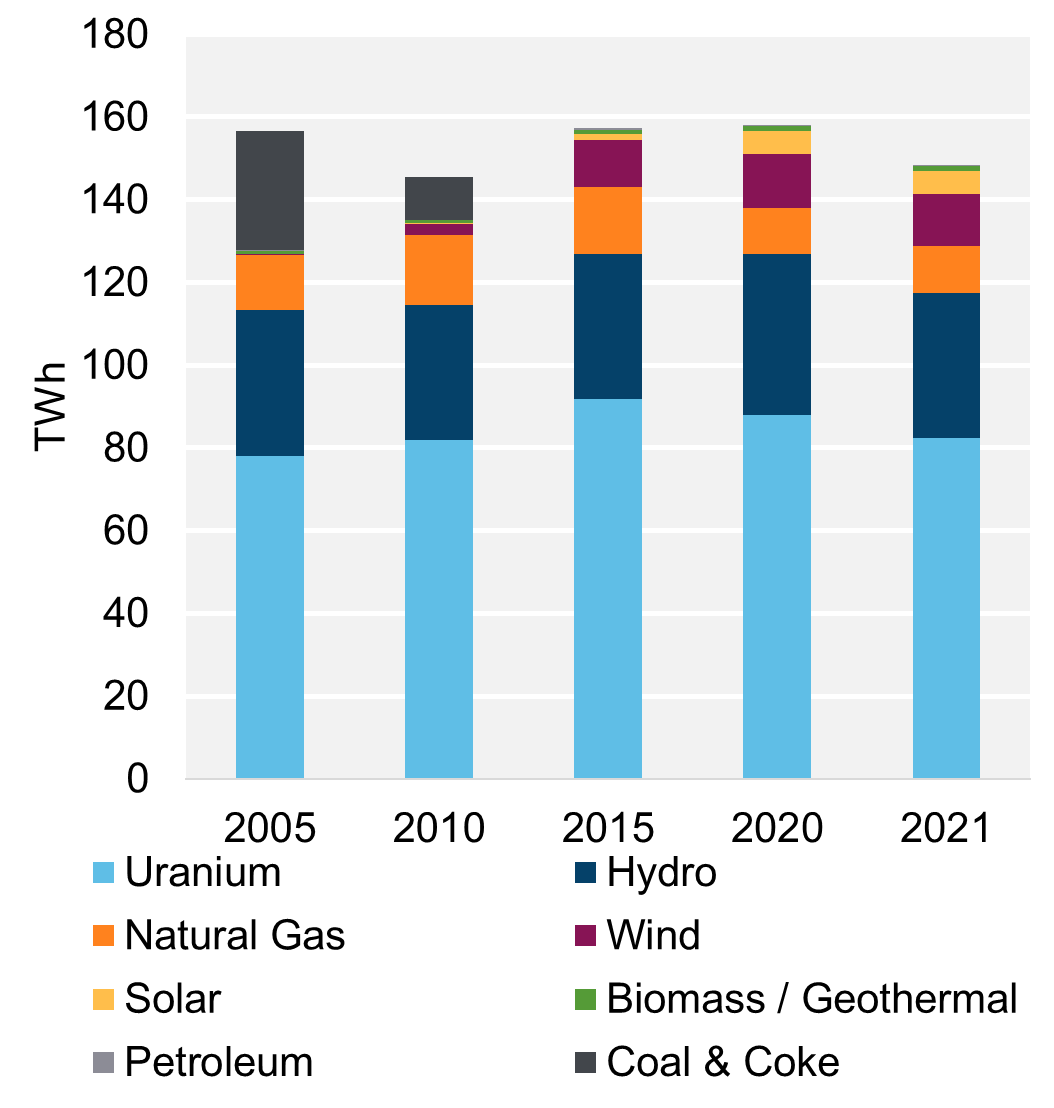
Figure 2: Electricity generation by Fuel Type, Trend (2021)

Text Alternative
Text Alternative: This chart shows electricity generation by source in Ontario from 2005 to 2021.
Figure 2: Electricity generation by Fuel Type, Trend (2021)

Connect/Contact Us
Please send comments, questions, or suggestions to
energy-energie@cer-rec.gc.ca
On this page:
Production
- In 2021, Ontario generated 148.3 terawatt-hours (TWh) of electricity (Figure 1), which was 24% of Canada’s generation. Ontario is the second largest producer of electricity in Canada, after Quebec, and has an estimated generating capacity of 39,569 megawatts (MW).
- In 2021, about 91% of electricity in Ontario was produced from zero-carbon sources: 55% from nuclear, 24% from hydroelectricity, 8% from wind, and 4% from solar. The remainder was primarily from natural gas and some bioenergy. Ontario’s electricity generating capacity is mainly located in southern parts of the province, but large hydroelectric generating stations are also located in eastern Ontario in the Ottawa River Basin and northeastern Ontario in the Moose River Basin.
- Three nuclear power plants with a combined 12,844 MW of installed capacity provide the bulk of Ontario’s baseload generation.Footnote 1 Bruce Power on the east shore of Lake Huron is the largest, with eight generation units and an installed capacity of about 6,232 MW. It is one of the largest nuclear power plants currently operating in the world.
- In 2015, the Ontario government approved refurbishing 10 nuclear generation units—six at the Bruce Power site and four at the Darlington site. This 17-year program with a $26 billion budget is one of the largest non-emitting energy projects in North America. The refurbishments should extend the life of each unit by 30 to 35 years.
- Darlington’s Units 2 and 3 have returned to commercial operation after refurbishment in 2020 and 2023, respectively, while Units 1 and 4 are expected to return to service in 2025 and 2026, respectively.Footnote 2
- The first Bruce Power unit to undergo refurbishment was Unit 6, which started its outage in January 2020 and returned to commercial operation in September 2023.Footnote 3 Unit 3 commenced refurbishment in 2023 with Unit 4 expected in 2025.Footnote 4
- In January 2024, the Ontario Government announced support for Ontario Power Generation’s (OPG) plan to proceed with the next steps toward refurbishing Pickering Nuclear Generating Station’s “B” units (units 5-8).Footnote 5
- Ontario is advancing the planning and licensing of Canada’s first grid-scale small modular reactor (SMR) project which could see four units with a total capacity of around 1,200 MW built at the Darlington nuclear site by 2036.Footnote 6
- Ontario is starting pre-development work with Bruce Power to site the first large-scale nuclear build in over 30 years to help meet rising electricity demand. Bruce Power will undertake an Impact Assessment for siting up to 4,800 MW of new nuclear generation at the Bruce power site.Footnote 7
- Ontario has over 200 hydroelectric generation facilities with a total capacity of 9,264 MW.Footnote 8
- The Sir Adam Beck Pump Generating Station in Niagara Falls is capable of pumping water up to a reservoir during periods of low demand to provide up to 174 MW of power during periods of high demand.
- Ontario is moving forward with the procurement of seven new battery storage projects totaling 739 MW. The storage facilities will be located throughout the province and range from 5 MW to 300 MW.Footnote 9 These projects are in addition to the 250 MW Oneida battery energy storage facility that is currently under construction and expected to enter operation in 2025.
- Ontario leads Canada in wind capacity with a total capacity of 5,575 MW in 2021.
- Ontario had about 80% of Canada’s solar capacity in 2021, with 2,669 MW installed.Footnote 10
- Ontario has the largest 100% biomass-fueled plant in North America. The 205 MW Atikokan Generating Station was converted from coal in 2014.
- Ontario and Alberta are the only jurisdictions in Canada that have competitive generation and retail markets for electricity.
- OPG, a Crown corporation, is the largest utility in Ontario’s competitive electricity market, with over 18,230 MW of capacity.Footnote 11
Trade and Transportation
- In 2023, Ontario’s net interprovincial and international electricity outflows were 13.0 TWh.
- Ontario has interconnections with Manitoba, Quebec, Michigan, Minnesota, and New York. Most of Ontario’s imports come from Quebec while most of Ontario’s exports go to New York and Michigan.
- Since 2002, Ontario has had competitive generation and retail markets for electricity.
- Hydro One owns and operates almost all of Ontario’s transmission capacity and has about 30,000 km of transmission lines. It serves nearly 1.5 million, predominantly rural, customers that are 26% of the total customers in Ontario.Footnote 12
- The Independent Electricity System Operator (IESO) manages the province’s power system by balancing supply and demand and directing the flow of electricity across high-voltage transmission lines.
- The Ontario Energy Board regulates the energy sector in Ontario, including electricity.
- In August 2023, the governments of Ontario and Quebec announced a new 600 MW trade agreement between Ontario’s IESO and Hydro-Québec.Footnote 13 The IESO will provide 600 MW to Hydro-Québec in the winter and Hydro-Québec will provide 600 MW to the IESO in the summer.
Related data


Canadian Centre for Energy Information
Search for datasets, visualizations, publications and more at this one-stop virtual shop for independent and trusted information on energy in Canada.
- Date modified: