Electricity
Oil and Gas
Energy Use
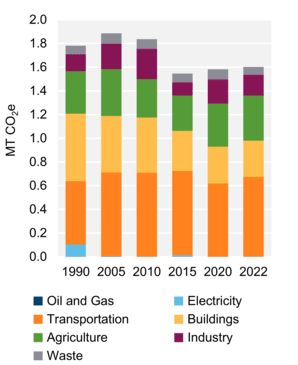
GHG Emissions
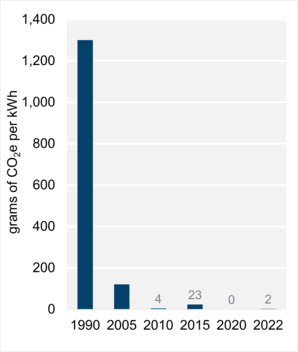
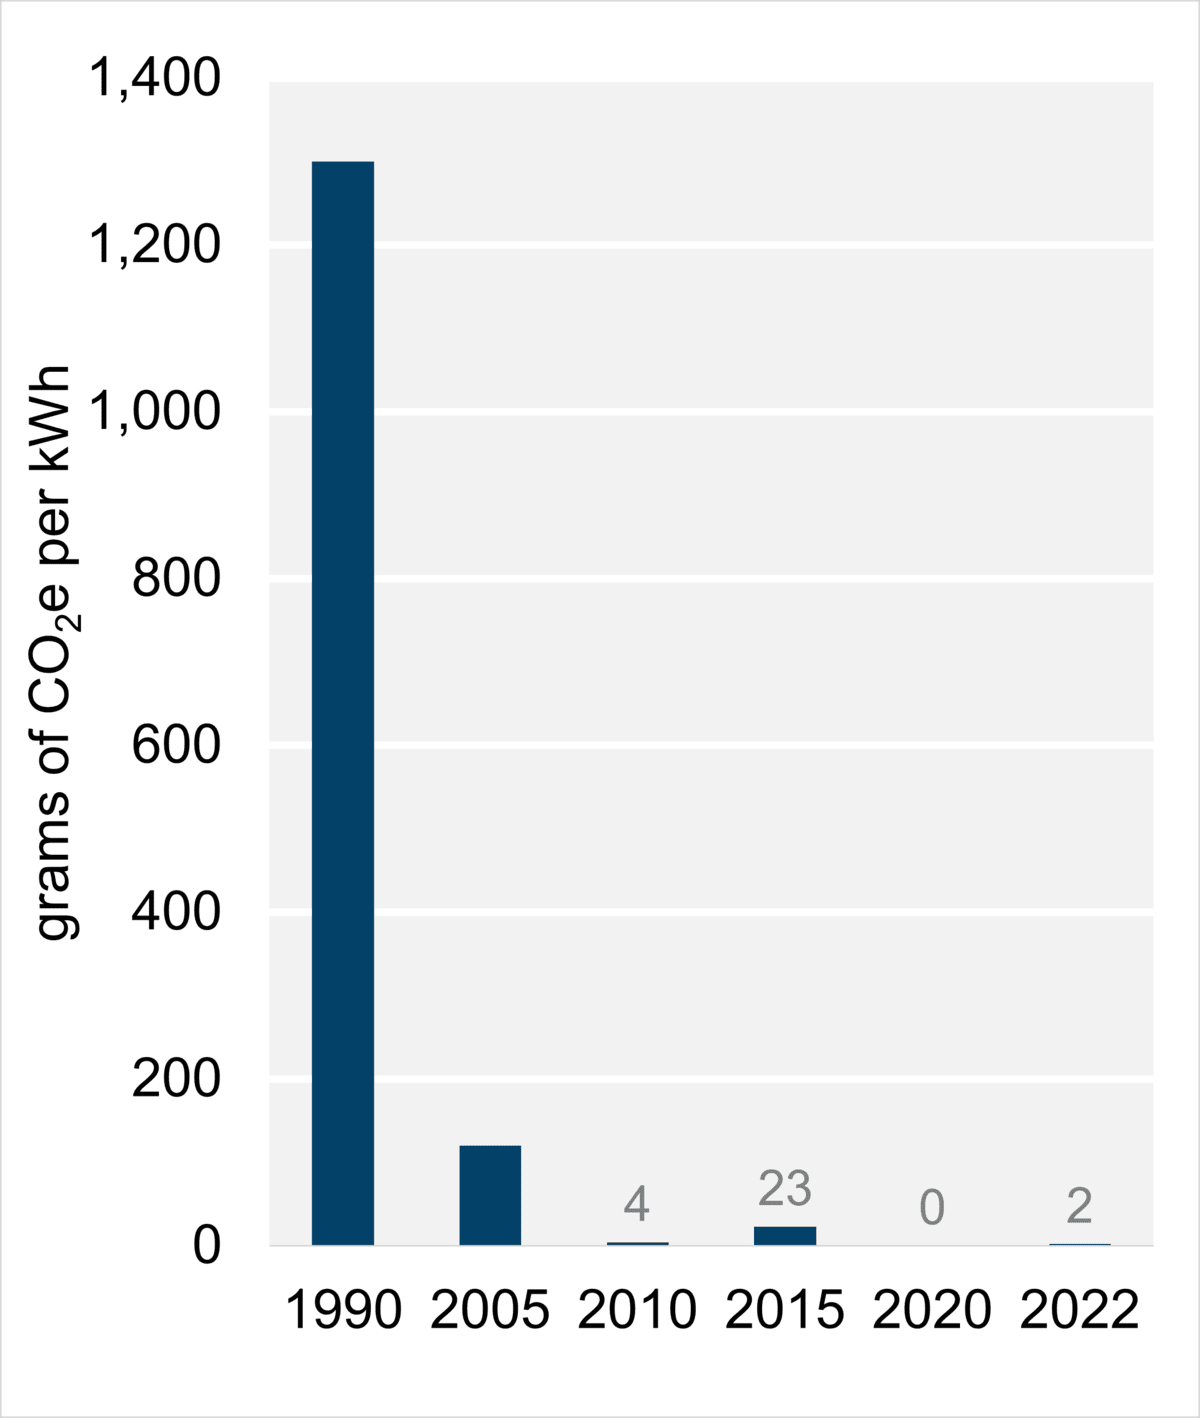
Electricity
From our Energy Futures dataset »
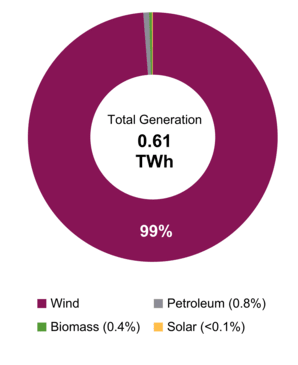
Figure 1: Electricity generation by Fuel Type (2021)
Text Alternative
Text Alternative: This pie chart shows electricity generation by source in PEI. A total of 0.61 TWh of electricity was generated in 2021.
Figure 1: Electricity generation by Fuel Type (2021)

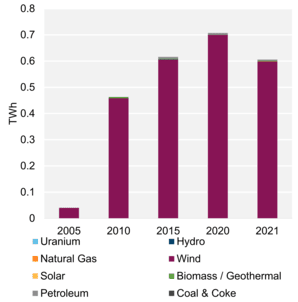
Figure 2: Electricity generation by Fuel Type, Trend (2021)
Text Alternative
Text Alternative: This chart shows electricity generation by source in Prince Edward Island from 2005 to 2021.
Figure 2: Electricity generation by Fuel Type, Trend (2021)


Connect/Contact Us
Please send comments, questions, or suggestions to
energy-energie@cer-rec.gc.ca
On this page:
Production
- In 2021, PEI generated about 0.61 terawatt-hours (TWh) of electricity (Figure 1), which is 0.1% of total Canadian production. PEI has an estimated generating capacity of 441 megawatts (MW).
- Roughly 99% of power generation on PEI is from wind farms. As of 2021, there was an estimated 268 MW of installed wind capacity on PEI.
- The majority of electricity consumed in PEI is imported from New Brunswick, which generates most of its electricity from a mix of nuclear, fossil fuels, and hydroelectricity.
- PEI’s largest wind farm is Engie’s West Cape Wind Park with a capacity of 99 MW.
- PEI’s latest large renewable electricity project is the 21 MW Sunbank solar farm and battery in Summerside, which was completed in late 2023.
- Diesel and oil-fired facilities are used to meet periods of peak power demand and during emergencies when wind generation or off-island imports are interrupted. Such facilities accounted for less than 1% of PEI’s total electricity needs in 2021.
- Most of PEI’s electricity transmission and distribution is provided by Maritime Electric Company Limited (Maritime Electric), a subsidiary of Fortis Inc. Summerside Electric also supplies electricity to more than 7,000 commercial and residential customers throughout Summerside. Summerside Electric also owns and operates four wind turbines (combined 12 MW) and the Summerside Diesel Generation Plant, which generates up to 12.5 MW of electricity when needed.
- PEI Energy Corporation is a provincial Crown corporation whose mandate involves the promotion and development of energy systems on the island. The Crown corporation operates wind farms atFootnote 1:
- Elmira (30 MW)
- Hermanville (30 MW)
- North Cape (10.6 MW)
- Norway (3 MW)
- The Renewable Energy Act passed in 2005 required utilities to source a minimum of 15% of their energy from renewable sources (including out-of-province purchases) by 2010. In mid-2015, the act was amended to eliminate this requirement. In August 2023, changes to the act gave the provincial government authority to issue development permits for renewable energy developments.Footnote 2
- In 2019, PEI Energy Corporation proposed an expansion to double the 30 MW capacity of the Eastern Kings Wind Farm at Elmira. However, the project was denied a permit by the Rural Municipality of Eastern Kings after receiving approval from the provincial government. The PEI Energy Corporation filed an appeal with the Island Regulatory and Appeals Commission (IRAC). In April 2023, the IRAC overturned the municipality’s decision. The corporation expects the turbines to be in service by September 2025.Footnote 3
Trade and Transportation
- PEI is a net importer of electricity, with net interprovincial and international electricity inflows of 1.2 terawatt-hours (TWh) in 2023. PEI sources approximately 69% of its electricity from New Brunswick.Footnote 4 Electricity is transmitted between provinces by two subsea cables under the Northumberland Strait.
- The Interconnection Upgrade Project was completed and placed in service in 2017. The project increased transmission capacity between New Brunswick and PEI by adding two new 180 MW subsea cables. The original two cables linking PEI and New Brunswick were installed in 1977 with a combined capacity of 200 MW.
- Power is distributed around the island on over 6,600 km of transmission and distribution power lines that are primarily owned and operated by Maritime Electric. The PEI Energy Corporation also owns transmission facilities in Prince County to connect its North Cape operations and other generators to the Maritime Electric grid.
Related data
Energy authorities


Canadian Centre for Energy Information
Search for datasets, visualizations, publications and more at this one-stop virtual shop for independent and trusted information on energy in Canada.
- Date modified: