Provincial and Territorial Energy Profiles – New Brunswick

On this page:
Connect/Contact Us
Please send comments, questions, or suggestions to
energy-energie@cer-rec.gc.ca
-
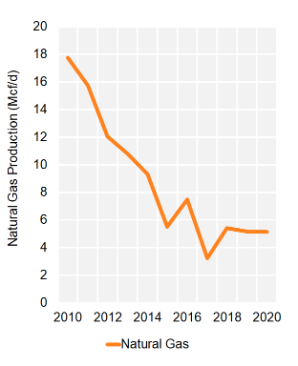
Figure 1: Hydrocarbon Production
Source and Description:
Source:
CER – Estimated Production of Canadian Crude Oil and Equivalent and Marketable Natural Gas Production in CanadaDescription:
This graph shows hydrocarbon production in New Brunswick from 2013 to 2023. Natural gas production decreased from 10.8 MMcf/d to 3.2 Mmcf/d. -
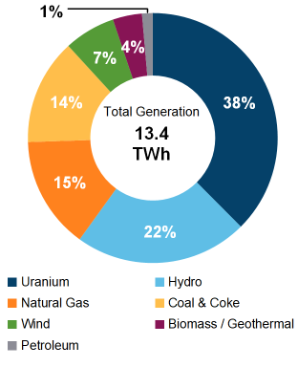
Figure 2: Electricity Generation by Fuel Type (2021)
Source and Description:
Source:
CER – Canada's Energy Future 2023 Data Appendix for Electricity GenerationDescription:
This pie chart shows electricity generation by source in New Brunswick. A total of 11.6 TWh of electricity was generated in 2021. -
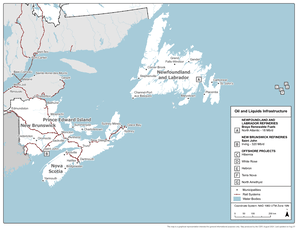
Figure 3: Crude Oil Infrastructure Map
Source and Description:
Source:
CERDescription:
This map shows rail lines and refineries in New Brunswick, and crude oil infrastructure in Atlantic Canada.Download:
PDF version [2,817 KB] -
Figure 4: Natural Gas Infrastructure Map
Source and Description:
Source:
CERDescription:
This map shows major CER-regulated natural gas pipelines, offshore natural gas platforms, and the Saint John LNG terminal in the Maritimes.Download:
PDF version [686 KB] -
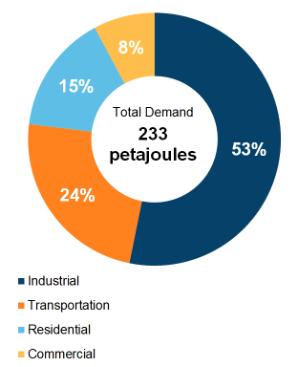
Figure 5: End-Use Demand by Sector (2020)
Source and Description:
Source:
CER – Canada's Energy Future 2023 Data Appendix for End-Use DemandDescription:
This pie chart shows end-use energy demand in New Brunswick by sector. Total end-use energy demand was 209 PJ in 2020. The largest sector was industrial at 55% of total demand, followed by transportation (at 21%), residential (at 16%), and lastly, commercial (at 8%). -
Figure 6: End-Use Demand by Fuel (2020)
Source and Description:
Source:
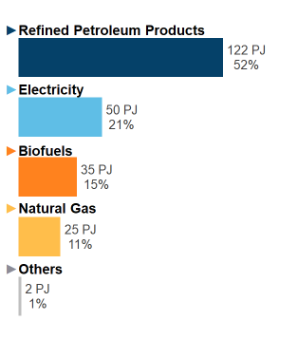
CER – Canada's Energy Future 2023 Data Appendix for End-Use DemandDescription:
This figure shows end-use demand by fuel type in New Brunswick in 2020. Refined petroleum products accounted for 103 PJ (49%) of demand, followed by electricity at 48 PJ (23%), natural gas at 29 PJ (14%), biofuels at 28 PJ (14%), and other at 2 PJ (less than 1%).
Note: "Other" includes coal, coke, and coke oven gas. -
Figure 7: GHG Emissions by Sector
Source and Description:
Source:
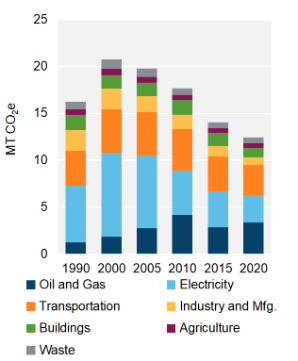
Environment and Climate Change Canada – National Inventory Report 1990-2022Description:
This stacked column graph shows GHG emissions in New Brunswick by sector from 1990 to 2022 in MT of CO2 equivalent. Total GHG emissions have decreased in New Brunswick from 16.2 MT of CO2e in 1990 to 12.5 MT of CO2e in 2022. -
Figure 8: Emissions Intensity of Electricity Generation
Source and Description:
Source:
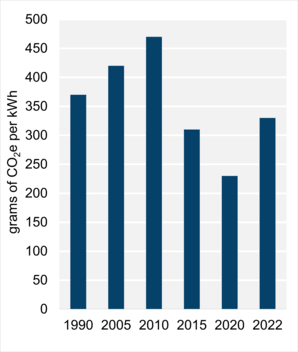
Environment and Climate Change Canada – National Inventory Report 1990-2022Description:
This column graph shows the emissions intensity of electricity generation in New Brunswick from 1990 to 2022. In 1990, electricity generated in New Brunswick emitted 370 g of CO2e per kWh. By 2022, emissions intensity decreased to 330 g of CO2e per kWh.
Energy Production
Crude Oil
- Oil wells have been drilled in New Brunswick since 1859. Exploration around the Stoney Creek area south of Moncton began in 1908 with production beginning in 1909.Footnote 1
- New Brunswick produced a very small amount of crude oil from the Stoney Creek oil field. In 2022, production averaged 25 barrels per day (b/d). In 2023, production averaged 22 b/d before being shut down. Crude oil from the active wells was collected at a storage facility before being trucked to the Irving Oil Refinery in Saint John.Footnote 2
Refined Petroleum Products (RPPs)
- New Brunswick is a net producer of RPPs with surplus RPPs sold to the United States (U.S.) East Coast and neighbouring Atlantic provinces.
- The Irving Oil Refinery in Saint John is the only refinery in New Brunswick and it is the largest refinery in Canada with a capacity of 320 thousand barrels per day (Mb/d).Footnote 3 Operating since 1960, the refinery produces gasoline, diesel, heating oil, jet fuel, propane, and asphalt.
Natural Gas/Natural Gas Liquids (NGLs)
- In 2023, natural gas production in New Brunswick averaged 3.2 million cubic feet per day (MMcf/d) (Figure 1). This was less than 1% of total Canadian natural gas production.
- Natural gas is produced from the McCully Field, near Sussex.Footnote 4 The McCully Field was discovered in 2000 by a joint venture between Headwater Exploration Inc. (formerly Corridor Resources) and Potash Corporation of Saskatchewan, and a total of 39 wells have been drilled to date. Since 2017, the McCully Field produces most of its gas during winter months, but largely shuts down during summer months, to better match production with Maritimes heating demand and prices, which are higher in the winter.
- New Brunswick placed a moratorium on hydraulic fracturing in 2014 that is still in place today. However, the New Brunswick government in 2019 made an exemption to the moratorium for the area near Sussex.Footnote 5
- New Brunswick produces no field production of propane or butane, but does produce small amounts of condensate (about 30 b/d). Small volumes of propane and butane are produced by the Irving Oil Refinery.
Electricity
- In 2021, New Brunswick generated 11.6 terawatt-hours (TWh) of electricity (Figure 2), which is approximately 2% of total Canadian generation. New Brunswick has an estimated generating capacity of 4,723 megawatts (MW).
- In 2021, approximately 40% of New Brunswick’s electricity generation was from nuclear, 27% was from fossil fuels (natural gas, coal, and petroleum), and 23% was from hydroelectricity. The remainder was produced from wind and biomass.
- New Brunswick Power Corporation (NB Power) generates most of the electricity in the province.Footnote 6 NB Power operates a total of 12 hydro, coal, oil, and diesel-powered stations with a combined capacity of 3,799 MW. NB Power also operates the Point Lepreau Nuclear Generating Station. Point Lepreau is located near the Bay of Fundy and has a gross capacity of 705 MW.Footnote 7
- NB Power is proposing significant dam rehabilitation to extend the lifespan of New Brunswick’s largest hydro facility, the Mactaquac Generating Station (672 MW). Construction is expected to last up to 15 years with work including repairs to structures, mechanical and electrical upgrades, and enhanced fish passage.Footnote 8
- In March 2024, the Indigenous-led 42 MW Burchill Wind Project southwest of Saint John incorporated a utility-scale battery energy storage system. The new storage system is the largest of its kind in New Brunswick and is intended to store the intermittent electricity generated by the 10 wind turbines.Footnote 9
- Independent power producers operate wind, biomass, natural gas, hydro, and other renewable energy facilities.
- Generation from wind power increased from none in 2005 to 6% of total generation in 2021. Biomass facilities provided 5% of generation.
Energy Transportation and Trade
Crude Oil and Liquids
- There are no international or interprovincial crude oil pipelines in New Brunswick. All of New Brunswick’s crude oil supplies arrive by sea or rail. Most of the crude oil used by the Irving Oil refinery comes from non-Canadian sources. The largest non-Canadian sources include the U.S., Nigeria, and Saudi Arabia.Footnote 10 Canadian sources include crude oil from offshore Newfoundland and Labrador, by tanker.Footnote 11
- The Irving Oil Refinery receives most of its crude oil supply from Irving’s Canaport Marine Terminal.Footnote 12 This facility can receive ultra-large crude carriers (ULCC)Footnote 13 and has an oil storage capacity of six million barrels (Figure 3).
- Over half of the RPPs produced at the Irving Oil Refinery are exported via marine vessel to the northeast U.S.Footnote 14
- The Irving Oil rail terminal has an estimated unloading capacity of 200 Mb/d,Footnote 15 though it has not been used much since 2015.
Natural Gas
- The Maritimes relies almost entirely on imported natural gas. Natural gas is imported from the U.S. via pipeline and liquefied natural gas (LNG). LNG is imported from global sources to the Saint John LNG import terminal, formerly known as Canaport LNG terminal, in Saint John, New Brunswick.Footnote 16
- New Brunswick imports natural gas from the U.S. on the bi-directional Maritimes & Northeast Pipeline (M&NP) (Figure 4).Footnote 17 The U.S. portion of M&NPFootnote 18 connects to the Canadian portion of M&NP at St. Stephen, near the New Brunswick/Maine border. From there, M&NP delivers natural gas to major markets within New Brunswick and continues to its ends in Halifax and Goldboro, Nova Scotia.Footnote 19 M&NP can also receive natural gas from the Emera Brunswick Pipeline near St. Stephen, New Brunswick.
- Though MN&P operates bi-directionally, it has been used almost exclusively for importing natural gas into Canada since approximately 2017. In 2023, M&NP imported 189 MMcf/d, while only exporting 0.02 MMcf/d.
- The Emera Brunswick PipelineFootnote 20 was constructed in 2009 to deliver re-gasified LNG imports from the Saint John LNG import terminal to a connection with M&NP at St. Stephen for distribution through the Martimes and northeast U.S. The Brunswick Pipeline transported an average of 21 MMcf/d in 2023, a fraction of its 820 MMcf/d capacity.
- Liberty Utilities, formerly Enbridge Gas New Brunswick, distributes natural gas to over 12,400 customers in 14 communities throughout southern New Brunswick.Footnote 21 Liberty Utilities is regulated by New Brunswick Energy and Utilities Board and has more than 852 km of natural gas pipeline throughout the province.Footnote 22
Liquefied Natural Gas (LNG)
- New Brunswick has Canada’s only large-scale LNG import terminal. The Saint John LNG terminal, formerly known as Canaport LNG, began importing LNG in 2009. In 2022, import volumes averaged 29.5 MMcf/d, far below send out capacity of 1,200 MMcf/d. The terminal now primarily imports LNG for peak winter demand.
- Saint John LNG was initially a partnership between Repsol, with a 75% stake, and Irving Oil, with the remaining 25% stake. Saint John LNG is now 100% owned by Repsol.Footnote 23
Electricity
- In 2023, New Brunswick had 3.0 TWh of net interprovincial and international electricity outflows.
- New Brunswick exports electricity to Prince Edward Island (PEI) via two sub-sea cables, and it also exports to Maine.
- New Brunswick imports from Quebec and Maine. In 2020, Hydro-Québec and NB Power signed a power purchase agreement for Quebec to deliver a total of 47 TWh of electricity to New Brunswick between now and 2040.Footnote 24 These imports will be transmitted over existing connections.
- NB Power operates the transmission system and acts as the system operator in the province, operating approximately 6,900 km of power lines in New Brunswick. NB Power also oversees 15 connections with an import capacity of 2,378 MW and an export capacity of over 2,000 MW.Footnote 25 These connections are with Maine, Quebec, Nova Scotia, and PEI.
Energy Consumption and Greenhouse Gas (GHG) Emissions
Total Energy Consumption
- End-use demand in New Brunswick was 209 petajoules (PJ) in 2020. New Brunswick’s industrial sector made up 55% of its demand, followed by transportation at 21%, residential at 16%, and commercial at 8% (Figure 5). New Brunswick’s total energy demand was the seventh largest in Canada, and the fifth largest on a per capita basis.
- RPPs were the largest fuel type consumed in New Brunswick, accounting for 103 PJ, or 49% of total end-use energy consumption. Electricity and natural gas accounted for 48 PJ (23%) and 29 PJ (14%), respectively (Figure 6).
Refined Petroleum Products
- New Brunswick’s motor gasoline demand in 2022 was 1,101 litres per capita, 6% above the national average of 1,035 litres per capita.
- New Brunswick’s diesel demand in 2022 was 480 litres per capita, 38% below the national average of 772 litres per capita.
- RPP prices in New Brunswick have been regulated by the New Brunswick Energy and Utilities Board since 2006. Maximum prices at the retail level for gasoline, diesel, furnace oil, and propane are set on a weekly basis (or as required).Footnote 26
Natural Gas
- In 2023, New Brunswick consumed an average of 54.8 MMcf/d of natural gas, which was 0.5% of total Canadian demand.
- New Brunswick’s largest consuming sector for natural gas was the industrial sector, which consumed 45.2 MMcf/d in 2023. The commercial and residential sectors consumed 8.4 MMcf/d and 1.2 MMcf/d, respectively.
Electricity
- In 2020, annual electricity consumption per capita in New Brunswick was 17 megawatt-hours (MWh). New Brunswick had the fifth highest per capita electricity consumption in Canada and consumed 17% more than the national average.
- New Brunswick’s largest consuming sector for electricity in 2020 was residential (7.3 TWh). The industrial and commercial sectors consumed 5.9 TWh and 3.8 TWh, respectively.
- Electricity demand is highest in the winter because of space heating requirements for homes and businesses. Demand is lower during the warmer months, and surplus electricity is exported to neighbouring provinces and states.
GHG Emissions
- New Brunswick’s GHG emissions in 2022 were 12.5 megatonnes of carbon dioxide equivalent (MT CO2e).Footnote 27 New Brunswick’s emissions have declined 23% since 1990 and 38% since 2005.
- New Brunswick’s emissions per capita are 15.4 tonnes CO2e, approximately 15% below the Canadian average of 18.2 tonnes per capita.
- The largest emitting sectors in New Brunswick are electricity generation at 28%, transportation at 25%, and oil and gas (primarily petroleum refining) at 23% of emissions (Figure 7).
- New Brunswick GHG emissions from the oil and gas sector in 2022 were 2.9 MT CO2e. Of this total, 2.8 MT were attributable to petroleum refining, and 0.1 MT were attributable to production, processing, and transmission.
- In 2022, New Brunswick’s power sector emitted 3.4 MT CO2e emissions, which represents about 7% of Canada’s GHG emissions from power generation. Through a renewable portfolio standard,Footnote 28 the province of New Brunswick met its goal to increase renewables’ share of electricity serving in-province sales to 40% by 2020.Footnote 29 Imports of renewable energy from other jurisdictions and energy efficiency improvements both qualify for meeting the standard.
- The greenhouse gas intensity of New Brunswick’s electricity grid, measured as the GHGs emitted in the generation of the province’s electric power, was 330 grams of CO2e per kilowatt-hour (g CO2e/kWh) in 2022. This is a 21% reduction from the province’s 2005 level of 420 g CO2e/kWh. The national average in 2022 was 100 g CO2e/kWh (Figure 8).
Energy Authorities
- New Brunswick Energy and Utilities Board
- New Brunswick Natural Resource and Energy Development
- New Brunswick’s Climate Change Action Plan
- Powering our Economy and the World with Clean Energy: Our Path Forward to 2035
- New Brunswick Energy and Utilities Board: Current Petroleum Prices
- Canada's Renewable Power: New Brunswick
- Date modified:

