YT NT NU BC AB SK MB ON QC NB NL NS PE
On this page:
- Key Takeaways
- Electricity and Renewable Energy Trends
- Recent and Planned Renewable Electricity and Energy Storage Projects
Northwest Territories
Electricity generation in Northwest Territories (NWT) is shaped by vast geography, low population density, mining operations, and remote communities. The territory operates two main regional grids—Snare and Taltson—serving most communities on the North and South shore of the Great Slave Lake. Most smaller and remote communities rely on isolated mini grids powered by diesel or natural gas generators.Footnote 1 NWT is not connected to southern provincial grids, making energy delivery relatively more challenging both logistically and economically.
In most communities, electricity generation is managed by the Northwest Territories Power Corporation (NTPC), a Crown corporation. In some communities, power is generated and/or distributed by Naka Power, a joint partnership between Denendeh Investments Incorporated (DII), and ATCO.
The figures in this profile combine utility generation serving communities with industrial generation dedicated to remote mine sites. Industrial facilities are operated by the mines, separate from NTPC and Naka Power, and are not connected to community grids. As a result, much of the growth in renewable energy, such as wind, reflects mine development rather than community supply.
Key Takeaways
- In 2023, NWT generated 685.1 gigawatt-hours (GWh) of electricity, with 151.4 GWh (22.1%) coming from renewable sources.
- Renewable capacity grew from 56 megawatts (MW) in 2010 to 70 MW in 2023, a 25.0% increase. This growth came from wind (13 MW) and solar (1 MW).
- In 2023, NWT produced 33% of its residential space heating with biomass, the highest in the country.
Electricity and Renewable Energy Trends
Hydroelectricity remains the primary renewable energy source in NWT, accounting for an average of 39% of total electricity generation between 2010 and 2023.
Lower-than-average (based on data from the last 20 years) water levels in recent years reduced hydroelectric outputFootnote 2Footnote 3. In 2023, hydroelectricity supplied 134.8 GWh, or 19.7% of total generation, down from typical levels, leading to increased reliance on petroleum-fired generation by electrical utilities.
Wind power’s contribution to grid-connected generation remains small. In 2023, four wind turbines at the Diavik Diamond Mine produced approximately 30 GWh, or 4.4% of the territory’s total electricity generation.Footnote 4 While this 9.2 MW of capacity is off-grid and serves only the mine, it accounts for a substantial share of NWT’s wind generation. Additionally, the NTPC-owned Inuvik High Point Wind Project added 3.5 MW of new wind capacity in 2023. The planned closure of the Diavik Mine in 2026 would reduce the territory’s wind capacity by 9.2 MWFootnote 5.
Solar energy remains limited—various installations contributed an estimated 0.2 GWh in 2023—around 0.03% of total generation. Community-scale and net-metered projects have been gradually expanding. NWT’s Net Metering Program enables residents to receive energy credits for surplus solar electricity they send to the gridFootnote 6Footnote 7.
In April 2025, NWT government instructed the Public Utility Board to modernize its electricity regulations by developing a new Independent Power Producer policy, increasing community renewable energy generation caps and updating its net-metering programFootnote 8.
NWT faces persistent challenges in delivering electricity due to extreme weather, aging infrastructure, and geographic isolation. In response, the territorial government and utilities continue to invest in energy efficiency, renewable integration, and studies exploring the interconnection of isolated grids. These initiatives aim to improve grid reliability, reduce diesel dependence, and support long-term goals of energy affordability, sustainability, and climate resilienceFootnote 9.
Figures 1 and 2 show historical trends in generation and installed capacity, respectively. Figure 2 also includes planned capacity additions for 2024–2030. The planned portion of the figure may be conservative; additional projects could be announced and come online before 2030 and some projects in the outlook might not proceed.
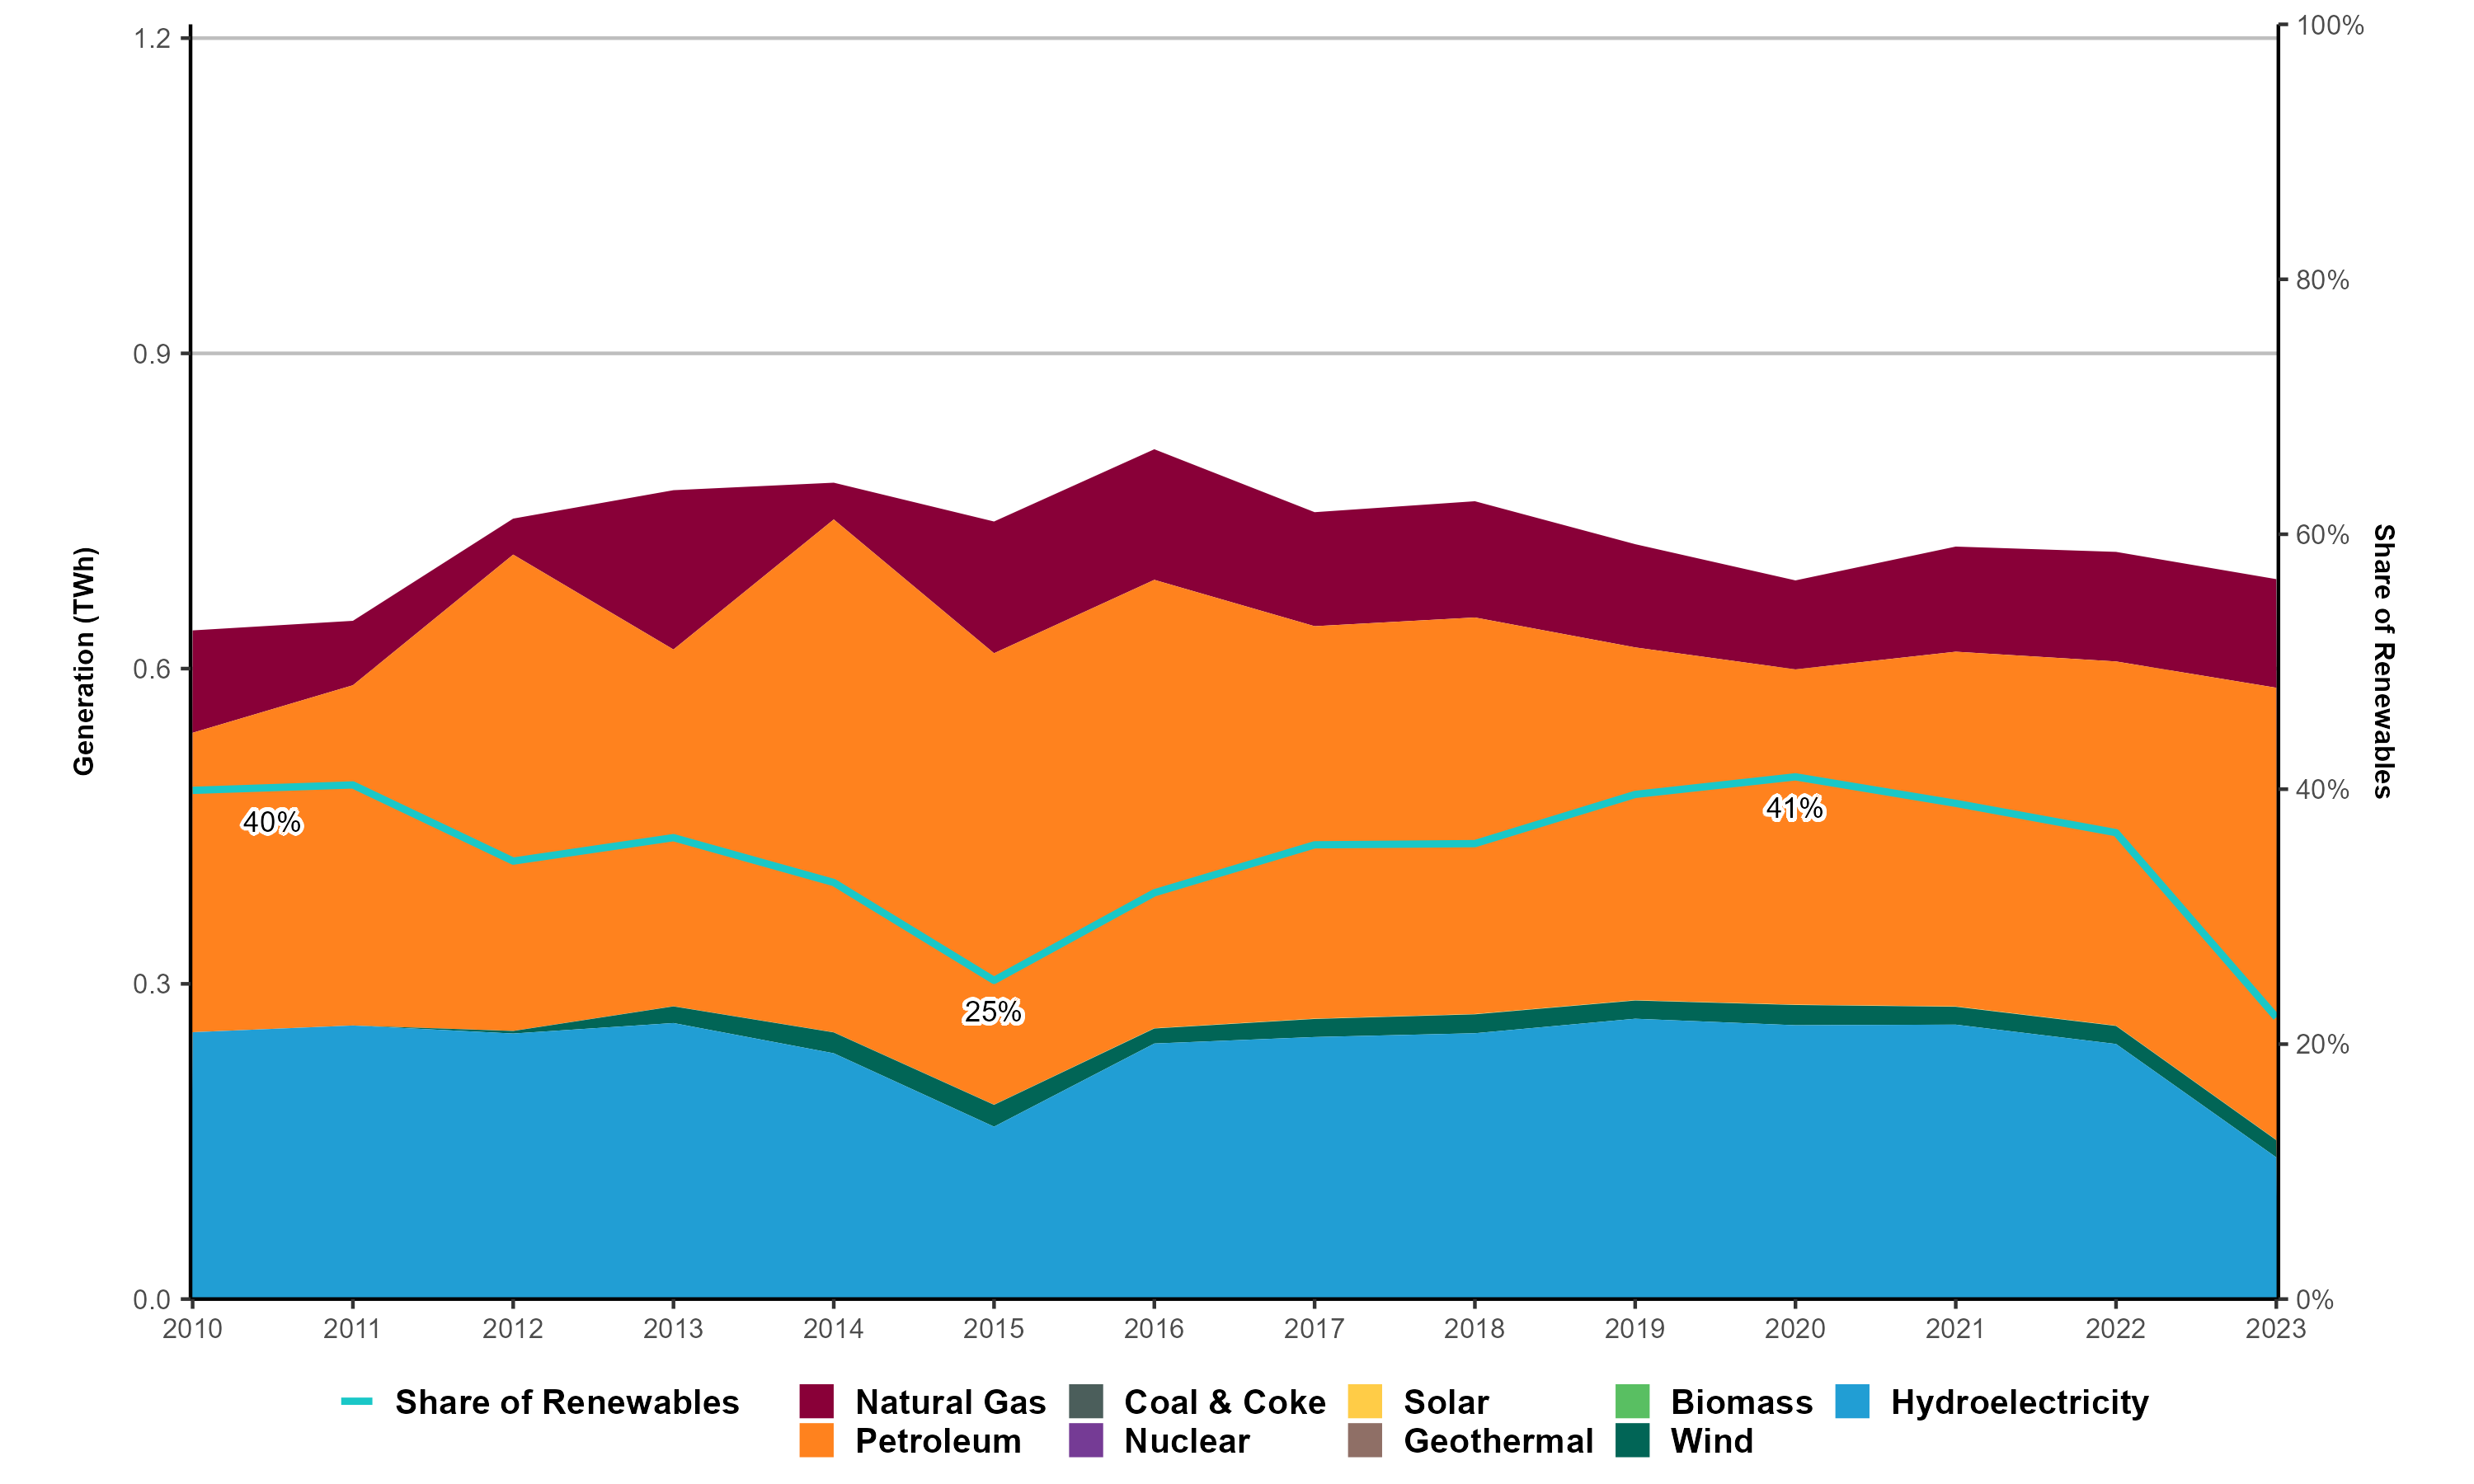
Figure 1: Electricity Generation by Type in NWT
Source and Text Alternative
Source: The primary source for electricity generation data comes from Statistics Canada. Table 25-10-0020-01, 25-10-0084-01, and 25-10-0028-01 are combined to display data for all categories and years.
Data: Electricity Generation by Type in NWT [XLSX 21 KB]
Text Alternative: This graph illustrates electricity generation from 2010 to 2023 in NWT. In 2010, NWT’s total generation was 636.4 GWh (40.0% renewable). In 2023, total generation was 685.1 GWh (22.1% renewable). Most generation in 2023 came from petroleum (62.8%), hydroelectricity (19.7%), natural gas (15.1%), and wind (2.4%).
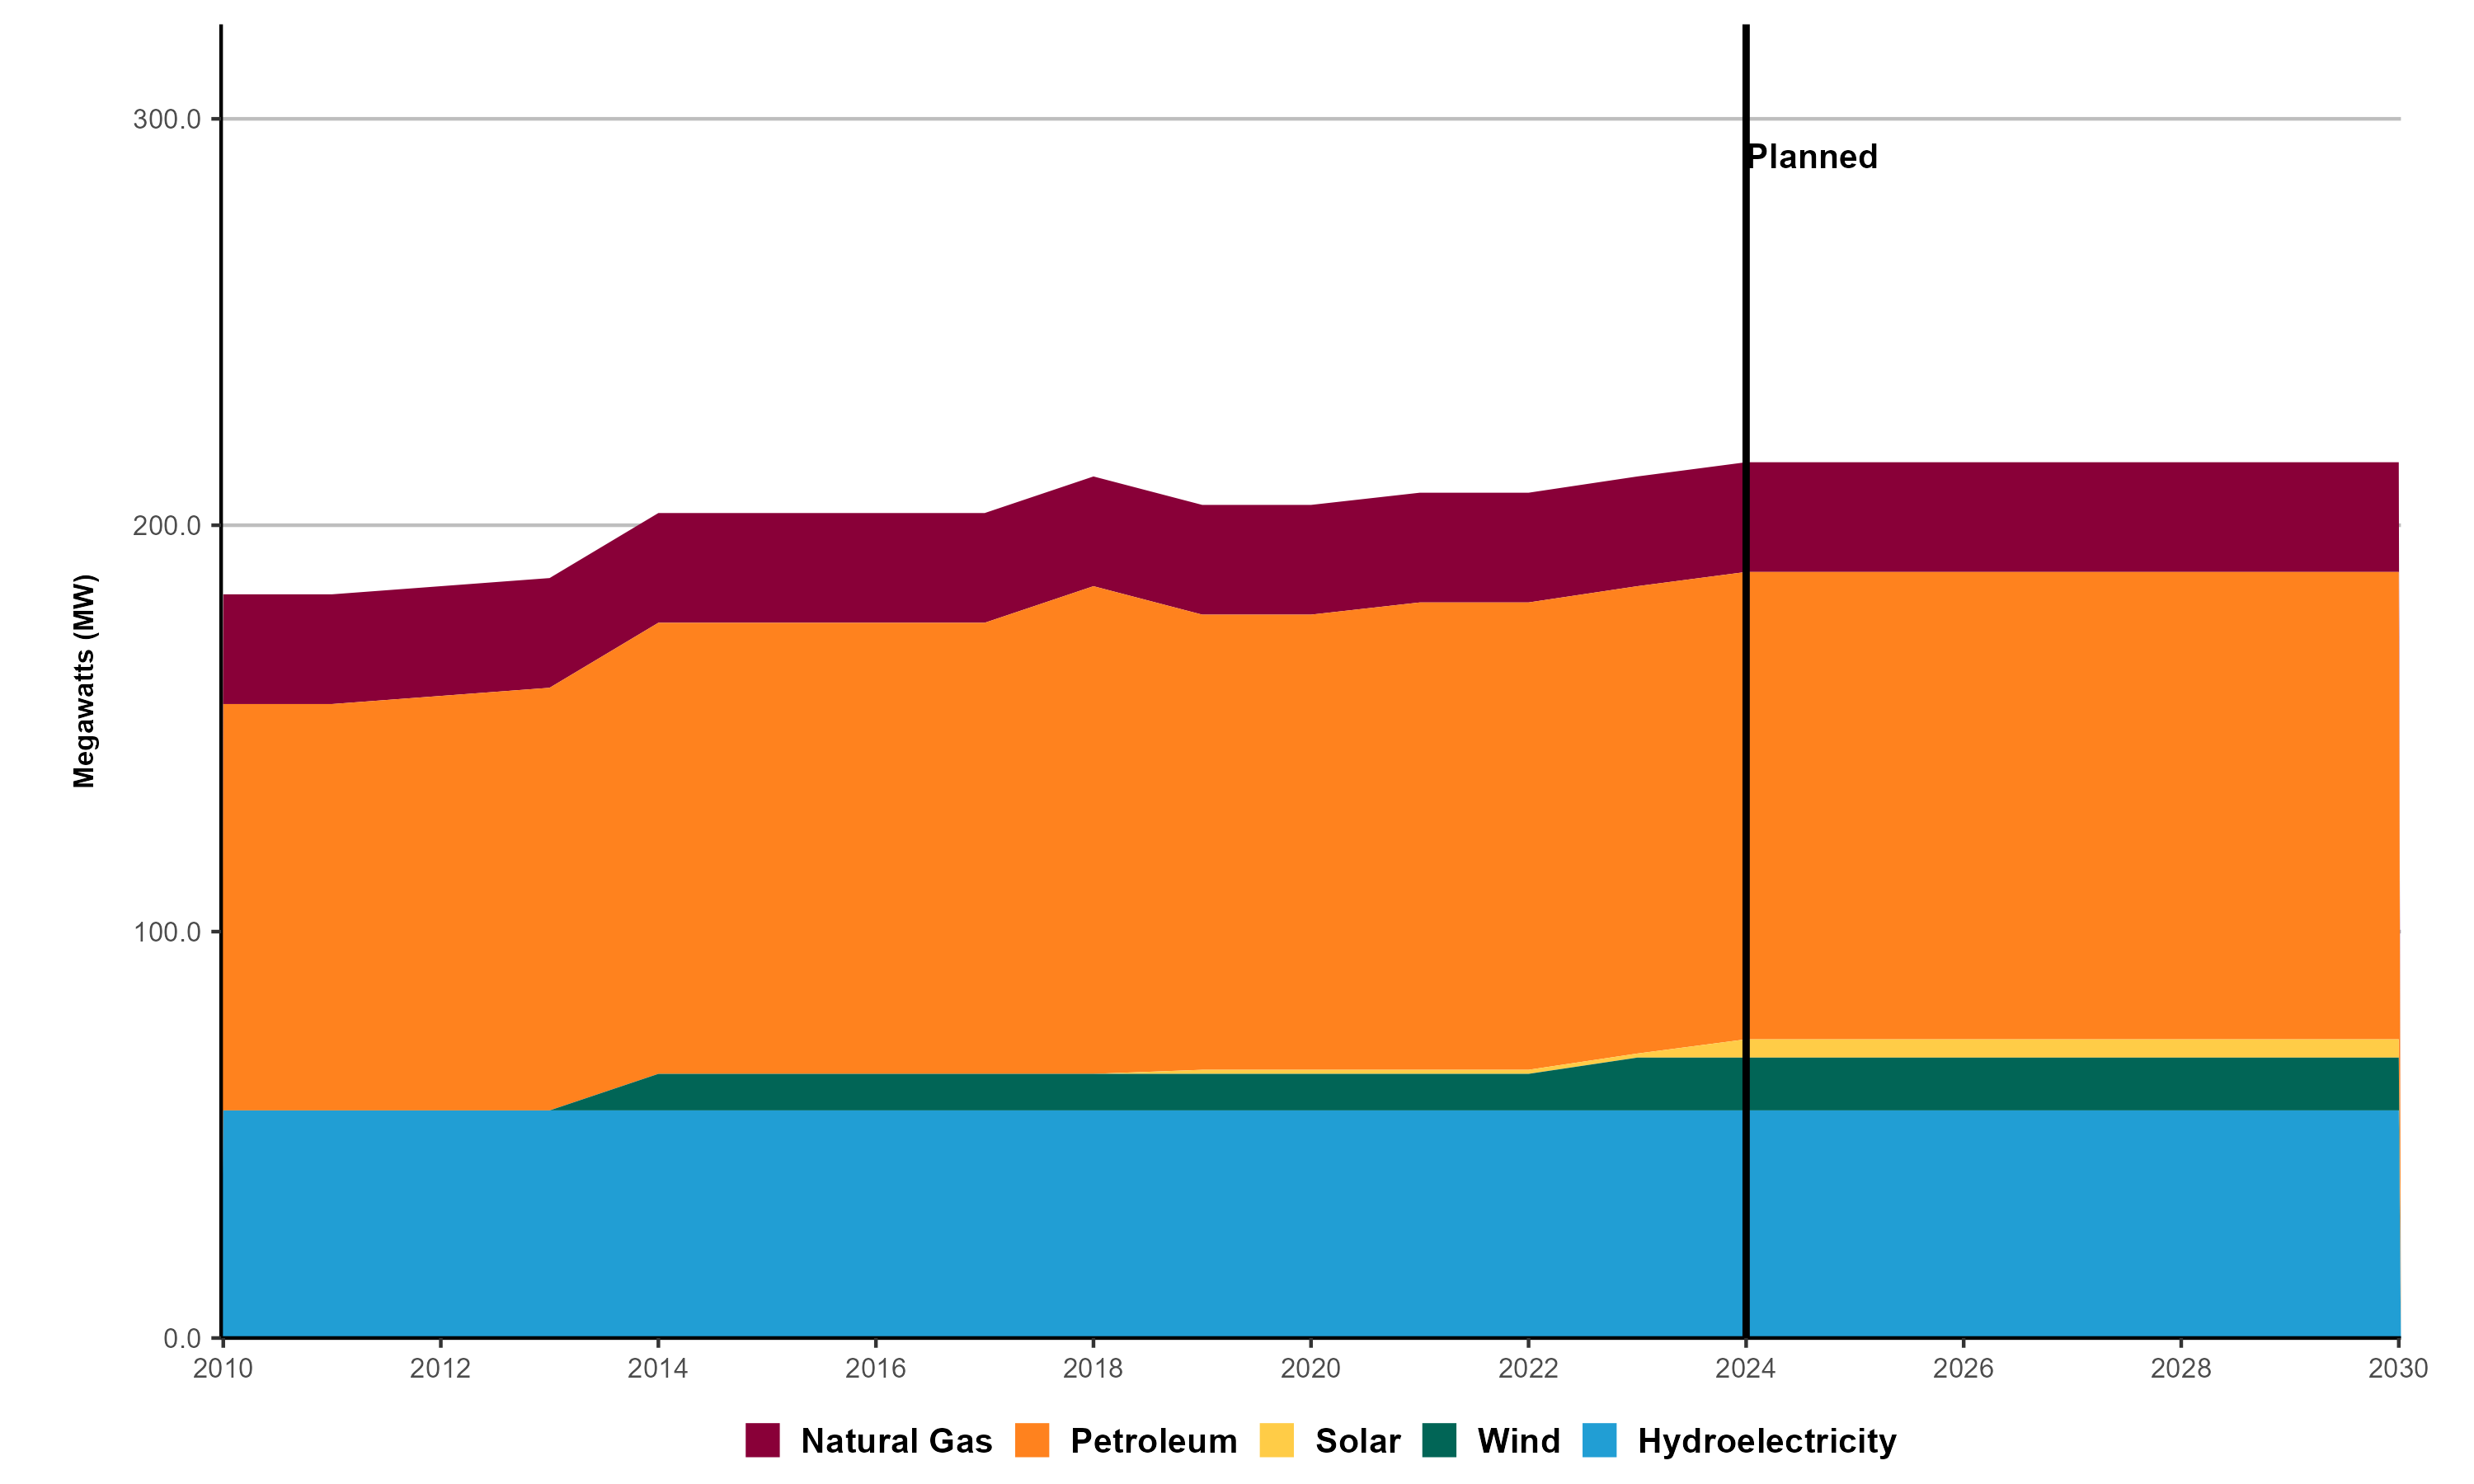
Figure 2: Electricity Capacity and Future Changes in NWT
Source and Text Alternative
Source: The primary source for electricity generation capacity data comes from Statistics Canada. Table 25-10-0022-01 and Table 25-10-0023-01 are combined to display data for all of the categories. It is supplemented by additional project-level data for planned capacity from provincial governments, utilities, and system operators, as well as industry associations.
Data: Electricity Capacity and Future Changes in NWT [XLSX 20 KB]
Text Alternative: This graph illustrates historical electricity generation capacity from 2010 to 2030 in NWT. In 2010, the province’s total installed electricity capacity was 183 MW (31.0% renewable). In 2023, capacity grew to 212 MW (33.0% renewable). In 2030, based on planned capacity additions, capacity reaches 216 MW (34.1% renewable).
NWT has around 3 MW of battery energy storage operating, with no other projects planned before 2030.
In 2023, the territory had 1.2 MW of distributed solar power capacityFootnote 10.
The Northwest Territories’ 2030 Energy Strategy sets a target for 40% of heating requirements in buildings to be met by renewable sources, particularly biomass, by 2030. Biomass has become a central part of the territory’s heating supply: by 2023, it accounted for about one-third of residential space heating, the highest share in Canada. Biomass boiler capacity in community, light industrial, institutional, commercial, and agricultural sectors grew from 10 MW in 2010 to 36 MW in 2023, ranking just behind Ontario, Quebec, B.C., and Manitoba. NWT does not produce solid biofuels and relies on wood pellet imports from Alberta and B.C.
Recent and Planned Renewable Electricity and Energy Storage Projects
As of September 2025, there were no planned renewable power or energy storage projects in NWT. Recent projects, such as the 2023 3.5 MW Inuvik High Point Wind Project, contributed to overall generation capacityFootnote 11. Other projects such as the Taltson Hydro Expansion Project, are being considered or proposed for future developmentFootnote 12.
- Date modified: