YT NT NU BC AB SK MB ON QC NB NL NS PE
On this page:
- Key Takeaways
- Electricity and Renewable Energy Trends
- Recent and Planned Renewable Electricity and Energy Storage Projects
Saskatchewan
Saskatchewan historically relied on coal and natural gas for electricity generation. Since 2010, the province has shifted some coal generation to natural gas and expanded its capacity in wind, and to a lesser extent solar, biomass and hydroelectricity, while also implementing carbon capture, utilization and storage (CCUS) technologies.
The province’s electricity system is primarily operated by SaskPower, a government-owned utility responsible for generation, transmission, and distribution. Independent power producers also contribute to Saskatchewan’s grid by selling electricity to SaskPower via power purchase agreements. The electricity sector is regulated at the provincial level, overseeing rate reviews, safety standards, and system reliability.
Key Takeaways
- In 2023, Saskatchewan generated 24.9 terawatt-hours (TWh) of electricity, with 4.8 TWh (19.5%) coming from renewable sources.
- Renewable capacity grew from 1,027 megawatts (MW) in 2010 to 1,537 MW in 2023, a 49.6% increase. Most of this growth came from wind (454 MW), followed by solar (39 MW), and biomass (10 MW).
Electricity and Renewable Energy Trends
By 2020, natural gas had displaced coal as the dominant fuel for electricity generation. Coal generation declined by 41% between 2010 and 2023, generating 7.9 TWh (31.9% of total generation) in 2023. In contrast, natural gas generation grew by 383% over the same period, reaching 12.1 TWh (48.6%) in 2023. One of Saskatchewan’s three operating coal-fired power stations, the Boundary Dam Power Station, became the world’s first to successfully implement carbon capture and storage (CCS) technology in 2014, and has captured nearly seven million tonnes of carbon dioxide as of March 2025Footnote 1Footnote 2.
Between 2010 and 2023, Saskatchewan added a net 510 MW of renewable capacity, driven primarily by wind (454 MW), solar (39 MW) and bioenergy (10 MW). This outpaced growth in total generation capacity, increasing the renewable share of total installed capacity from 25% to 28%. However, due to lower hydroelectric output and a sharp increase in natural gas generation, the share of electricity generated from renewable energy declined from 21% in 2010 to 19% in 2023.
Figures 1 and 2 show historical trends in generation and installed capacity, respectively. Figure 2 also includes planned capacity additions for 2024–2030. The planned portion of the figure may be conservative; additional projects could be announced and come online before 2030 and some projects in the outlook might not proceed.
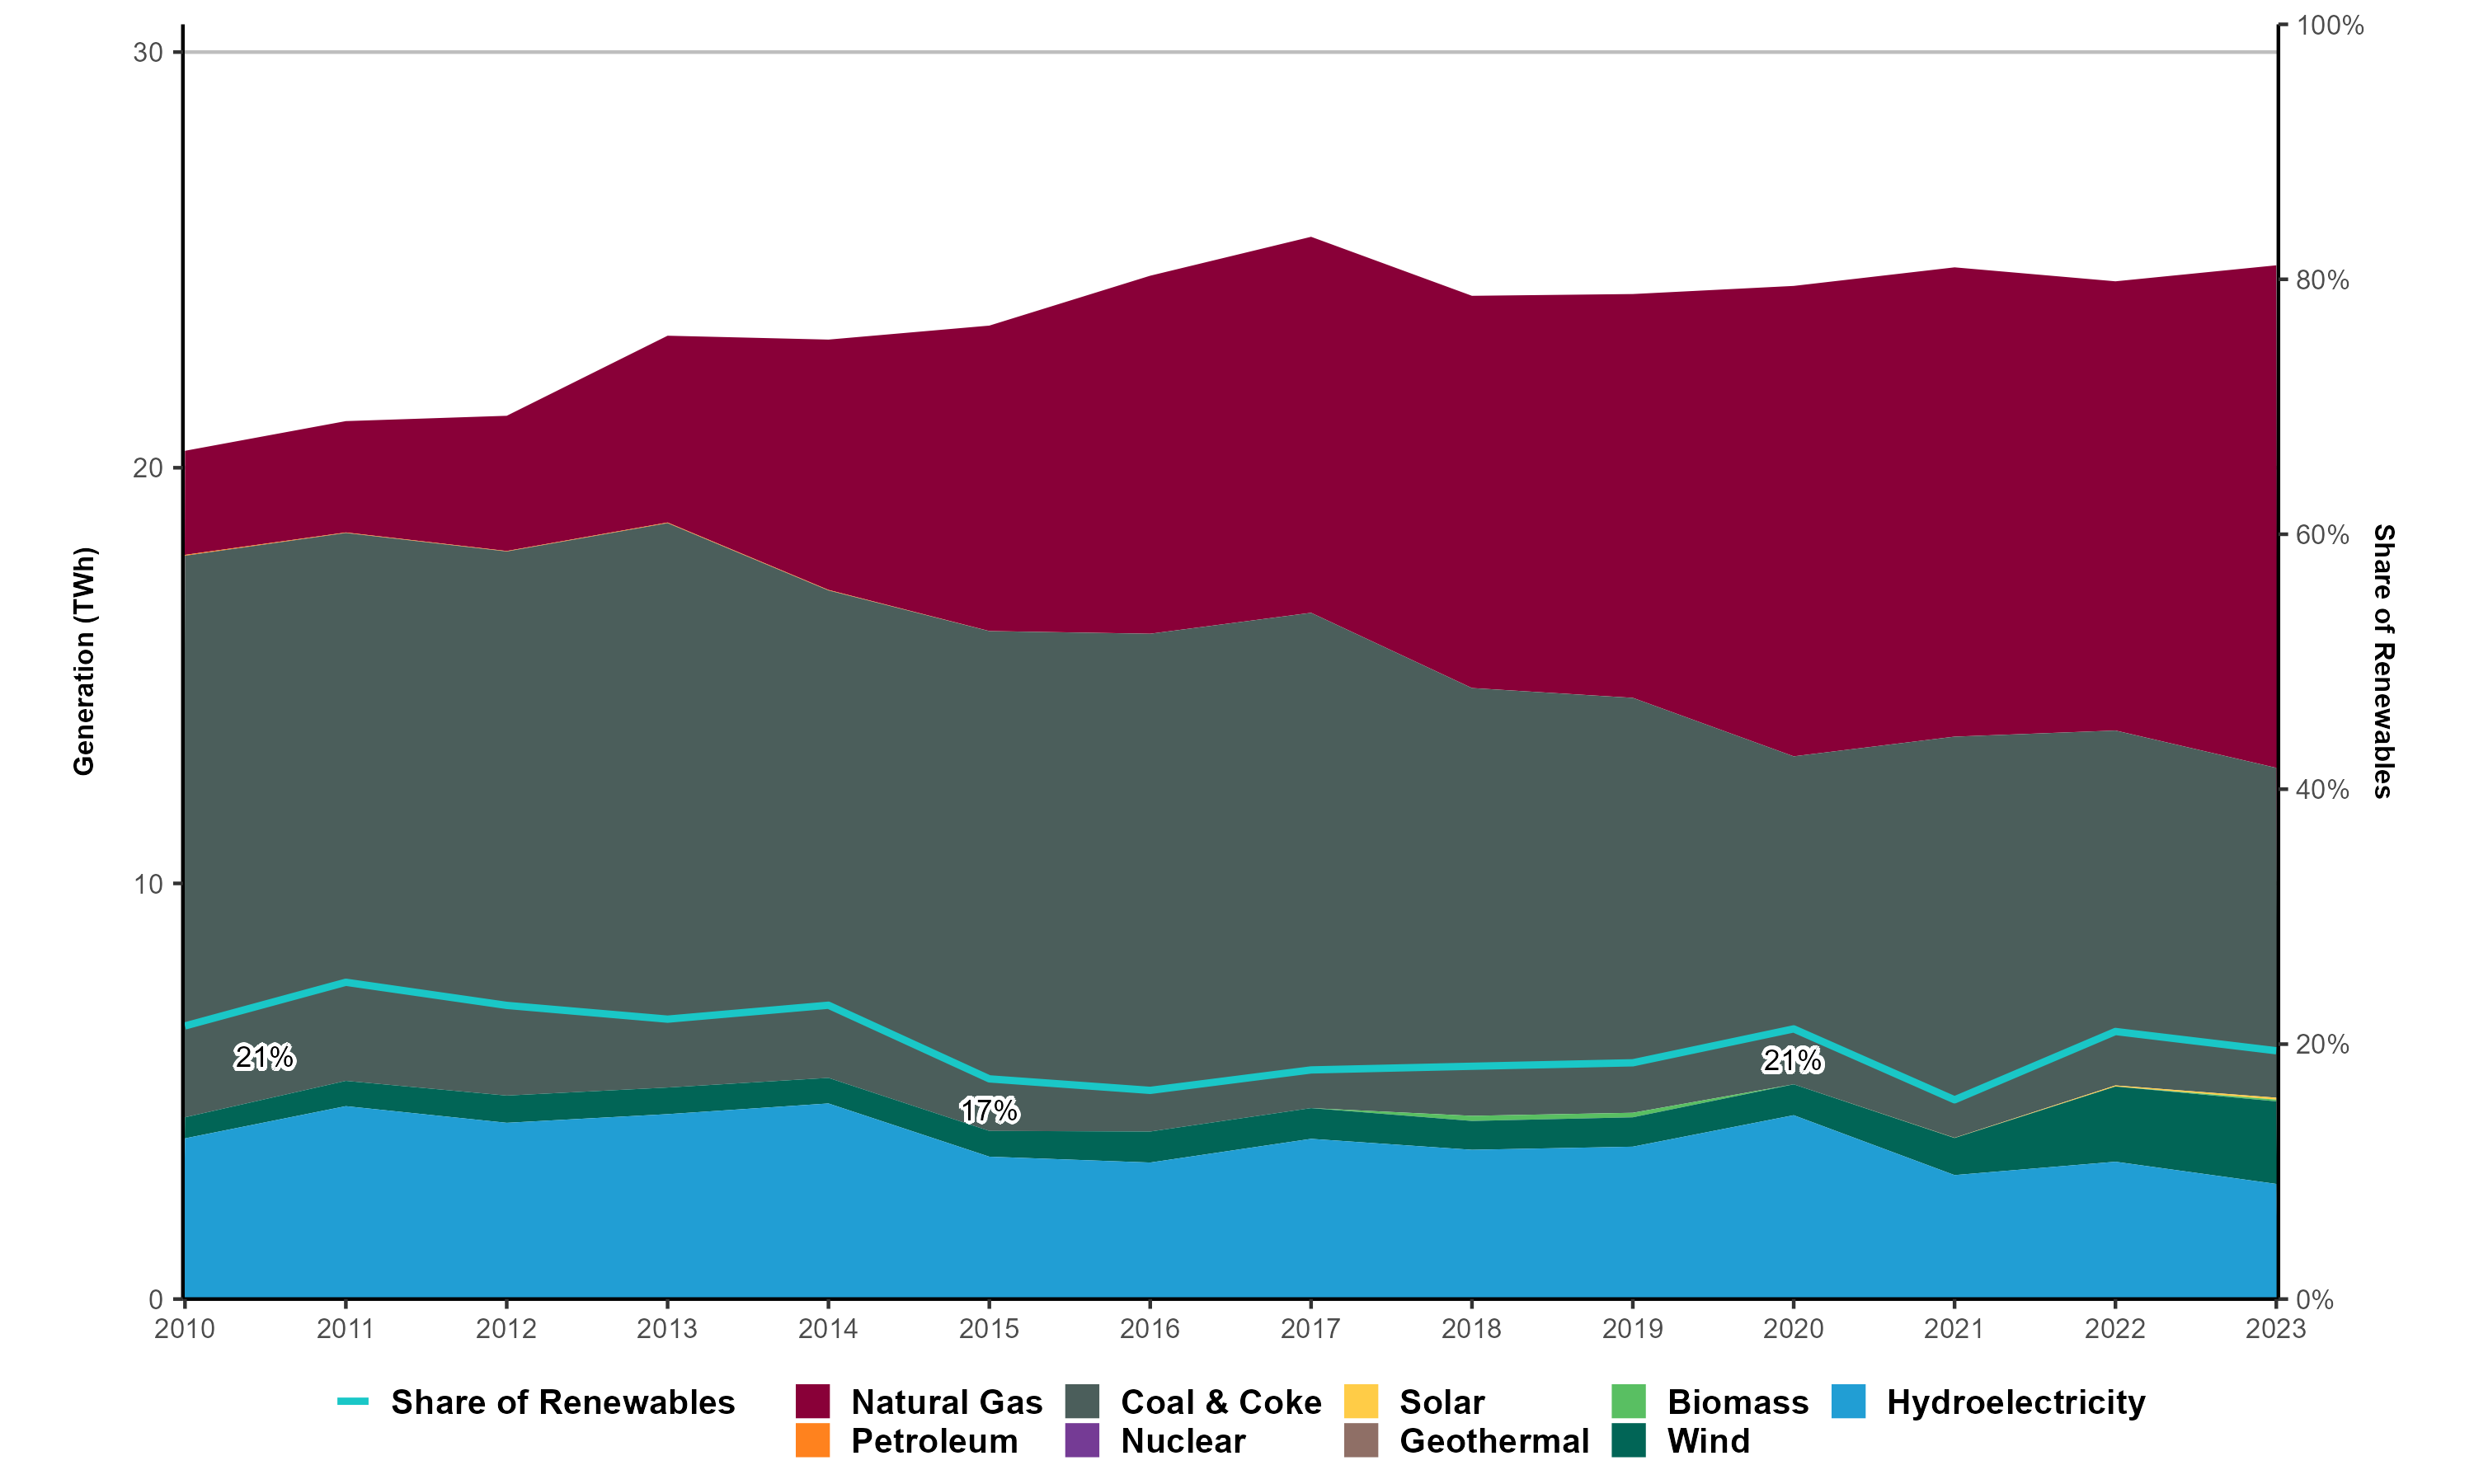
Figure 1: Electricity Generation by Type in Saskatchewan
Source and Text Alternative
Source: The primary source for electricity generation data comes from Statistics Canada. Table 25-10-0020-01, 25-10-0084-01, and 25-10-0028-01 are combined to display data for all categories and years.
Data: Electricity Generation by Type in Saskatchewan [XLSX 21 KB]
Text Alternative: This graph shows electricity generation from 2010 to 2023 in Saskatchewan. In 2010, Saskatchewan’s total generation was 20.4 TWh (21.4% renewable). In 2023 total generation was 24.9 TWh (19.5% renewable). Most generation in 2023 came from natural gas (49%), coal (32%), and hydroelectricity (11%).
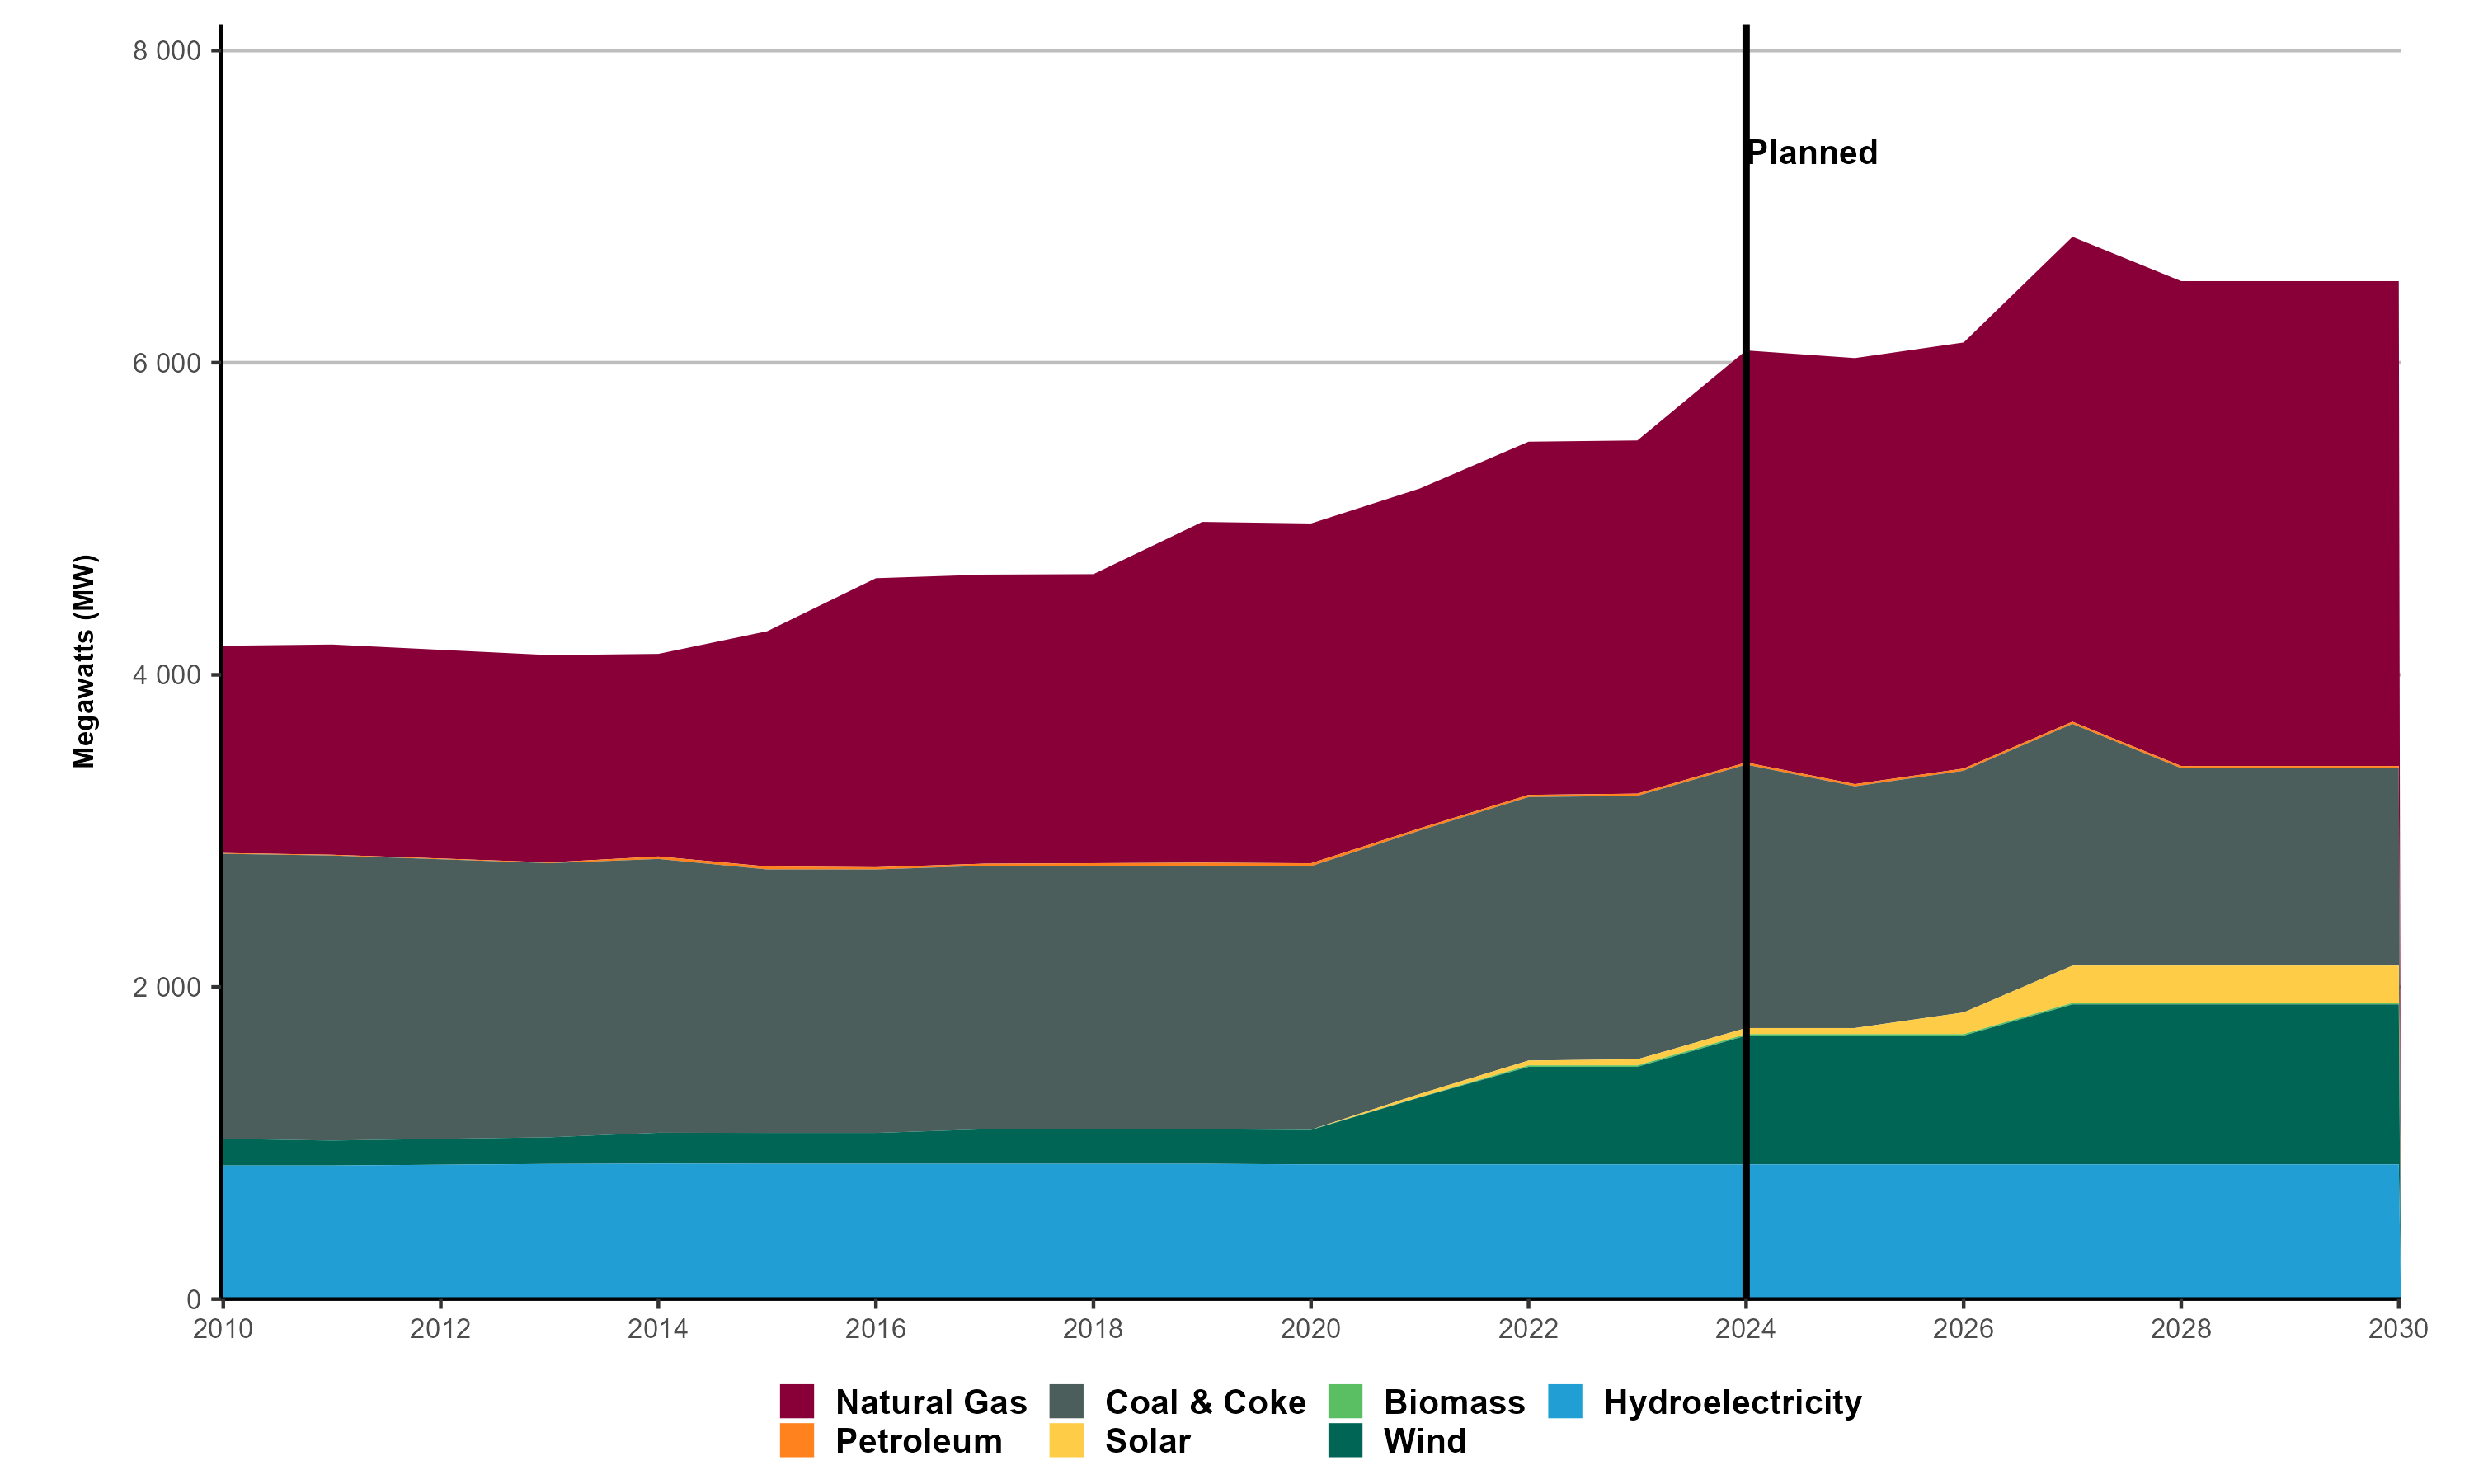
Figure 2: Electricity Capacity and Future Changes in Saskatchewan
Source and Text Alternative
Source: The primary source for electricity generation capacity data comes from Statistics Canada. Table 25-10-0022-01 and Table 25-10-0023-01 are combined to display data for all of the categories. It is supplemented by additional project-level data for planned capacity from provincial governments, utilities, and system operators, as well as industry associations.
Data: Electricity Capacity and Future Changes in Saskatchewan [XLSX 21 KB]
Text Alternative: This graph illustrates historical electricity generation capacity from 2010 to 2030 in Saskatchewan. In 2010, the province’s total installed electricity capacity was 4,186 MW (24.5% renewable). In 2023, capacity grew to 5,502 MW (27.9% renewable). In 2030, based on planned capacity additions, capacity reaches 6,523 MW (32.8% renewable).
Historically, Saskatchewan relied heavily on local, non-renewable electricity generation, largely because of its abundant, low-cost coal resources and a policy preference for self-reliance in electricity supply. Recent investments in battery storageFootnote 3, expanded renewable capacity, and ongoing analysis on small modular reactors (SMRs) suggest a shift toward a more diversified energy system.
Saskatchewan has 20.8 MW of energy storage capacity, 20 MW of which came online in 2024 with the Regina Battery Energy Storage SystemFootnote 4. As of June 2025, the La Plonge Solar and Battery Energy Storage System—featuring 0.75 MW of solar PV and 1 MWh of battery storage—is under construction, with completion targeted for 2026.Footnote 5 Also, in 2023, the province had 59.1 MW of distributed solar power capacityFootnote 6.
Saskatchewan has five ethanol production facilities totaling over 340 million litres/year and one biodiesel production facility. A planned renewable diesel project, the Co-op Refinery Complex was paused in 2025 due to economic conditions. In 2023, Saskatchewan produced about 3 PJ of solid biofuels.
Recent and Planned Renewable Electricity and Energy Storage Projects
This section highlights selected renewable electricity and energy storage projects in Saskatchewan, either recently completed or planned for development between 2025 and 2030. This list is not comprehensive and is based on information available as of September 2025.
- Rose Valley Wind Energy Project – A wind project developed by Potentia Renewables Inc., plans to add 200 MW of wind capacity by 2027Footnote 7.
- Turning Sun Solar – A solar project developed by Iyuhána Solar LP, a partnership between Greenwood Sustainable Infrastructure and Ocean Man First Nation, plans to add 100 MW of solar capacity by 2026Footnote 8.
- Southern Springs Solar Energy Facility – A solar project developed by Potentia Renewables Inc., plans to add 100 MW of solar capacity by 2027Footnote 9.
- Regina Battery Energy Storage System – In 2024, SaskPower commissioned the province’s first utility-scale battery energy storage system, with a capacity of 20 MWFootnote 10.
- Date modified: