British Columbia
Electricity Generation and Consumption
In 2018, B.C. generated 74.2 terawatt hours (TW.h) of electricity. About 91% of electricity in B.C. is produced from hydroelectric sources. (Figure 7) Biomass, is used to generate about 6% of B.C.’s electricity. Other sources of power include wind, natural gas, petroleum (used in off-grid communities), and solar.
In 2017, annual electricity consumption per capita in B.C. was 12.9 MW.h.
Figure 7: Electricity Generation by Fuel Type, 2018
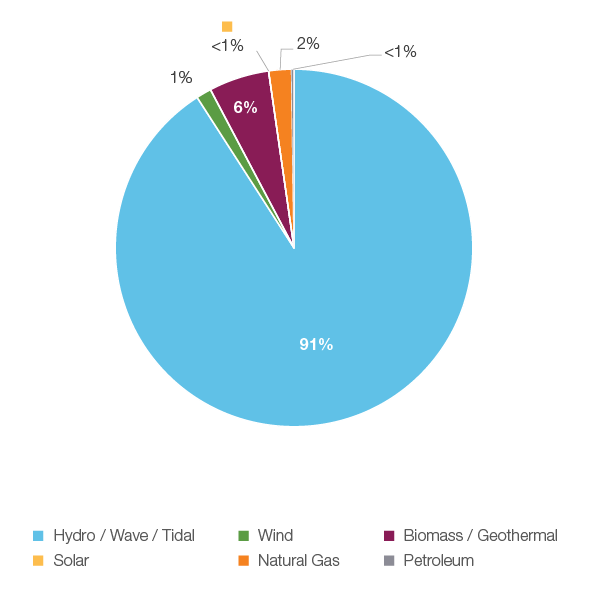
Source: CER - Canada’s Energy Future 2019
Description:
This pie chart shows electricity generation by source in B.C. A total of 74.2 TW.h of electricity was generated in 2018.
Electricity provider
BC Hydro and FortisBC are the two largest electricity providers in B.C. BC Hydro is a regulated crown corporation and the main electricity provider, FortisBC, a regulated private company, provides electricity service to B.C.’s southern interior. Some municipalities have their own electric utilities and there are also other private electric providers.
Electricity rates are set by the British Columbia Utilities Commission.
Each year FortisBC submits its revenue requirement to the BCUC for approval to determine the electricity rates for the following year.
Energy Charge
The electricity rate for the first 675 (kilowatt hour) kW.h per month is 9.45 ¢/kW.h. If a household uses more than 675 kW.h, the rate increases to 14.17 cents/kW.h.
Fortis BC has a bimonthly residential rate. The rate for the first 1 600 kW.h is 10.799 ¢/kW.h. If a household uses more than 1 600 kW.h, the rate per kW.h increases to 14.320 ¢/kW.h.
Basic Charge
BC Hydro charges a basic charge of $0.2090 per day to recover fixed costs.
Fortis BC has a Customer Charge of $34.56 per a two month billing period.
Figure 8: British Columbia Monthly Electricity Bill Break-down and Appliance Costs
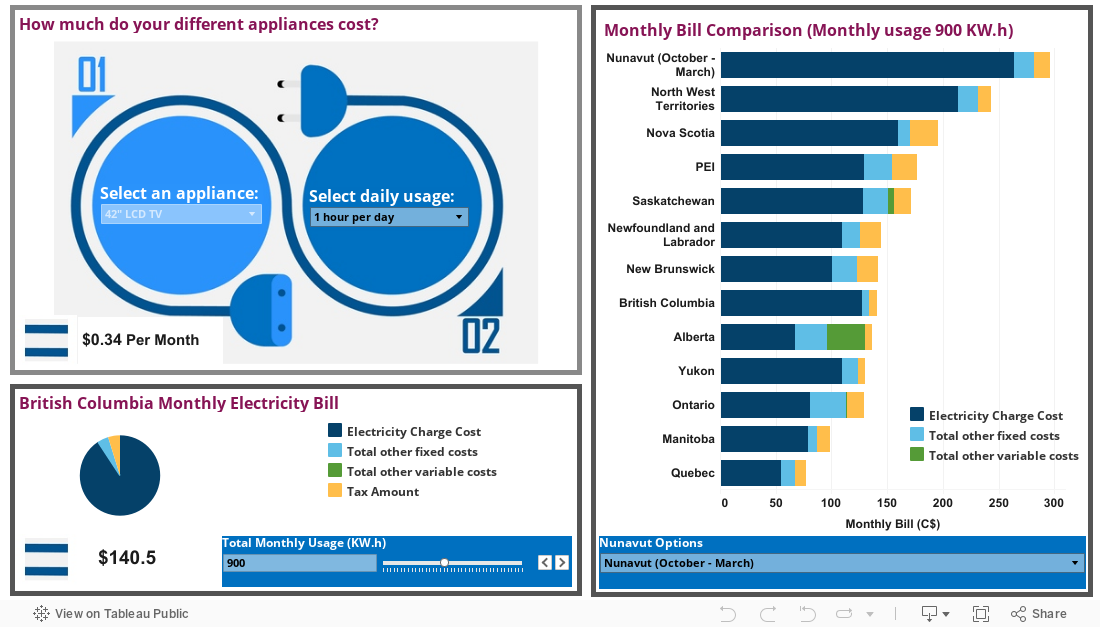
Source: BC Hydro
Description:
This interactive dashboard shows B.C. residents what it costs to run various appliances based on the different lengths of time they are operated. The data for these graphs is available.
- Date modified: