What is in a Canadian Residential Electricity Bill?
Introduction to electricity use
Millions of Canadians rely on electricity to power their household appliances, charge their electronics, and heat their homes
In 2017, annual electricity consumption per capita in Canada was 14.6 megawatt hours (MW.h).
Canada’s largest consuming sector for electricity was industrial at 238 TW.h. The residential and commercial sectors consumed 168 TW.h and 126 TW.h, respectively. The transportation sector consumed a negligible amount.
Watthours describe the total amount of electricity used over time. Watthours are a combination of how much electricity is used (watts) and the length of time it is used (hours). For example, a 100 watt light bulb, which draws 100 watts at any one moment, uses 100 watthours of electricity over the course of one hour.
Electricity generation
In 2018, Canada produced 647.7 terawatt hours (TW.h) of electricity. More than half of the electricity in Canada (61%) is generated from hydro sources. The remainder is produced from a variety of sources, such as fossil fuels (natural gas and petroleum), nuclear, wind, coal, biomass, solar.
Figure 1: Electricity Generation by Fuel Type, 2018
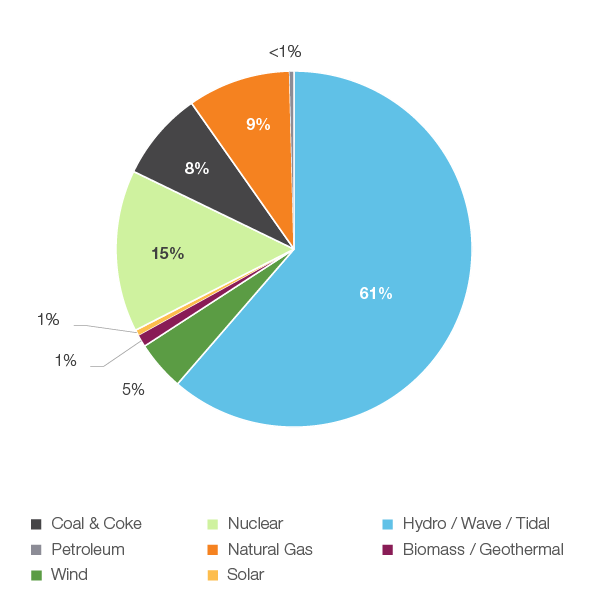
Source: CER – Canada’s Energy Future 2019
Description:
This pie chart shows electricity generation by source in Canada. A total of 647.7 TW.h of electricity was generated in 2018.
Canada is the third largest producer of hydropower in the world behind only China and Brazil.
Electricity Trade
Canada is a net exporter of electricity. In 2019, net exports (all to the United States (U.S.) were 47.0 TW.h.
The total value of Canada’s electricity exports was $2.5 billion Canadian dollars and the value of imports was $0.6 billion Canadian dollars, resulting in 2019 net exports of $1.9 billion.
Residential electricity use by province
Although electricity is used in all provinces to power household appliances and provide lighting, electricity can be used differently depending where you live. In provinces with an abundant supply of low cost electricity, electricity is used for home heating. Provinces which do not have abundant low-cost electricity or have other alternatives heat their homes with natural gas, heating oil, and sometimes wood burning stoves.
Provinces that use electricity for home heating tend to consume the most electricity. These are also the provinces with abundant hydro-electric resources like Quebec, B.C., Manitoba, and Newfoundland and Labrador.
The map and graph below show residential electricity use by province.
Provinces that use electricity for heating tend to use more electricity in the winter. On the other hand, provinces that use natural gas for heating tend to use more electricity in the summer for cooling.
Figure 2: Residential Energy Use by Fuel, 2017
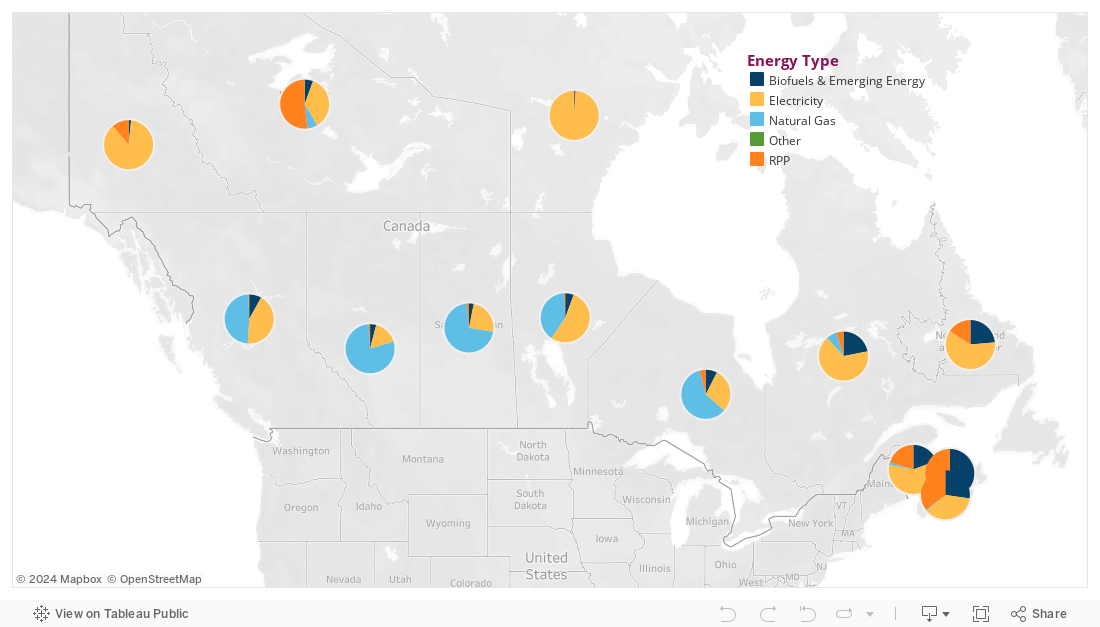
Source: CER – Canada’s Energy Future 2019
Description:
The map shows a pie chart for each province and territory that breaks down the type of energy used by household. The type of energy is broken out by biofuels and emerging energy, electricity, natural gas, refined petroleum products (RPP) and other. The energy source is different in each province.
Figure 3: Residential Electricity Consumption, 2017
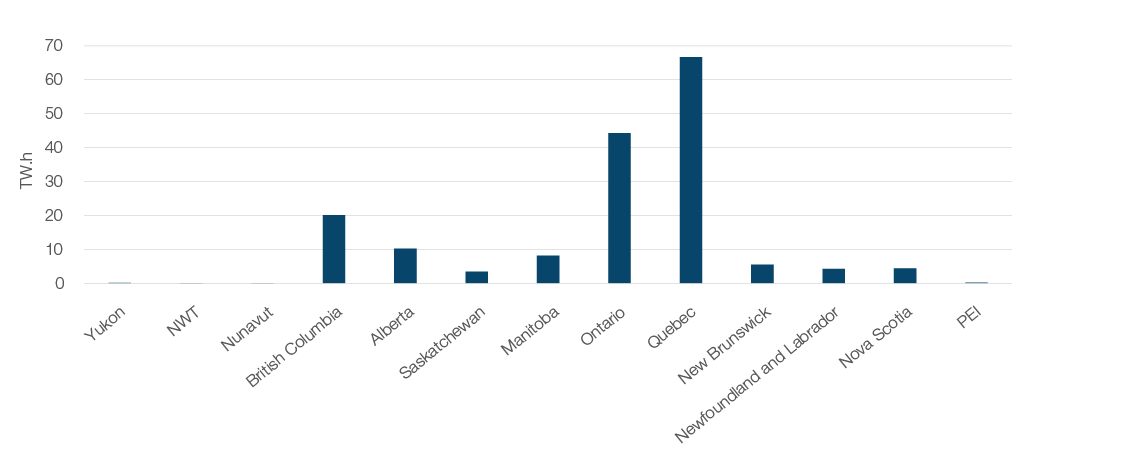
Source: CER – Canada’s Energy Future 2019
Description:
This bar chart shows residential electricity consumption for each province and territory in Canada. Some of the bars do not show up on the chart because their electricity consumption is very small compared to larger provinces. In 2017, residential consumption was: 0.18 TW.h for Yukon, 0.12 TW.h for NWT, 0.07 TW.h for Nunavut, 20.1 TW.h for B.C., 10.3 TW.h for Alberta, 3.5 TW.h for Saskatchewan, 8.2 TW.h for Manitoba, 44.2 TW.h for Ontario, 66.6 TW.h for Quebec, 5.6 TW.h for New Brunswick, 4.3 TW.h in Newfoundland and Labrador, 4.5 TW.h for Nova Scotia and 0.2 TW.h for Prince Edward Island.
Figure 4: Electricity Consumption per capita, 2017
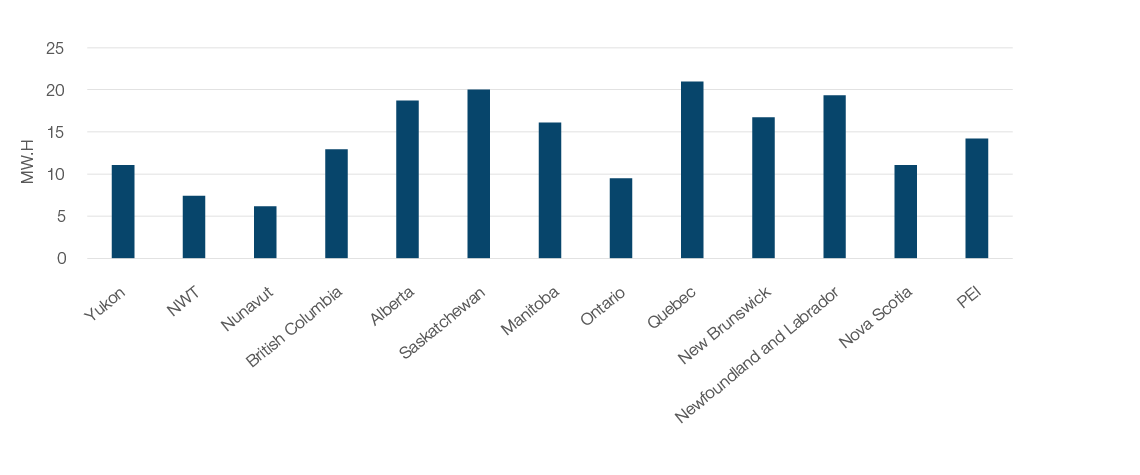
Source: CER – Canada’s Energy Future 2019
Description:
This bar chart shows electricity consumption per capita for each province and territory in Canada. Quebec ranks 1st in electricity consumption at 21.0 MW.h, followed by Saskatchewan at 20.0 MW.h, Newfoundland and Labrador at 19.3 MW.h, Alberta at 18.7 MW.h, New Brunswick at 19.3 MW.h, Manitoba at 16.1 MW.h, Prince Edward Island (PEI) at 14.2 MW.h, B.C. at 12.9 MW.h, Yukon at 11.0 MW.h, Nova Scotia at 11.1 MW.h, Ontario at 9.5 MW.h, NWT at 7.42 MW.h and Nunavut at 6.13 MW.h.
- Date modified: