Your feedback will help us improve and better meet your needs (opens in new tab)
Canada’s crude oil transportation system includes critical energy infrastructure for domestic oil production and consumption, as well as crude oil exports and imports. Crude oil transportation is complex. Different types of pipelines feed different types of facilities, including storage and processing facilities, which can be located anywhere throughout the system to enable operations or increase efficiency.
Figure 1: Crude oil system overview

Source: CER
Text Alternative: This diagram outlines the crude oil transportation system from the point of production, through processing, transportation on feeder and transmission pipelines, and ultimately to points of consumption, such as refineries, or export markets via pipeline, rail, or marine tanker.
Canada’s crude oil pipeline network has three types of pipelines:
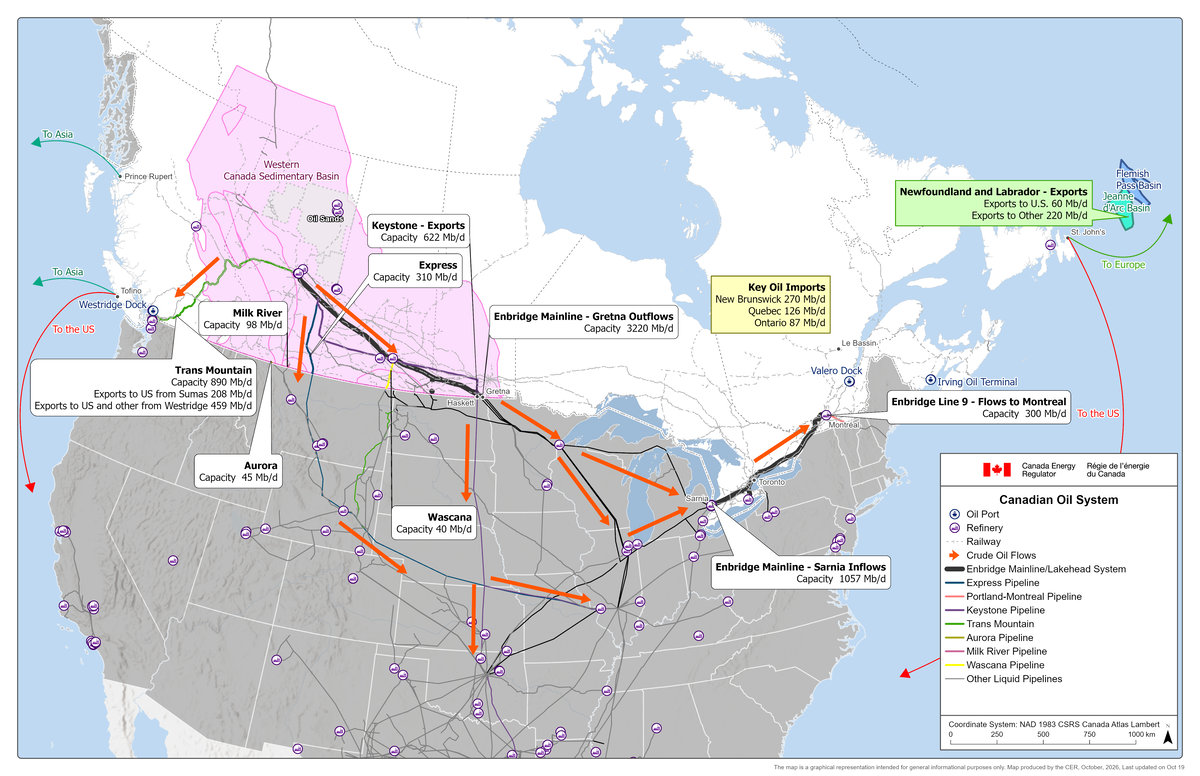
Many of Canada’s oil transmission pipelines carry supply from producing areas in western Canada to various delivery points, including refineries in western and central Canada, as well as export points. The map below shows the major oil pipelines regulated by the CER.
Figure 2: Canadian crude oil system
Source: CER; Geomatics Data Management Inc. (GDM)
Text Alternative: This map shows the major components of Canada’s crude oil system, including major transmission lines, railway, refineries, oil ports, and major Canadian crude oil production areas. Capacities shown are nameplate capacities (see the “Transportation capacity and utilization” section below for more detail), and export and import statistics are 2025 annual averages.
Canadian crude oil production continues to increase
In 2024, Canada was the fourth-largest crude oil producer in the world, producing 6.5% of total global supply.Footnote 1 Crude oil productionFootnote 2 averaged 5.3 million barrels per day (MMb/d) in 2025,Footnote 3 mostly from the oil sands in western Canada.Footnote 4 Canada continues to set new oil production records. From 2021 to 2025, average annual oil production from Alberta (bitumen, heavy crude oil, and light crude oil) increased 15%, while total condensateFootnote 5 production from Alberta and British Columbia (B.C.) increased 27%. Production has increased over the years because of growing use of steam assisted gravity drainage in the oil sands and horizontal wells in conventional and unconventional fields.
The Western Canada Sedimentary Basin (WCSB) has a significant amount of undeveloped oil resources,Footnote 6 especially bitumen. Based on 2025 bitumen production levels of 3.7 MMb/d, there are more than 200 years of viable bitumen resources available to be produced.Footnote 7
Non-WCSB crude oil production occurs offshore in Newfoundland and Labrador, in Ontario, and onshore in New Brunswick. Offshore Newfoundland and Labrador accounts for about 99% of the production outside the WCSB, averaging 239 MMb/d in 2025. Its production consisted of 59% light oil and 41% heavy oil.
Figure 3: Canada crude oil production by type
Source: CER – Estimated Production of Canadian Crude Oil and Equivalent
Text Alternative: This figure shows crude oil production by type in Canada from 2015 to 2025. Crude oil production was 3.9 MMb/d in 2015, 4.7 MMb/d in 2021, and 5.3 MMb/d in 2025. In 2025, in situ and mined bitumen made up two-thirds of crude oil production in Canada.
Production can be impacted by both planned and unplanned events. For example, oil sands production often decreases in the spring and fall when facility maintenance is typically scheduled. More significant production drops have resulted from unexpected events affecting oil sands facilities and global oil markets, such as financial crises, pandemics, and wildfires – impacting markets for various durations of time.
There are various grades, or qualities, of crude oil which have different physical characteristics. Canadian oil supply ranges from light oil to bitumen, which is an ultra-heavy oil. Lighter oils have lower viscosity and density than heavier oils, making them cheaper to transport and easier to refine. Heavy oil requires more processing and costly equipment. As a result, lighter oils generally trade at higher prices than heavy oils.
Bitumen, or crude bitumen,Footnote 8 is a thick, sticky form of crude oil and is the heaviest crude oil produced in Canada. When extracted from the ground, bitumen has the consistency of peanut butter at room temperature and is too thick to be transported by pipeline. Some bitumen is upgraded in a bitumen upgrader to a lighter synthetic crude oil (SCO)Footnote 9 by cracking bitumen’s large, ultraheavy molecules into smaller, lighter oil molecules and adding hydrogen to keep those lighter oil molecules saturated. The remaining bitumen is diluted with a diluent and then transported to markets as diluted bitumen. Diluents are lighter hydrocarbons, such as condensate or pentanes-plus (C5+). Condensate, which is extracted from natural gas production at well sites, is like a very light oil. Pentanes-plus have similar properties but are extracted further downstream at natural gas processing plants and fractionators.Footnote 10 Thus, because it is a mixture of about two-thirds ultraheavy parts and one-third very light parts, diluted bitumen’s average density becomes like heavy crude oil and is considered to be heavy oil by markets. As Canadian bitumen production has grown and the need for diluent has increased, demand for condensate and pentanes-plus has also continued to increase.
Crude oil demand by domestic refineries differs by region
Crude oil is not used in its raw form and must be refined into usable refined petroleum products (RPPs).Footnote 11 Through these refined products, crude oil has more than a thousand uses, such as powering cars, trucks, locomotives, power plants, factories, and ships; providing lubricants, greases, waxes, and asphalt; and serving as a source for petrochemical products like pharmaceuticals and plastics used in everyday life.
Refineries are configured differently based on the types of oil they process, which in turn determines the types of end products they produce. Each refinery operator decides where to source its crude oil feedstock based on several factors, including the grades its refinery can process most efficiently, oil prices, local supply availability, transportation costs, and other logistical considerations. For instance, Alberta and SaskatchewanFootnote 12 refinery crude oil feedstocks have higher proportions of heavier crudes compared to Ontario and Quebec refineries.Footnote 13 Refineries in British Columbia and New BrunswickFootnote 14 mostly use light to medium grades.
Figure 4 shows the types of crude oil used by refineries in various regions in Canada from 2021 to 2025. For example, it shows that Alberta primarily processes synthetic crude oil while the type of oil used in Alberta and Saskatchewan refineries remained relatively constant over the five-year period. In contrast, the types of crude oil used by Ontario and Quebec refineries evolved over the period, with the share of synthetic crude oil increasing in both regions. As a result, the share of crude bitumen and heavy crude oil declined in Ontario while the share of light and medium crudes declined in Quebec.
Western Canadian refining capacity is about 800 Mb/d. Ontario and Quebec each have about 400 Mb/d of refining capacity, and New Brunswick has 320 Mb/d. Utilization has been high since 2022,Footnote 15 after largely returning to pre-COVID-19 pandemic levels.Footnote 16 For more details on Canadian refineries and RPP transportation, see the RPP chapter of this report.
Overall, western Canadian crude oil production of 5.3 MMb/d far exceeds Canadian refinery demand.Footnote 17 After meeting all refinery needs in western Canada and most refinery needs in central Canada, a large portion of western Canadian crude oil production is exported to international markets.
Figure 4: Share of crude oil types used by refineries by regionFootnote 18
Source: Statistics Canada. Table 25-10-0063-01 Supply and disposition of crude oil and equivalent
Text Alternative: This figure shows stacked area charts from 2021 to 2025 of the types of crude oil used by refineries as a percentage of total feedstock, for each of Alberta, Ontario, Quebec, and Saskatchewan. Alberta refineries continued to use mostly synthetic crude oil (around 60%). Saskatchewan refinery demand was around 80% heavy oil. Ontario refinery demand was around 45% light oil, with an increasing share of synthetic crude oil from 29% in 2021 to 34% in 2025. Quebec refinery light oil share went from 61% to 52% and synthetic crude oil share from 30% to 38% over the five years.
The type of oil processed in refineries is self-reported according to the Statistics Canada provided types: light/medium, synthetic, heavy, or bitumen.
Canadian crude oil exports have grown
Crude oil can be transported by pipeline, rail, truck, and marine tankers. Most of the crude oil produced in western Canada is shipped from western provinces by pipeline to refineries in the U.S., or by marine vessels to the U.S. and other countries, as shown in Figure 5. Crude oil production offshore of Newfoundland and Labrador is shipped by tankers, since production is already located on tidewater.Footnote 19 In 2025, Canada exportedFootnote 20 4.3 MMb/d of crude oil, equivalent to 80% of annual Canadian crude oil production.Footnote 21
Exports have trended up since 2020, as growth in Canadian production outpaced domestic demand, leaving more crude oil available for export. This trend was supported by increased export pipeline capacity out of western Canada. The Trans Mountain Expanded System came online in May 2024, nearly tripling the capacity of the Trans Mountain System to a total of 890 Mb/d, increasing total export pipeline capacity from western Canada. Most exports continue to go to the U.S.; however, with the expanded Trans Mountain System, the share of exports going to non-U.S. destinationsFootnote 22 increased from 2% in 2021 to 10% in 2025.
The expanded Trans Mountain System also increased export capacity to tidewater in western Canada by about 700%. As a result, the percentage of Canadian exports shipped by marine went from 7% in 2021 to 13% in 2025. Over the same period, exports by rail declined while pipeline transport has increased.
Figure 5: Canadian crude oil exports by mode of transportation
Source: CER – Commodity Statistics
Text Alternative: This figure shows crude oil exports by mode of transportation from 2015 to 2025. Total exports increased from 3.8 MMb/d in 2021 to 4.3 MMb/d in 2025. In 2021, 89% of crude oil exports were transported by pipeline, 7% by marine and 4% by rail. In 2025, the first full year in which the expanded Trans Mountain System was in operation, the shares shifted to 85% of exports by pipeline, 13% by marine and 2% by rail.
Canada’s exports to the U.S. grew from 3.7 MMb/d in 2021 to 3.9 MMb/d in 2025, supported by continued demand from Midwest and Gulf Coast refineriesFootnote 23 configured to process heavy grades of crude oil.Footnote 24 In general, about half of Canadian light crude oilFootnote 25 exports go to the U.S. Midwest and a quarter go to the U.S. West Coast, while heavy crude oil exports go to the U.S. Midwest, the U.S. Gulf Coast, and non-U.S. destinations.
Figure 6: Crude oil exports from Canada, by destination
Source: CER – Commodity Tracking System
Text Alternative: This figure shows crude oil exports from Canada, by destination, between 2015 and 2025. Non-U.S. refers to exports to countries other than the U.S. Over that period, the majority of the crude oil exported from Canada was exported to PADD II (U.S. Midwest). In 2025, PADD III (U.S. Gulf Coast) exports declined and exports to non-U.S. destinations increased.
Figure 6 above shows Canadian crude oil exports by destination, with U.S. exports grouped by the U.S. Petroleum Administration for Defense Districts (PADDs).Footnote 26 In 2024 and 2025, PADD II (U.S. Midwest) received 61% of Canada’s crude oil exports. PADD III’s (U.S. Gulf Coast) share decreased to 13% in 2025, affected by the increase in exports to non-U.S.Footnote 27 and PADD V (U.S. West Coast) destinations once the expanded Trans Mountain System became operational.Footnote 28 Exports to PADD III increased for over a decade leading up to 2024, when the region received 17% of Canadian crude oil exports. Demand for Canadian heavy oil grew over this period because of increased refinery capacity for heavy crude oil and declining imports from Mexico and other heavy oil suppliers to the U.S. And, largely because of growing diluted bitumen supply, Canada continues to be the largest producer of heavy crude oil in the world. Heavy crude oil is a critical feedstock for the global refining industry, as significant amounts of refining capacity around the world are configured to process heavy oil. About 70% of U.S. refining capacity is optimized to process crude oilsFootnote 29 that are heavier than those largely produced in the U.S., which is why the U.S. imports so much heavy oil from Canada.
Figure 7: Canada’s share of U.S. crude oil imports
Source: U.S. Energy Information Administration (EIA) - U.S. Crude Oil Imports and U.S. Crude Oil Supply & Disposition
Text Alternative: This figure compares U.S. crude oil imports by country of origin against U.S. crude oil exports. It shows a growing share of imports coming from Canada, which increased from 3.2 MMb/d in 2015 to 3.8 MMb/d in 2021 to 3.9 MMb/d in 2025. From 2016 to 2020, U.S. total crude oil imports steadily declined, then increased from 1.1 MMb/d in 2021 to 1.4 MMb/d in 2024 and then down to 1.3 MMb/d in 2025. The figure also shows U.S. crude oil exports substantially increased from 0.47 MMb/d in 2015 to 3.2 MMb/d in 2020 and has been in the 3 MMb/d to 4 MMb/d range since.
With the startup of the expanded Trans Mountain System in 2024, Canada’s connection to non-U.S. crude oil markets increased substantially. Figure 8 shows that in 2025, the first full year of expanded system operations, non-U.S. exports increased to about 403 Mb/d, more than 300% higher than in 2021 at 90 Mb/d. Before the expansion, exports to other countries came from offshore Newfoundland and Labrador production, some B.C. marine exports from Trans Mountain, and some oil transported to the U.S. Gulf Coast and then exported elsewhere (re-exports).
The main export markets for Newfoundland and Labrador offshore crude oil are the U.S. and Europe.
Some crude oil exports from Canada to the U.S. are re-exported from the U.S. to other countries. In particular, some volumes exported to U.S. PADD III are re-exported off the U.S. Gulf Coast via tanker to different final destinations. The export figures and data in this section count these volumes as exports with U.S. as the final destination. An average of 140 Mb/d of Canadian crude oil exported to the U.S. was re-exported to other countries in 2025, mainly to India and Spain.Footnote 30 In 2021, that average was 65 Mb/d, mainly to China and India.
Figure 8: Annual Canadian crude oil exports by region to international destinations
Source: Canadian International Merchandise Trade database (CIMT) – HS 2709
Text Alternative: This figure shows annual crude oil exports by region and by destination from 2011 to 2025. Most crude oil supply exported out of Canada came from Alberta, and most of those exports went to the U.S., with some smaller portions going to Asian markets. This was also the case for British Columbia. Saskatchewan’s oil exports all went to the U.S. Crude oil exports from Newfoundland and Labrador had varied destinations, with oil going to the U.S., United Kingdom, and various European and Asian countries. Note that this figure uses CIMT export data, which may be slightly different than CER Commodity Tracking System data.
Imports of crude oil are essential to central and eastern Canadian refineries
While Canada produces more crude oil than Canadian refineries need, refineries in certain provinces still import crude oil. In general, provinces with refineries located farther from western Canadian production sources – namely Ontario, Quebec, and New Brunswick – consistently rely on some imported crude oil. Provinces located near domestic crude oil production, with a direct pipeline connection to it, do not import crude oil.
Imports of crude oil into Canada have remained steady at around 0.5 MMb/d since 2021, equal to about 28% of total refinery capacity of 1.9 MMb/d.Footnote 31 Imports dropped in 2021 for several reasons, including more domestic western Canadian crude oil flowing into Ontario and Quebec, while the Come by Chance Refinery in Newfoundland converted to a biofuel refinery.Footnote 32 Imports have remained at roughly 2021 levels since then. The U.S. continues to be the largest source of Canada’s imported crude oil. In 2025, 84% of Canada’s oil imports came from the U.S.,Footnote 33 compared to 66% in 2021. Most of the crude oil imported from the U.S. comes from the Gulf Coast via marine vessels, followed by the U.S. Midwest via the Enbridge Mainline.
New Brunswick imports more crude oil than any other province or territory in Canada. Canada’s largest refinery, the Irving Refinery in Saint John, is not connected to crude oil pipelines, so it relies on marine shipments for its crude oil feedstock. Quebec imports the second largest amount of crude oil in Canada, followed by Ontario. Lévis, Quebec’s Valero Refinery, the second-largest refinery in Canada, is also not directly connected to crude oil pipelines. Valero relies on marine shipments of imported foreign crude oil, as well as crude oil supplied by the Enbridge Mainline System to Sarnia and then by Enbridge Line 9 to Montreal, where oil is transferred onto marine vessels and shipped to Valero along the Saint Lawrence River.Footnote 34
Ontario's refineries are in southwestern Ontario and receive all their crude oil via the Enbridge Mainline System, which includes some imported light oil. Ontario’s crude oil imports have been sourced entirely from the U.S. since 2014.Footnote 35
Figure 9: Sources of crude oil importsFootnote 36 into Canada
Source: Canadian International Merchandise Trade database (CIMT) – HS 2709
Text Alternative: This figure displays the amount of crude oil that Canada imported from various countries from 2010 to 2025. Generally, crude oil imports declined from 2010 to 2022 and have stayed fairly level since 2021. Imports were 820 Mb/d in 2010 and reached a low of 467 Mb/d in 2022 and hovered around the 500 Mb/d range from 2023 to 2025. From 2010 to 2013, Canada imported from many countries such as Algeria, Norway, Kazakhstan, Angola, Iraq, United Kingdom, Saudi Arabia, Nigeria, and the United States (U.S.). Since 2014, Canada’s marine imports from the U.S. grew, and most crude oil imports continue to come from the U.S. In 2025, more than three-quarters of all crude oil imports into Canada were from the U.S.
Prices and differentials
Canadian crude oil primarily competes in major North American markets and is therefore priced relative to other crude oil in those markets. Since most of Canada’s crude oil is refined in the U.S. Midwest, prices are often reported relative to the most common North American crude oil benchmark, West Texas Intermediate (WTI). WTI is a light sweet crude oil priced in Cushing, Oklahoma. Western Canadian Select (WCS), which is a specific type of diluted bitumen and the most common Canadian heavy sour oil benchmark, is priced at Hardisty, Alberta. The difference between the two prices is known as the WCS-WTI differential.
Oil price differentials are largely driven by oil quality and transportation costs. Differentials between major markets can also change based on supply and demand in each of those markets, as well as availability of pipeline capacity connecting those markets. When pipeline capacity between two markets is unconstrained, price differences tend to be more stable. If pipeline capacity is constrained, differentials tend to increase (widen) until they reach a point where more expensive shipping options, such as rail, are viable and needed. When western Canadian crude oil supply is close to, or exceeds, demand from Alberta and Saskatchewan refineries and available pipeline takeaway capacity, transportation becomes constrained. In that situation, producers may need to use more expensive options, such as rail, to reach refineries in other markets. These higher transportation costs widen the price differential and lower the price received for western Canadian crude oil, regardless of how the oil is shipped.
As shown in Figure 10, WCS sells at a discount to WTI, reflecting the cost of transporting crude oil more than 2,000 kilometres to the U.S. Midwest market, where WTI is priced, as well as the lower quality of WCS relative to WTI. The U.S. Midwest and U.S. Gulf Coast are the largest markets for Canadian crude oil and, therefore, have influenced the prices Canadian producers receive for their product. Historically, the differential has largely been US$10 to US$15 per barrel, when western Canadian markets were not constrained by pipeline capacity, and widened by more than US$18 per barrel when those markets were constrained.
Two Major Components Contribute to Oil Price Differentials:
Constrained pipeline capacity typically has significant economic costs because lower oil prices reduce revenues for producers and governments. Some spare pipeline capacity is generally required for western Canadian prices to consistently track prices in international markets. Spare capacity provides oil producers and others in the marketplace flexibility to access higher-value markets and avoid the impacts of maintenance, unforeseen outages, and higher-cost rail. This flexibility would remain even with excessive spare capacity and long-term pipeline underutilization, although this could result in higher pipeline tolls and some ongoing additional discounting of western Canadian crude prices.
While a wider differential also means Canadian refineries in that market or connected to that market by pipeline can acquire lower cost crude oil, this does not necessarily mean consumers pay lower prices for RPPs like gasoline and diesel, as these prices are linked to RPP prices in more regional markets.
Figure 10: Key crude oil prices and their differential
Source: One Exchange Corp
Text Alternative: This figure shows the average monthly index prices for WCS and WTI, and the WCS-WTI differential from 2020 to mid-2026. During that time period, prices were the highest in June 2022 at US$113.72 and the differential was the widest in late 2022 into early 2023, with the largest differential in December 2022 at US$29.62.
The WCS-WTI differential widened in late 2022 to almost US$30 per barrel after Russia invaded Ukraine.Footnote 37 It widened again in late 2023 to around the mid-US$20 per barrel level, as Canadian oil production continued to grow ahead of the Trans Mountain Expansion Project (TMEP) coming online. This contributed to growing storage volumes in western Canada and export pipelines being filled to near capacity. Differentials narrowed by mid-2024 and have remained relatively steady since TMEP came online and added significant new pipeline capacity out of western Canada.
Significant turnaround maintenance at major upstream oil sands facilities can also impact the differential by limiting the amount of supply, which can narrow the differential. Similarly, maintenance at major downstream refineries can limit the amount of demand, which can widen the differential. Global trends and events can also affect prices and differentials, including oil production growth or declines in other countries, export constraints at key points, or major changes to demand because of pandemics, wars, refinery outages, and other factors.
Western Canada’s four major crude oil pipelines are the Enbridge Canadian Mainline, the Keystone Pipeline, the Trans Mountain System, and the Express Pipeline. The combined capacity of these four pipelines account for 96% of all crude oil takeaway capacity from the WCSB. Over the past ten years, capacity has closely tracked production growth, and there have been no periods of significant spare capacity. Overall, the major crude oil pipelines have been highly utilized.
In some years, such as 2021 and 2023, the estimated amount of supply available to be exported from the WCSB exceeded the available pipeline takeaway capacity, mostly a result of strong production growth. After additional pipeline capacity came online in 2024 and 2025 with the expanded Trans Mountain System ramping up, utilization of takeaway capacity was still close to 100% in 2025, indicating takeaway capacity out of the WCSB remains extremely tight (see the Oil export capacity out of western Canada remains highly utilized even with new capacity section for more information). Total takeaway capacity grew 1.4 MMb/d in the last decade, from 3.7 MMb/d in 2015 to 5.1 MMb/d in 2025.
Between January 2021 and December 2025, existing pipeline systems added around 0.9 MMb/d of pipeline takeaway capacity out of western Canada, an increase of 20%.Footnote 38 Western Canadian oil production similarly increased by around 0.8 MMb/d, or 17%, from January 2021 to December 2025.Footnote 39 The pipeline capacity additions were driven by expansions on the Trans Mountain System and the Enbridge Canadian Mainline.
Figure 11: Takeaway pipeline capacityFootnote 40 and rail utilization, compared to total estimated crude oil supply available for export from western CanadaFootnote 41
Source: CER, Canada's Energy Future 2026: Analysis: Canada’s Energy Security, Self Sufficiency and Trade Diversification, and pipeline company websites
Text Alternative: This figure shows takeaway capacity from pipelines and rail exports compared with total crude oil supply available for export from western Canada’s producing region from 2015 to 2025. The Enbridge Canadian Mainline makes up most of the export capacity at 3.1 MMb/d in 2025. In 2025, average total supply of oil available for export from western Canada was 5.09 MMb/d and total export capacity was 5.1 MMb/d.
Pipeline Capacity
The capacity of a liquids pipeline is based on many factors, such as the type of crude oil being transported, unplanned outages, maintenance work, downstream constraints, or pressure restrictions.
Capacity data presented in this section may refer to either nameplate capacity or expected available capacity. Nameplate capacity represents the theoretical design capacity of a pipeline under assumed conditions. In contrast, expected available capacity reflects estimated operating conditions at a specific point in time, often shortly before the period in question. The available capacity of a pipeline usually differs from its nameplate capacity and may vary on a monthly basis. This difference may be due to the direction of flow, outside temperature, product temperature, available pumping capacity, duration of flow, season, the types of products being transported, unplanned outages, downstream constraints, and maintenance work or other pressure restrictions, among other factors.
Users should interpret capacity and utilization metrics with caution. Expected available capacity figures are provided at certain key points on the system and are often calculated in advance, either before or after a pipeline has scheduled its throughputs. Therefore, expected available capacity figures may not, for example, reflect capacity constraints at other key points on the system or the actual operating conditions that existed in any given month.
Pipeline operators have options to increase the volume of liquids that can flow through the pipe, including adding pipeline loops (connecting an additional pipeline that runs parallel to an existing pipeline) and adding pumping stations (increasing pressure so more liquid can flow through the same amount of space). Conversely, capacity can be decreased through pressure reductions at points where a pipeline has integrity issues.
Pipeline design and operating pressure are subject to CER regulatory oversight under the Canadian Energy Regulator Onshore Pipeline Regulations (OPR). Companies are responsible for meeting OPR requirements to manage safety, security, and environmental protection through the entire lifecycle of their facilities. This lifecycle spans from the design to construction, operation, abandonment, and reclamation.
About three-quarters of the current takeaway capacity out of the WCSB is uncontracted/uncommitted, primarily because the Enbridge Canadian Mainline, Canada’s largest pipeline system, has no contracts for capacity and remains entirely uncommitted.Footnote 42 Generally, for uncommitted capacity, shippers request service each month by nominating volumes for delivery into the pipeline. Other pipelines have contracts for capacity, though they are still required to have some uncommitted capacity available to shippers to meet their common carrier obligations.
The Trans Mountain System and the Keystone Pipeline primarily provide committed service. Trans Mountain moved to mainly committed service to support its expansion project that came into service in May 2024. Keystone has mainly operated under long-term, fixed-capacity contracts (up to 94% of capacityFootnote 43) since operations began in 2010.
Table 1. Major Canadian oil pipelinesFootnote 44 – capacities and contracted capacity
| Pipelines | Nameplate Capacity | Contracted Capacity (%)Footnote 45 |
|---|---|---|
| Enbridge Canadian Mainline | 3,220 Mb/d (3.2 MMb/d) |
0 |
| Express Pipeline | 310 Mb/d |
Not public |
| Milk River Pipeline | 98 Mb/d |
Not public |
| Aurora Pipeline | 45 Mb/d |
Not public |
| Wascana Pipeline | 40 Mb/d |
Not public |
| Keystone Pipeline | 622 Mb/d |
94 |
| Trans Mountain System | 890 Mb/d |
80Footnote 46 |
| Total | 5,225 Mb/d 830 10³m³/d |
Major oil export pipelines from western Canada were running at or near full utilizationFootnote 47 going into 2026. High utilizationFootnote 48 indicates strong demand for these pipelines, and limited spare capacity to export additional crude oil. When pipelines are effectively full, or almost full, more volumes tend to move by rail than during periods of surplus pipeline capacity.
Figure 12: ThroughputFootnote 49 and capacity on major crude oil pipelines
Source: CER, data available on Open Government; Geomatics Data Management Inc. (GDM), Esri, TomTom, Garmin, FAO, NOAA, USGS, ©OpenStreetMap contributors, and the GIS User Community
Text Alternative: The left section of this figure shows a map highlighting key delivery and export points for the selected pipeline: the Enbridge Canadian Mainline at ex-Gretna, Keystone Pipeline, Trans Mountain System, or Line 9.
The right section of this figure is a line chart of throughput and capacity of the system selected – either the Enbridge Canadian Mainline at ex-Gretna, Keystone Pipeline, the Trans Mountain System, or Line 9. See CER – Crude oil and liquids – pipeline flow and capacity for more information.
Major crude oil pipeline systems regulated by the CER
The Enbridge Canadian MainlineFootnote 50 accounts for about 62% of crude oil export capacity out of the WCSB. The Canadian Mainline originates in Edmonton, Alberta, and extends east across the Prairies. The pipeline system crosses the Canada-U.S. border near Gretna, Manitoba, where it joins the Enbridge Lakehead System, the U.S. portion of the Enbridge Mainline. The Lakehead System carries crude oil to refineries in the U.S. Midwest, connecting pipelines serving the U.S. Gulf Coast, and back into Canada near Sarnia, Ontario. The Canadian Mainline, including Line 9, transports both domestic and U.S. crude oil, RPPs, and NGLs.
Since 2020, the Enbridge Canadian Mainline’s utilization has generally been in the mid-90% range, even with the capacity increase in late 2021. This illustrates the continuous tight takeaway capacity out of western Canada, supported by the robust demand for Canadian crude oil and growing crude oil production in western Canada.
Available capacityFootnote 51 on the Enbridge Canadian Mainline at Gretna increased from an annual average of 2.9 MMb/d in 2021 to 3.2 MMb/d in 2025. Capacity increased after the Line 3 Replacement Program fully entered service in CanadaFootnote 52 and the U.S.Footnote 53 in late 2021, along with other pipeline optimizations. Coinciding with the Enbridge Mainline’s Line 3 Replacement Program, Enbridge also expanded its U.S. Southern Access Pipeline (Line 61) in 2020,Footnote 54 adding more than 200 Mb/d of extra capacity from Superior, Wisconsin, to a key oil hub at Flanagan, Illinois.
Since fall 2021, Canadian Mainline throughputs have generally been around 3.0 to 3.2 MMb/d, supported by robust crude oil production and stronger U.S. demand.Footnote 55
The Keystone PipelineFootnote 56 ships oil from western Canada to major hubs in the U.S. Midwest, as well as farther south to the U.S. Gulf Coast. Keystone ships almost entirely heavy crude oil. In 2025, Keystone transported 12% of western Canadian crude oil exports, and its average available capacity was 607 Mb/d. Keystone’s capacity is mostly contracted. In 2023, Keystone began filing throughput data broken down by committed and uncommitted volumes, as directed by the Commission of the CER.Footnote 57
Keystone’s capacity has remained relatively steady over the last decade, at around 600 Mb/d, with slight changes during pressure restrictions imposed in the U.S. Utilization has also been consistent at mid-90% to 100% for more than a decade. Brief dips in utilization have occurred during downstream constraints, such as pipeline spills on the system or refinery outages, and during upstream production disruptions, such as forest fires or unplanned maintenance shutdowns.
In December 2022, an oil spill occurred on Keystone in Washington County, Kansas, causing monthly throughput to drop to 338 Mb/d, a 44% decrease from the previous month.Footnote 58 In March 2023, the U.S. Pipeline and Hazardous Materials Safety Administration (PHMSA) ordered the U.S. portion of the pipeline to operate at a lower pressure following this incident. In April 2025, another oil spill occurred on Keystone in North Dakota, and the pipeline was approved to restart within a week of the incident at a PHMSA-approved operating pressure.Footnote 59 Pressure restrictions remained in place as of September 2026.
The Trans Mountain SystemFootnote 60 transports light and heavy crude oil and refined petroleum products (RPPs) by pipeline to destinations in B.C. and Washington State. Its Westridge Marine Terminal in Burnaby, B.C., also enables crude oil to be transported by marine vessel to Washington State, California, and other international destinations including Asia.
Before the Trans Mountain Expansion Project came online, Trans Mountain was consistently utilized at or very close to 100%, with a brief exception during late 2021 flooding in British Columbia’s Lower Mainland.Footnote 61 After the May 2024 expansion of 590 Mb/d, utilization was around 80-90% through to the end of 2025, demonstrating the tight takeaway capacity out of western Canada and production growth that has been available to use the additional capacity, even while other major export pipelines have remained highly utilized. Average available capacity in 2025 was 892 Mb/d.
The expanded Trans Mountain System increased total western Canadian crude oil export pipeline capacity and export capacity to tidewater in western Canada.Footnote 62 Before the expansion, Trans Mountain set aside 79 Mb/d of capacity for service to its Westridge Marine Terminal: 54 Mb/d for committed and 25 Mb/d for uncommitted service.Footnote 63 After the expansion, Trans Mountain has the potential to serve the Westridge Marine Terminal with up to 630 Mb/d of western Canadian crude oil, equal to the terminal’s export capacity.Footnote 64
When the expansion entered service, about 80% of Trans Mountain System’s capacity, or 708 Mb/d, was reserved for committed shippers, with long term take-or-pay contracts. The remaining capacity, about 180 Mb/d, was made available on a monthly basis for uncommitted (also known as spot) shippers. Effective 1 January 2027, up to 90% of the Trans Mountain System’s capacity will be available for committed service.Footnote 65
Volumes of heavy oil have exceeded light oil volumes on a monthly basis since the expansion came online. The expansion enables more heavy crude oil exports from the Westridge Marine Terminal to markets in Asia and the U.S. West Coast. Meanwhile, light crude oil and RPPs continue to be delivered to the Burnaby delivery point to serve the Burnaby Refinery,Footnote 66 Suncor’s Burrard Products Terminal, and the surrounding areas.Footnote 67
The Express Pipeline, also known as Line 40,Footnote 68 has a nameplate capacity of 310 Mb/d and delivers light, medium, and heavy crude oil from Canada to Casper, Wyoming. From there, crude oil is delivered into Ohio and Illinois via an interconnection with the Platte Pipeline.Footnote 69 The Canadian portion of the Express Pipeline extends from Hardisty, Alberta, to the Canada-U.S. border near Wild Horse, Alberta. While the CER does not collect pipeline throughput data for Express the same way it does for pipelines like Trans Mountain System, the Enbridge Canadian Mainline, and Keystone, Express appears to be well utilized, based on high levels of contracting, its planned expansion,Footnote 70 and data reported to the CER by exporters.
The Milk River Pipeline has a nameplate capacity of 98 Mb/d and carries a variety of crude oil from Alberta to refineries in Montana, U.S., as well as to the Rocky Mountain Pipeline and the Front Range Pipeline. Its main receipt point is where it connects with the Bow River Pipeline near Milk River, Alberta. The CER does not collect pipeline throughput data for Milk River.
The Aurora Pipeline has a nameplate capacity of 45 Mb/d and transports NGLs, condensate, light sweet crude, and light sour crude from Alberta to the U.S. border. It starts in Carway, Alberta, and connects at the border to the Front Range Pipeline System, as well as the Glacier Pipeline, a segment of the Rocky Mountain Pipeline System. These systems transport products to refineries in Montana and Wyoming and to other pipelines serving other regions. The CER does not collect pipeline throughput data for Aurora Pipeline.
If more volume is nominated than the pipeline can transport, some or all shippers’ nominated volumes are apportioned. Apportionment can be driven by various factors, including growing oil supply, oil demand growth or spikes, reduced pipeline capacity, and downstream constraints such as refinery maintenance or unplanned outages. The way apportionment is applied depends on whether a pipeline has contracted capacity. When nominations are apportioned on pipelines with contracted capacity, typically only the non-contracted volumes are apportioned. Contracted volumes are unapportioned, unless pipeline capacity falls to a level where it cannot transport all nominated contracted volumes.
In the months leading up to the completion of the expanded Trans Mountain System, all major oil pipelines out of western Canada were running at or near capacity as Canadian oil production increased to record levels.Footnote 71 Shipper requests, or nominations, to use these pipelines significantly exceeded capacity, resulting in a large increase in apportionment on the largest western Canadian oil pipelines (Trans Mountain Pipeline, Enbridge Canadian Mainline, and Keystone) in late 2023 and early 2024.Footnote 72 In Figure 13, apportionment occurs when nominations exceed the available capacity, which has happened frequently for the three major oil pipelines at different points in time.
Since startup of the Trans Mountain expansion, and with Canadian oil production at new highs, the Trans Mountain System has not had to apportion nominations to the same degree as before. On the Enbridge Mainline and Keystone Pipeline, apportionment has fallen significantly while total utilization remained at or near capacity. Since Trans Mountain expanded, a small amount of spare capacity has been available in western Canada, which generally reduced apportionment, although apportionment remains on some pipelines at various points in time.
Figure 13: Nominations and apportionment on the major crude oil pipelines leaving western Canada
Source: CER, Open Government
Text Alternative: This figure shows pipeline nomination data for the Enbridge Canadian Mainline, the Keystone Pipeline and the Trans Mountain System. Original nominations are shown as a blue area in the chart, the green line shows the apportionment percentage, and the yellow line shows available capacity for Trans Mountain and Keystone and accepted nominations for the Enbridge Canadian Mainline System.
Apportionment on the main western Canadian takeaway pipelines occurred from mid-2020 through 2021, before Enbridge Line 3 operational capacity was expanded, illustrating spare capacity was tight at that time. Ahead of the Trans Mountain Expansion Project coming online in May 2024, the Enbridge Mainline operated at near-full capacity, with nominations exceeding capacity and resulting in high apportionment.Footnote 73 As the expanded Trans Mountain System ramped up, constraints eased and apportionment fell.
Keystone utilization has remained high, and often reached 100%, over most of the last five years. In late 2023 and early 2024, when western Canadian takeaway capacity was very tight and production continued to rise, nominations rose as high as 64.0 MMb/d – more than 10 times western Canadian production – before falling sharply once the expanded Trans Mountain System began operations. This highlights how changes on one pipeline can affect other pipelines.
With the expansion in service, nameplate capacity for the Trans Mountain System increased to 890 Mb/d. Apportionment pressures on the Trans Mountain System eased as the expanded capacity ramped up, dropping from 18% to 27% between September 2023 and April 2024 to zero from May 2024 onward. Since June 2024, Trans Mountain’s committed capacity has been effectively fully or almost fully utilized each month.
Data is not currently available for the Express Pipeline because it is exempt from CER reporting requirements.Footnote 74
Production has continued to grow in the WCSB, while crude oil consumption by refineries within the WCSB area has remained relatively steady. As a result, pipeline capacity has been added to export more surplus supply. Because production is expected to continue increasing, there are various projects to increase pipeline capacity being contemplated, proposed, or under construction by industry, as outlined in Table 2.Footnote 75
Table 2. Proposed and in-construction pipeline projects
| Proposed Project | Capacity Increase | Proposed In-service date | Status (as of September 2026) |
|---|---|---|---|
| Express-Platte Expansion | 30 Mb/d | Mid-2026 | Under construction |
| Enbridge Mainline: | |||
| Mainline Optimization Phase 1 (MLO1) | 150 Mb/d | 2027 | CER approvedFootnote 77; FID Nov. 2025; under construction |
| Mainline Optimization Phase 2 (MLO2)Footnote 76 | 250 Mb/d | TBD | PostponedFootnote 78 |
| Trans Mountain System Optimizations: | |||
| Drag Reducing Agent Project | Up to 90 Mb/d | Late 2026 | Under ConstructionFootnote 79 |
| Mainline Optimization Project | 210 Mb/d | 2028 or later | Application filed with the CER on 27 August 2026Footnote 80 |
| Prairie Connector (using Canadian Keystone XL permits and assets) | TBD | Late 2028 | Successful open season with 20-year commitments; FID expected mid-2027Footnote 81 |
| Pacific Link | Up to 1 MMb/d | 2032 | Designated as a project of national interest by the Major Projects OfficeFootnote 82 |
| Northern Shield Energy Corridor | 500 Mb/d, expandable up to 800 Mb/d | TBD | Feasibility study underway and planned for completion by the end of 2026Footnote 83 |
Enbridge Mainline, Enbridge Bakken, and Express
Enbridge has publicly stated that it is considering Mainline capital investment of up to $2.0 billion from 2025 to 2028 to support operational efficiencies and system reliability. These capital investments would increase capacity of the Mainline system in several phases. Mainline Optimization Phase 1 (MLO1) would add 150 Mb/d to the current 3.3 MMb/d system capacity, with an in-service date of 2027. MLO1 reached a positive Final Investment Decision (FID) on 14 November 2025.Footnote 84 It involves facilities and operations on both the Canadian and U.S. portions of the Mainline system, including the use of drag-reducing agents (DRAs), new piping configurations and crossovers, storage capacity, and terminal enhancements. It also includes a 100 Mb/d capacity increase on the downstream Flanagan South Pipeline in the U.S. to support the increased capacity on the Mainline. Phase 2 (MLO2), currently postponed, could provide an additional 250 Mb/d of capacityFootnote 85 on the Mainline, including by reversing Line 26 (also known as the Enbridge Bakken Pipeline) and using capacity on the Dakota Access Pipeline to provide additional takeaway for western Canadian light crude oil.Footnote 86
The Express-Platte expansion is planned to add 30 Mb/d of capacityFootnote 87 and be operational by mid-2026. Alongside the Southern Illinois Connector projectFootnote 88 and existing capacity on the Spearhead Pipeline,Footnote 89 it would boost overall capacity to the U.S. Gulf Coast.
Trans Mountain System optimization projects
Trans Mountain has identified optimization opportunitiesFootnote 90 to add up to 300 Mb/d of capacity over the next five years, on top of its current 890 Mb/d capacity.Footnote 91 Trans Mountain’s Drag Reducing Agent Project, which was approved by the Commission of the CER in June 2026 and is currently in construction, will improve pipeline flow efficiency and increase capacity by up to 10%, or about 90 Mb/d, starting in late 2026. The Trans Mountain System Mainline Optimization Project includes adding pumping stations and modifications, as well as about 30 km of new pipe. The earliest construction start would be mid-2027.
Prairie Connector and the Bridger Pipeline projects
In March 2026, South Bow began gauging customer interest in its Prairie Connector Project, which would carry crude oil from Hardisty, Alberta, to various U.S. destinations, including the storage hub at Cushing, Oklahoma, and the U.S. Gulf Coast market. On June 3, 2026, South Bow notified the CERFootnote 92 that it is advancing the Prairie Connector Project using existing Keystone XL infrastructure. The Canadian side of the canceled Keystone XL project, which includes some built but unused pipeline, is still fully permitted in Canada; however, South Bow will need to seek necessary regulatory approvals from the CER.Footnote 93 While the project is being advanced under a new name, South Bow is not proposing any changes to the approved project route or footprint in Canada. South Bow held a successful open season in the first quarter of 2026, resulting in 20-year commitments for service from Hardisty, Alberta, to U.S. Gulf Coast destinations by way of executed Transportation Service Agreements (TSAs). An FID is targeted for mid-2027, followed by construction and an anticipated in-service date in late 2028.
The Prairie Connector Project is proposed to connect to an expanded Bridger Pipeline at the Montana border, where crude oil would then be transported to Guernsey, Wyoming.Footnote 94 From Guernsey, the Bridger Pipeline is proposed to connect to the Liberty Bridge Pipeline Project, a joint development between South Bow and Bridger, which would deliver oil into Cushing, Oklahoma, where oil could reach the U.S. Gulf Coast segment of the Keystone Pipeline System and other downstream facilities.Footnote 95 These projects would provide additional export capacity for western Canadian crude oil.
Pacific Link (formerly known as the West Coast Oil Pipeline)
On 2 July 2026, the Government of Alberta published a project proposal for the West Coast Oil Pipeline Project, a crude oil pipeline from Bruderheim, Alberta, to the B.C. coast, with a capacity of 1 MMb/d.Footnote 96 The pipeline would carry crude oil to a proposed marine terminal near Roberts Bank, B.C., increasing access to Asian markets for western Canadian crude oil.Footnote 97 The routes being considered for the project follow the existing Trans Mountain System for much of their length, particularly between Wabamun, Alberta, and Hope, B.C. The Government of Alberta has entered into a non-binding agreement to further develop the project with Trans Mountain Corporation, Pembina Pipeline Corporation, and the Alberta Petroleum Marketing Commission. The Government of Alberta’s proposal for the project followed an MOU between the governments of Canada and Alberta.Footnote 98 On October 1, 2026, the Government of Canada announced the West Coast Oil Pipeline, now known as Pacific Link, as a project of national interest under the Building Canada Act. The announcement indicated that the MPO, supported by the CER, will lead the federal review process on the conditions for the project and will work to finalize those conditions by 1 September 2027, with construction to follow.Footnote 99
Northern Shield Energy Corridor
In July 2026, the governments of Ontario and Alberta announced the proposed Northern Shield Energy Corridor, a 3,300 km pipeline that would transport oil from Hardisty, Alberta, to refining facilities near Sarnia, Ontario, using a route entirely within Canadian borders. The project could also include a potential extension to the Port of Churchill in Manitoba. The proposed pipeline could transport 500 Mb/d of oil, with potential to expand to 800 Mb/d. As of July 2026, no additional details were available on project specifics, developers, or timelines.
Optimizing a pipeline generally means increasing its capacity without significantly changing existing infrastructure or building new infrastructure. These optimizations are generally done in a few ways.
One way is to streamline how a pipeline operates so it becomes more efficient at shipping oil. For example, the Enbridge Canadian Mainline ships dozens of commodities, including some RPPs and NGLs. These products are “batched”, which means different commodities are kept separate from one another because end users do not want the products to be contaminated by other products moving on the same line. Shipping batches of different commodities can make scheduling receipts and deliveries more complex compared to moving a single commodity. By optimizing rules about batching by crude quality, Enbridge Mainline has made shipping more efficient and increased total flows on the system. For pipeline systems with two or more pipelines running parallel to each other, like Enbridge Mainline and Trans Mountain, companies can also increase efficiency by dedicating specific lines to ship batches of certain product types. For example, lighter crudes can move on one line and heavier crudes on another, simplifying operations.
Another way to optimize a pipeline system is to add drag-reducing agents, or DRAs, to the oil so it can move through a pipeline at the same pressure. DRAs work by reducing the friction between the oil and the internal wall of the pipeline. The Enbridge Mainline and Keystone systems, for example, have been using DRAs for 10 years or more. Among planned expansions, Enbridge Mainline’s MLO1 and Trans Mountain’s Drag Reducing Agent Project would both add capacity by using DRAs.
Pipeline systems can also be optimized by making relatively small physical changes to debottleneck sections where capacity is constrained, allowing more oil to move through them. For example, Trans Mountain’s Optimization Project would add 30 km of new pipeline to address a bottlenecked section and add new pumping stations to increase capacity by over 200 Mb/d. The Enbridge Mainline’s MLO2 expansion would reverse Line 26 so it would move oil out of western Canada instead of into western Canada. Along with other MLO2 changes, this would add another outlet and increase export capacity.
By late 2015, Enbridge’s Line 9 was fully reversed.Footnote 100 This allowed crude oil to flow from western Canada on Enbridge’s Canadian Mainline, through Enbridge’s Lakehead System in the U.S., and into southern Ontario at Sarnia, where it could enter Line 9 and supply refineries in Ontario and Quebec. At the time, flows into Sarnia significantly increased because of this new demand from existing Canadian refineries. Since then, however, flows into southern Ontario on Enbridge Mainline have increased only slightly, and flows on Line 9 have remained flat. This is largely because refineries in both Ontario and Quebec have neither increased their capacity nor requested significantly more crude oil from western Canada. As a result, and in contrast to many proposed expansions and new pipelines in western Canada, the CER has not recently received any applications for significant modifications to the Enbridge Mainline or Line 9 systems that supply Ontario and Quebec.
Figure 14: Throughput and capacity on crude oil pipelines supplying Ontario and Quebec
Source: CER, data available on Open Government
Text Alternative: This figure is a line chart of throughput and capacity of the Enbridge Canadian Mainline at the Into-Sarnia key point, and Line 9. See CER – Crude oil and liquids – pipeline flow and capacity for more information.
Notably, oil flows into Sarnia, Ontario, from two pipelines in the U.S.: Line 5 and Line 78 of Enbridge’s Lakehead System. Line 5 transports up to 540 Mb/dFootnote 101 of light crude oil and NGLs from Superior, Wisconsin, to near Marysville, Michigan. Some oil is delivered to other pipelines connected to refineries in Michigan and Ohio, and the remaining oil and NGLs continue on Line 5 to Sarnia. Line 78 transports about 450 Mb/d of oil from near Chicago, Illinois, to Stockbridge, Michigan. From there, some oil is delivered to other pipelines supplying refineries in Michigan and Ohio, and the remaining oil continues on Line 78 to Sarnia. Altogether, oil and NGL flow on Line 5 and Line 78 into Sarnia total about 750 Mb/d.
In Wisconsin, the Bad River Band of the Lake Superior Tribe of Chippewa sued Enbridge in 2019 after easements allowing for Line 5 to cross the Band’s reservation expired in 2013. The Band requested that the court shut down Line 5 on its land, which would effectively shut down the pipeline. While the court agreed and imposed an order in June 2023 for Enbridge to cease Line 5 operations on reservation land by June 2026, that decision was stayed until an appeals court in July 2026 issued a decision that continues to suspend the shut down injunction and allows Enbridge to continue to operate Line 5, while returning the case to a lower court. Enbridge has permits to reroute the pipeline around reservation land, and construction has begun, though the approval from U.S. Army Corps of Engineers (USACE) is currently being challenged in court by the Bad River Band. Construction is scheduled to finish in early 2027, pending the outcome of the Band’s permit challenge.
In Michigan, Line 5 crosses under the Straits of Mackinac via two 20-inch lines. Enbridge plans to build an underground tunnel to house Line 5 in this area to mitigate the risk of ship anchor strikes to the pipeline. On 13 November 2020, the State of Michigan notified Enbridge Inc. that it was revoking the 1953 easement permitting Enbridge to operate Line 5 on the lakebedFootnote 102 and launched legal action. On 12 August 2026, USACE granted final permits for the Line 5 Great Lakes Tunnel project. The Michigan Supreme Court sent a permit for the Line 5 tunnel back to the Michigan Public Service Commission for a broader environmental review on 31 July 2026.Footnote 103 The new process is expected to have a hearing in 2027, and these permits would be needed before it can construct the tunnel. In response to the court ruling, Michigan’s Governor also directed the Department of Environment, Great Lakes, and Energy to review the permit granted to Enbridge for the Line 5 Tunnel Project.Footnote 104 In the meantime, the State of Michigan’s litigation against Line 5 continues in state court, while a counter lawsuit by Enbridge against Michigan is ongoing in federal court.
While Line 5 continues to operate, on 25 August 2026 the pipeline spilled over 30,000 barrels of natural gas liquids when a subcontractor’s semi-truck rolled into an open excavation site on Line 5 in Wisconsin, striking the pipeline. The pipeline was shut down for repairs and then returned to service on the weekend of 12 September 2026.
Enbridge estimates that if Line 5 were permanently shut down, oil supply to refineries that rely entirely on Enbridge’s Lakehead System, including southern Ontario refineries, would be reduced by 45%.Footnote 105 Quebec refineries, which receive about 130 Mb/d of crude oil by marine vessel out of their total consumption of about 350 Mb/d, would be less exposed to a Line 5 shutdown, though impacts would still be significant.
In 2021, 7% of Canada’s crude oil exports were by marine vessel, or tankers. That increased to 13% in 2025 following the expansion of the Trans Mountain System, which increased capacity and flows to the Westridge Marine Terminal. The volume exported via tanker went from 270 Mb/d in 2021 to 550 Mb/d in 2025, a 104% increase. Oil tankers come in various sizes, with larger vessels benefiting from greater economies of scale. Because of draft restrictions in the Port of Vancouver, the largest vessels currently allowed at Westridge Dock are Aframax-sized, and they can only load about 550,000 barrels out of their typical 800,000 barrel capacity. Once loaded, these vessels sail directly to refining markets or they sail to the Pacific Lightering Area offshore of California, where their cargo is transferred onto Very Large Crude Carriers, which typically have capacities of about 2 million barrels, for delivery to Asia. Once dredging in Burrard Inlet is completed,Footnote 106 which is scheduled for February 2028, Aframax vessels will be able to load to full capacity at Westridge Dock.
In Atlantic Canada, tankers are used to deliver Newfoundland and Labrador offshore production to U.S. PADDs I and III and other international markets.Footnote 107
Figure 15: Crude oil exports by tanker
Source: CER – Commodity Statistics
Text Alternative: The figure shows the volume of crude oil export by marine tanker, as well as the share of all crude oil exports that were by marine from 2021 to 2025. In 2021, the volume of crude oil exported by marine vessel averaged 270 Mb/d. It increased to 550 Mb/d in 2025, and marine’s share of all crude oil exported increased from 7% in 2021 to 13% in 2025, an increase made possible by the expanded Trans Mountain System.
Transporting crude oil by rail is generally more expensive than transporting it by pipeline. Rail is typically used when pipeline infrastructure is not available or when price differentials are wide enough to make rail economic. In other words, rail becomes economic when the price in the destination market is high enough to cover the increased cost of rail compared with selling into the WCSB market. This is why, as shown in Figure 16, crude-by-rail exports sometimes show a correlation with price differentials between western Canadian heavy oil (Western Canada Select or WCS) and U.S. light oil (West Texas Intermediate or WTI).
The differential required to justify shipping crude by rail varies by shipper. Importantly, western Canadian oil producers are price takers and must offer their oil at prices that are competitive in destination markets, such as Cushing, Oklahoma, and the U.S. Gulf Coast. This requires exporters from Canada to cover the cost of transportation to those markets or accept a price discount when buyers arrange transportation. Crude-by-rail exports and price differentials will not be perfectly correlated because many factors affect rail shipments. These include the time needed to source railcars, the longer-term contracts often required for rail shipments, pipeline capacity constraints, and market expectations about future capacity and the broader supply and demand dynamics.
Rail is more expensive than pipeline transportation, but it remains an integral part of the oil transportation system partly because rail can serve regions without pipelines and can be relied upon when pipelines are running full. Exporters are also now using crude-by-rail for specific operational reasons, including when pipelines cannot be used for certain exports, such as raw bitumen rather than diluted bitumen.
Figure 16: Crude-by-rail exports and WCS-WTI differential
Source: CER – Crude-by-rail exports, and One Exchange
Text Alternative: This figure shows the volumes of crude oil exported by rail and the WCS-WTI differential. Crude by rail exports have generally been declining since early 2022, coinciding with additional pipeline takeaway capacity out of western Canada.
Crude-by-rail exports experienced both record highs and historic lows in 2020, due to pipeline capacity constraints and the COVID-19 pandemic. In 2021, crude-by-rail volumes increased from the lows of 2020 but did not return to the same levels seen through most of 2019 and early 2020. This is largely because additional pipeline capacity came online in the fall of 2021, allowing more crude oil to move from western Canada to the U.S Gulf Coast – one of the main destinations for Canada’s oil exports by rail.Footnote 108 Oil price differentials remained narrow through much of 2021. In late 2023 into early 2024, differentials widened, and crude-by-rail exports also increased. However, broader decline in crude-by-rail exports that began in 2022 has continued. Export volumes remain relatively low compared with the past decade and have been fairly steadyFootnote 109 as crude oil has increasingly been exported by pipelineFootnote 110 instead of rail following the addition of pipeline capacity. From mid-2024 through 2025, oil price differentials and crude-by-rail exports have remained fairly steady and comparatively low, coinciding with the expanded Trans Mountain System.
Since 2020 an average of 74% of Canadian crude-by-rail export volumes have gone to the U.S. Gulf Coast (PADD III). Rail exports to PADD III declined from an average of 90 Mb/d in 2021 to an average of 70 Mb/d in 2025.Footnote 111 The remaining rail exports to the U.S. went to PADD I and PADD V.