Your feedback will help us improve and better meet your needs (opens in new tab)
Refined petroleum products (RPPs) play an important role in Canada’s energy system, providing fuels for transportation, heating, industrial and agricultural operations, products for construction and infrastructure, as well as feedstocks for manufacturing and petrochemical industries. RPPs are created from crude oil through processing at refineries. Oil refineries produce a range of products, including motor gasoline and blending components, diesel fuel oil, aviation fuel, heating oil, residual fuel oil, asphalt, petroleum coke, natural gas liquids (NGLs) like naphtha, petrochemical feedstocks, unfinished oils, lubricants, waxes, and other specialty petroleum products.Footnote 1
Refineries separate crude oil into RPPs through distillation and additional processing. Refineries are configured to process different types of crude oil. Only those facilities that have invested in additional processing units, such as cokers, can process heavy oil, including non-upgraded oil sands production.Footnote 2
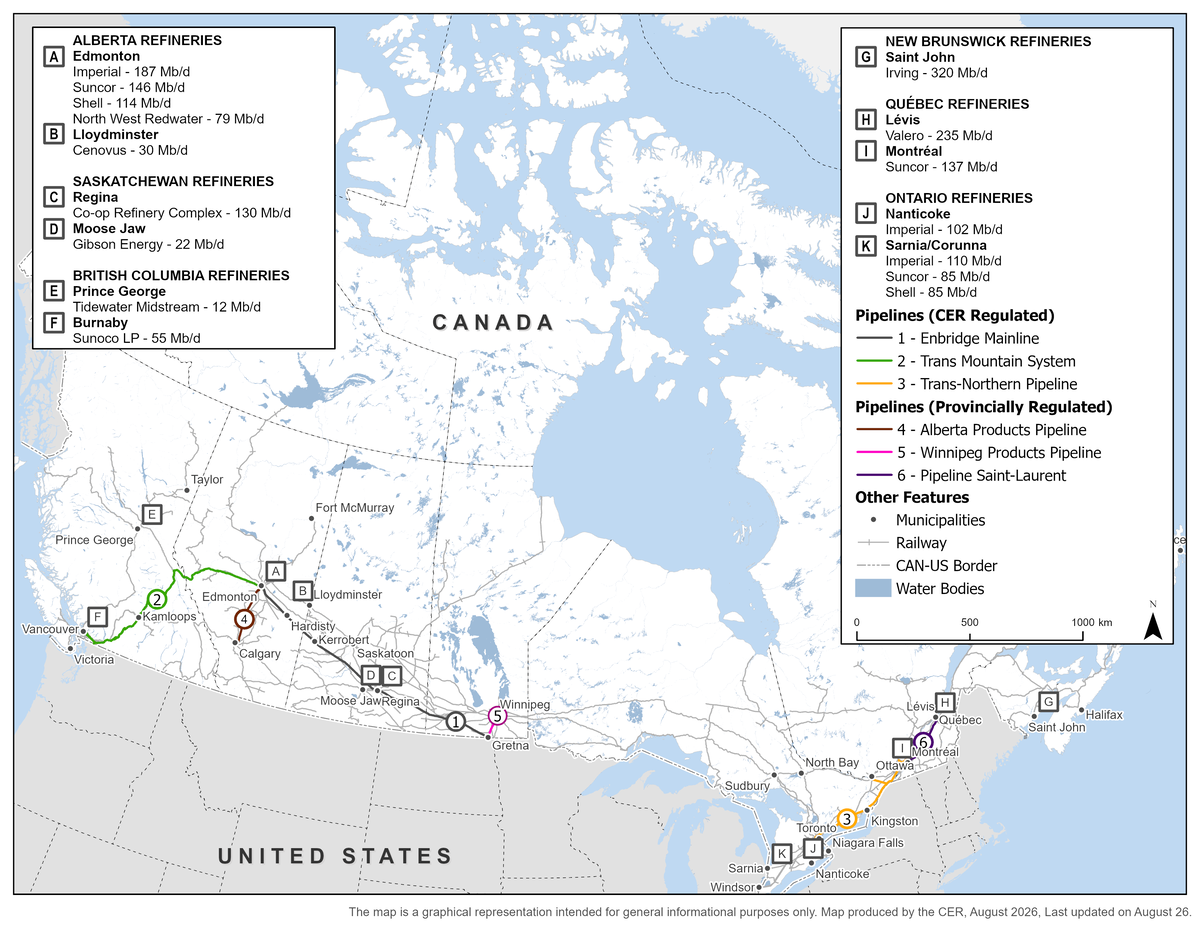
Canada has 16 operating refineries, with a total crude oil processing capacity of up to 1.9 million barrels per day (MMb/d) (Figure 1).Footnote 3 Refining capacity is mostly concentrated in provinces with significant oil production or large populations. Alberta accounts for about 30% of total capacity, followed by Ontario at 21%, Quebec at 20%, New Brunswick at 17%, Saskatchewan at 8%, and British Columbia (B.C.) at 4%.
Canada’s crude oil refining capacity has shifted modestly across regions. The Braya Refinery in Come by Chance, Newfoundland, began operating as a biofuel refinery in 2024 after being converted from a crude oil refinery.Footnote 4 The North West Redwater Refinery in Sturgeon, Alberta, began operations at the end of 2017 and is the first major refinery built in Canada since the 1980s.Footnote 5
Figure 1: Canadian refineries map with key refined petroleum product pipelines
Source: CER; Geomatics Data Management Inc. (GDM)
Text Alternative: Map showing the location of Canada’s refineries and their approximate capacities (Mb/d), alongside major pipeline infrastructure used to move RPPs. CER-regulated pipelines shown are the Enbridge Mainline, Trans Mountain, and Trans-Northern pipeline systems. Provincially regulated pipelines shown are the Alberta Products Pipeline, Winnipeg Products Pipeline, and Pipeline Saint-Laurent. The figure also identifies key rail connections, marine routes, and Canada–U.S. border crossings, highlighting the regional concentration of refining capacity in Alberta, Ontario, Quebec, New Brunswick, Saskatchewan, and B.C., and the systems that transport RPPs across Canada.
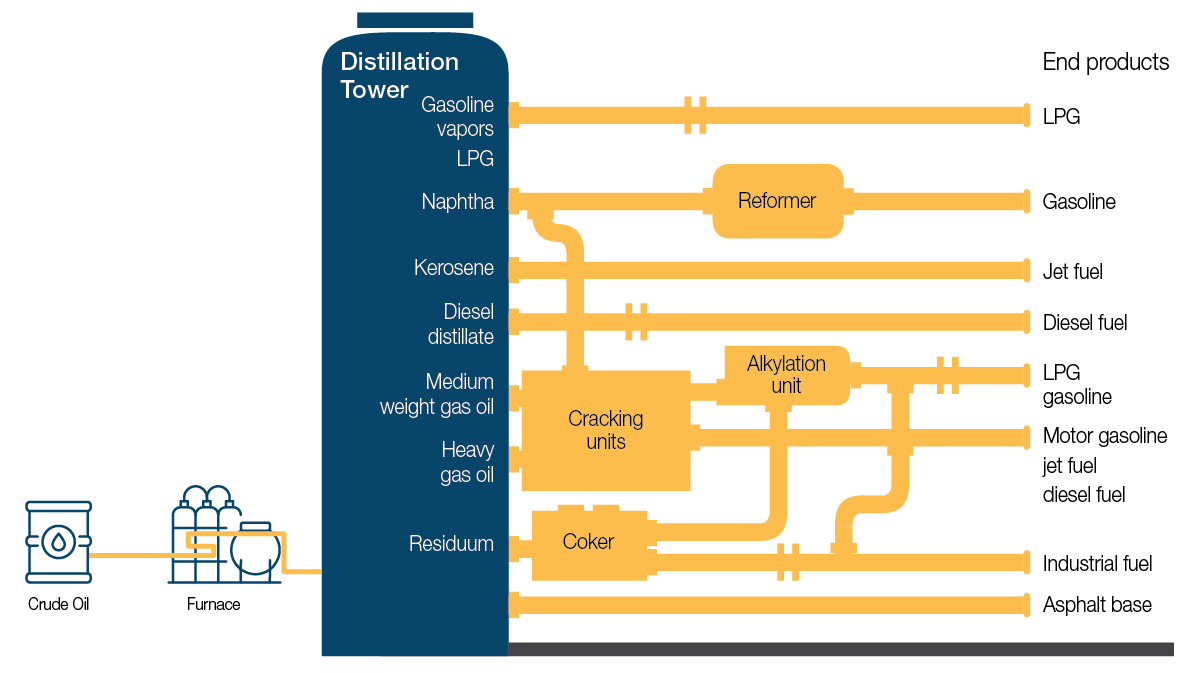
Crude oil is a mixture of hydrocarbons with differing boiling points, which allows refineries to separate it into useful fractions through distillation. Crude oil is heated in a furnace until vaporization occurs, and the resulting vapors and liquids enter an atmospheric distillation tower. Heavier fractions, such as diesel and residual oils, collect at the bottom; lighter fractions, including gasoline, naphtha, and kerosene, rise to the top; and intermediate fractions are withdrawn at points in between. Some products, such as liquefied petroleum gas or kerosene-based jet fuel, can be shipped directly to market, whereas others require further processing in conversion units. Cracking units break large molecules into smaller, higher-value products; reformers chemically adjust light naphtha to increase octane for gasoline blending; and alkylation units combine small molecules into larger ones to improve gasoline quality. Desulphurization units remove sulfur to meet environmental standards. The heaviest fractions are processed in coking units, which use heat and pressure to break down large hydrocarbon molecules into lighter products, such as butane, naphtha, and diesel, and petroleum coke, which can be used in power generation and steelmaking. Finally, blending units combine intermediate streams with additives and renewable components to meet product specifications.
Source: CER
Text Alternative: This figure illustrates the process of producing refined petroleum products at a basic refinery. Crude oil feedstock moves through the furnace, and the resulting vapors and liquids move into the distillation tower and additional processing units to form refined petroleum product outputs.
The type of crude oil that Canadian refineries process reflects the availability of local oil production, transportation infrastructure from oil-producing regions, and refinery configuration. Refineries in western Canada, including Alberta, Saskatchewan, and B.C., are supplied almost exclusively with domestic crude oil through integrated pipeline networks linking oil production sources to refining centres. Alberta processes significant volumes of synthetic and heavy crude oil, whereas Saskatchewan processes mostly heavy crude oil. B.C. refineries primarily process domestic light crude oil transported from Alberta on the Trans Mountain System.
Refineries in Ontario and Quebec receive most of their crude oil supply from western Canada through the Enbridge Mainline System and the connected Enbridge Line 9. Some of the volumes entering these provinces on the Enbridge Mainline System are sourced from the United States. Quebec refineries supplement oil supply with marine imports sourced from the United States. Quebec and Ontario crude oil inputs are weighted toward light, medium, and synthetic crude.
New Brunswick relies predominantly on imported conventional light and medium crude oils delivered by marine tankers to the Canaport deep-water terminal. This supply is supplemented by limited volumes of domestically produced offshore East Coast crude oil.Footnote 6
Table 1. 2025 refinery crude oil inputs by province
| Province | Light Crude Oil** | Heavy Crude Oil** | ||||||||
|---|---|---|---|---|---|---|---|---|---|---|
| Alberta | 77% | 23% | ||||||||
| Saskatchewan | 18% | 82% | ||||||||
| British Columbia* | * | * | ||||||||
| Ontario | 79% | 21% | ||||||||
| Quebec | 90% | 9% | ||||||||
| New Brunswick* | * | * | ||||||||
| Canada | 73% | 27% | ||||||||
|
* Specific values for BC and NB are not published by StatsCan to preserve confidentiality. ** Type of oil processed in refineries is self-reported according to the StatsCan provided types: light/medium, synthetic, heavy, or bitumen. For the purposes of this report, all light oils are aggregated (i.e. light includes synthetic, light, and medium grades) and heavy oils are also aggregated (i.e. heavy includes diluted bitumen). |
||||||||||
Source: Statistics Canada. Table 25-10-0063-01 Supply and disposition of crude oil and equivalent
Weekly crude run dataFootnote 7 indicate that Canadian refineries have operated at high utilization rates, averaging 88–90% since 2022, following the recovery in RPP demand after the COVID-19 pandemic. These high utilization rates reflect relatively stable demand for RPPs (Figure 2).
In 2025, Canadian refineries processed an average of 1.63 MMb/d of crude oil.Footnote 8 Western Canada processed 619 Mb/d of crude oil in 2025, with an 89% utilization rate, almost entirely using domestic crude oil. Quebec and eastern Canada processed approximately 624 Mb/d, with an 89% utilization rate, using a combination of imported and western Canadian crude oil. Ontario processed about 386 Mb/d and recorded the highest regional utilization rate at 92%. Weekly crude runs show seasonal dips during spring and fall, reflecting planned maintenance and fuel specification changes. Outside these periods, refineries generally operate near full capacity.
Figure 2: Canadian weekly refinery crude oil runs
Source: CER, Weekly Crude Run Data
Text Alternative: This figure shows weekly refinery crude oil runs in Ontario, Quebec and eastern Canada, and western Canada from January 2015 to December 2025, comparing them with available refining capacity. Bars represent weekly crude oil runs (thousand barrels per day), while the dark blue line shows regional refining capacity.
Crude oil runs fluctuate across all regions, with periodic declines typically reflecting refinery maintenance or outages. Quebec and eastern Canada have the highest crude run volumes, followed by western Canada, while Ontario has the lowest. All regions generally operate below available refining capacity, although utilization levels vary over time.
In 2025, Canadian refineries and other facilities produced 2.06 MMb/d of RPPs (Figure 3).Footnote 9 Total RPPs production has increased since 2021 from 1.81 MMb/d, returning to pre-pandemic levels. Despite changes in total production, the overall product mix remains relatively stable, with motor gasoline and distillate fuel oil (which includes diesel fuel oil and heating fuel oil) consistently accounting for the majority of production.
In 2025, motor gasoline and distillate fuel oilFootnote 10 accounted for 37% and 35% of total refinery production, respectively. Aviation fuel accounted for 6% of production and residual fuel oilFootnote 11 for 3%, while natural gas liquidsFootnote 12 accounted for about 1% and were used as fuels or petrochemical feedstocks. The remaining production consisted of non-fuel products and by-products, including asphalt for construction and infrastructure (4%), petroleum coke from coking units (4%), petrochemical feedstocks (2%), still gas consumed on-site (7%), and other minor products such as lubricants, waxes, and solvents (<1%).
Refinery production varies across regions based on differences in crude oil supply, refinery configuration and capacity, and regional demand. For example, some refineries in Alberta and Saskatchewan process heavier crude oils and use complex units, such as cokers and hydrocrackers, and as a result produce a higher share of distillate fuel oil than motor gasoline. In contrast, some refineries in B.C. and Ontario are configured for lighter crude oils and produce much more motor gasoline than distillate fuel oil. Quebec refineries produce a more balanced mix of motor gasoline and distillate fuel oil overall.
Figure 3: Canadian refinery production by refined petroleum product
Source: Statistics Canada, Table 25-10-0081-01 Petroleum products by supply and disposition, monthly.
Text Alternative: This figure shows annual average refinery and blender net production of RPPs in Canada from 2019 to 2025, displayed as an area chart by product type. Motor gasoline and distillate fuel oil account for the largest share of total refinery output throughout the period, followed by smaller volumes of still gas, aviation fuel, asphalt, petroleum coke, residual fuel oil, petrochemical feedstocks, natural gas liquids, and other products. Total refinery output declined in 2020 because of reduced fuel demand during the COVID-19 pandemic, before increasing through 2025.
Canadian demand for RPPs averaged 1.43 MMb/d in 2024 (Figure 4).Footnote 13 Demand declined sharply in 2020 during the COVID-19 pandemic as transportation fuel consumption fell, particularly for motor gasoline and aviation fuel. Since 2021, demand gradually increased from 1.33 MMb/d but remains below the pre-pandemic 2019 level of 1.59 MMb/d. Despite changes in total demand, the overall product mix remains relatively stable, with motor gasoline and diesel fuel oil consistently accounting for the majority of demand.
Consistent with RPP production, transportation fuels make up the majority of Canada’s RPP demand. In 2024, motor gasoline accounted for 51% (728 Mb/d) of total refined petroleum product demand in Canada, followed by diesel fuel oil at 35% (495 Mb/d) and aviation turbo fuel at 10% (149 Mb/d). Light fuel oil accounted for 2% of demand, while heavy fuel oil and kerosene and stove oil each accounted for about 1%. Aviation gasoline and petroleum coke represented even smaller shares of total demand.
Overall RPP demand varies significantly across provinces. In 2024, Ontario accounted for about 30% of Canada’s total RPP demand, followed by Quebec at 21%. Demand in these provinces is largely driven by transportation needs, given their large population and extensive transportation networks, as well as commercial and construction activity. In contrast, Alberta accounted for 15% of total Canadian RPP demand, followed by B.C. at 14%, Saskatchewan at 7%, and Manitoba at 4%; demand in these provinces is largely influenced by resource extraction, including mining and oil and gas, as well as transportation and agriculture. The Atlantic provinces accounted for 8% of Canada’s total RPP demand, due in part to residential and commercial heating oil needs, while the Territories represented 1%, reflecting demand from resource extraction, transportation, and heating needs.
Figure 4: Canadian and provincial refined petroleum product demand
Source: Statistics Canada, Table 25-10-0029-01 Supply and demand of primary and secondary energy in terajoules, annual.
Text Alternative: This figure shows annual average Canadian demand for RPPs from 2015 to 2024, displayed as an area chart by product type. Motor gasoline and diesel fuel oil account for the largest share of demand throughout the period, followed by aviation turbo fuel and smaller volumes of light fuel oil, heavy fuel oil, petroleum coke, kerosene and stove oil, and aviation gasoline. Total demand increased from 2015 to 2019, declined sharply in 2020 due to reduced transportation fuel consumption during the COVID-19 pandemic, and gradually increased between 2021 and 2024.
Figure 5 shows that motor gasoline demand is highest in Ontario and Quebec, which together account for more than half of Canada’s total consumption. This reflects larger populations and high reliance on road transportation. Diesel fuel oil demand is more broadly distributed across Canada, with Ontario, Alberta, Quebec, and B.C. accounting for the largest shares of total consumption. Diesel fuel oil also represents a larger share of overall RPP demand in Saskatchewan, the Territories, and Alberta, where freight transportation, agriculture, and resource extraction activity are more significant. Aviation fuel demand is concentrated in Ontario, Quebec, and B.C., which have the largest passenger and cargo aviation hubs. Aviation gasoline represents a smaller share of demand and is primarily used in smaller aircraft, with the highest demand found in Alberta and Manitoba.
Heating fuel demand remains concentrated in Atlantic Canada, Quebec, and Ontario. Quebec accounts for a relatively large share of kerosene and stove oil demand, while light fuel oil and kerosene continue to be used for residential, commercial, and institutional heating in these regions. Heavy fuel oil demand remains more concentrated in regions with marine transportation and industrial activity, particularly in Quebec, B.C., and Atlantic Canada. Petroleum coke represents a relatively small share of total RPP demand and is primarily consumed in industrial applications, particularly in Ontario and Quebec manufacturing.
Figure 5: Refined petroleum product demand by province
Source: Statistics Canada, Table 25-10-0029-01 Supply and disposition of primary and secondary energy in terajoules.
Text Alternative: The figure is a heatmap table showing each province or region’s share of Canadian demand by refined petroleum product type in 2024. Rows represent provinces and regions, while columns represent product categories. Darker blue shading indicates that a province or region accounts for a larger share of Canadian demand for that product. The figure allows comparison of regional demand patterns across motor gasoline, diesel fuel oil, aviation fuels, heating fuels, heavy fuel oil, and petroleum coke.
While some RPPs are exported from Canada, certain regions need to bring in RPPs from other provinces, as well as other countries, to meet regional demand. RPPs are shipped between provinces to move supply from major refining centres to consuming regions. Imported products may be consumed within the importing province or redistributed to other regions in Canada, depending on regional demand, product availability, and transportation access. Together, these trade patterns reflect differences in refinery configurations, product mixes and specifications, transportation infrastructure, and regional demand.
Western Canada largely produces sufficient RPPs to meet its overall needs. Most of the RPP production is in Alberta, with smaller refining centres in B.C. and Saskatchewan. Alberta is Canada’s largest source of RPP shipments to other provinces by a wide margin, supplying significantly more RPPs to other provinces than any other province. In general, Alberta does not import traditional RPPs and provides B.C., Saskatchewan, Manitoba, Northwest Territories, and Yukon with additional product supply to meet their provincial or territorial needs. While B.C. produces about 40% of its own RPPs, it also relied on supply from Alberta and imports of about 34 Mb/d from other countries in 2025. Manitoba also relies on supply from Saskatchewan, while the Territories receive some supply from B.C.
Quebec and Ontario have multiple refineries producing RPPs and are Canada’s largest refined product markets overall, given their large populations. However, they still rely on refined products from other provinces or countries. Quebec imported about 103 Mb/d of RPPs in 2025, with about half from the United States (U.S.) and most of the remainder from Europe, and also supplied some RPPs to Ontario markets. In addition to receiving RPPs from other provinces, Ontario also imported about 36 Mb/d of RPPs, mostly from the U.S.
Atlantic Canada as a whole imported about 41 Mb/d of RPPs in 2025, given its lack of pipeline connections to the rest of Canada and the presence of only one major refinery in the region, located in New Brunswick. Quebec also supplies Atlantic Canada with some RPPs.
Atlantic Canada, B.C., Ontario, and Quebec all have access to international markets and can source international RPP supplies when needed.
Figure 6: International trade (imports/exports) by trade partners’ country
Source: Statistics Canada, Canadian International Merchandise Trade (CIMT) Web Application
Text Alternative: This figure shows annual average RPPs import or export volumes for Atlantic Canada, Quebec, and Ontario from 2015 to 2025, broken down by country of origin (for imports) or destination (for exports). Stacked bars represent total volumes, while colours identify individual countries. The United States accounts for the largest share of trade volumes across all three regions throughout the period, with smaller volumes associated with countries such as the Netherlands, the United Kingdom, Belgium, Norway, and others. Trade volumes vary over time and by region.
The U.S. is Canada’s largest source of RPP imports, accounting for approximately 80% of total imports, although countries of origin vary by region. For example, about half of Atlantic Canada’s imports come from the U.S., with the remainder primarily sourced from European markets. Quebec imports just over twice Atlantic Canada’s volume and shows a similar sourcing pattern, with roughly half sourced from the U.S. and the remainder from European markets. B.C. imports are primarily sourced from the U.S., with additional volumes from Asia-Pacific markets. Ontario imports are also primarily sourced from the U.S. due to pipeline connectivity. Canada primarily imports motor gasoline, petroleum coke, and aviation turbo fuel.
Regions tend to export RPPs when regional supply exceeds demand and when economics support serving export markets rather than domestic ones. Atlantic Canada exported 197 Mb/d of RPPs in 2025, accounting for the largest share of exports in Canada. Most of these exports came from New Brunswick, where the Irving Refinery is located. Alberta, western Canada’s primary refining hub, also exported 69 Mb/d of RPPs. Quebec and Ontario exported 90 Mb/d and 26 Mb/d of RPPs, respectively. Exports from Canada are primarily made up of motor gasoline and diesel fuel oil.
The U.S. is Canada’s largest export destination, receiving more than 80% of Canada’s RPP exports, including most exports from Atlantic Canada, Quebec, and Ontario. Most western Canadian exports also go to the U.S., with additional shipments to Mexico, South America, and beyond.
RPP pricing is highly regionalized and product specific. This section focuses on wholesale prices for gasoline because they illustrate many of the broader pricing dynamics observed across RPPs. For example, gasoline and diesel are influenced by similar structural factors and often follow similar regional patterns, although seasonal demand drivers may differ.
Whereas crude oil prices are often anchored to major benchmarks, RPPs are priced closer to end-use markets. Prices can vary significantly within and across regions depending on refinery configuration and capacity, transportation infrastructure, inventory levels, seasonal demand patterns, and the availability of alternative crude oil and refined product supply sources. Each refined product also has distinct supply and demand dynamics. For instance, gasoline demand typically increases during the summer driving season, whereas diesel demand is more closely tied to freight transportation, industrial activity, agriculture, and heating demand in certain regions. Refinery production decisions, regional fuel specifications, and seasonal consumption patterns can result in different pricing outcomes across products.
RPP prices are commonly assessed at both the wholesale and retail levels. Wholesale prices, referred to as rack prices, reflect the price of fuel sold at distribution terminals and exclude taxes, retail margins, and final delivery costs. Retail prices can differ materially from wholesale market prices because they include each of these additional costs. By excluding these costs, the gasoline rack prices provided in this section more directly reflect crude oil input costs, refining margins, longer-distance transportation costs, and regional supply and demand conditions.
Comparing prices between major cities (i.e. price differentials) helps isolate regional market dynamics by removing broader pricing movements that affect all markets simultaneously, such as changes in crude oil input costs or refining margins. These differentials provide insight into more localized supply constraints, infrastructure connectivity, and market integration. Markets with well-connected infrastructure and diverse supply options tend to have narrower and more stable price differentials, whereas more isolated markets often experience wider and more volatile spreads.
Figure 7: Gasoline rack prices and price differentials by city
Source: Natural Resources Canada, Average Wholesale (Rack) Prices
Text Alternative: This figure shows weekly or monthly average wholesale rack prices for regular motor gasoline across major Canadian markets from 2017 to 2025. The upper chart compares rack prices in Calgary, Edmonton, Montreal, Ottawa, Sarnia, Saint John, Toronto, and Vancouver. The lower chart shows the price difference between two selected regions highlighting regional pricing differences over time.
Figure 7 shows gasoline rack prices for selected Canadian cities. While prices across the country generally move together, often as crude oil prices fluctuate, differences in regional supply structures can result in persistent price differences between markets. For example, Vancouver is consistently a high-priced market in western Canada, whereas among central and eastern Canadian markets, Montreal is generally the highest, followed by Saint John, New Brunswick. Toronto, Ottawa, and Sarnia tend to be similar and fall within a mid-price range, and Calgary and Edmonton consistently represent the lowest-priced markets.
Regional differences in rack gasoline prices reflect proximity to refineries, availability of transportation infrastructure for crude oil supply and refined product distribution, and overall supply diversity. These factors create distinct regional market structures across Canada. Price differences between closely integrated markets, such as Toronto and Ottawa or Calgary and Edmonton, tend to remain narrow and stable over time. In contrast, differentials between these more stable, well-supplied markets and markets with more limited supply options, such as Vancouver relative to Edmonton, are wider and fluctuate more.
For instance, Vancouver is a structurally higher-cost wholesale market in western Canada that trades at a premium to Edmonton because of its regional supply characteristics. B.C. has limited refining capacity relative to demand, so it relies on additional product supply from Alberta as well as imports from the U.S. Between 2017 and 2025, as illustrated in Figure 7, Vancouver gasoline rack prices were, on average, 19.7 cents per litre higher than Edmonton gasoline rack prices. The price differential reached its widest level and was most volatile during the two-year period from mid-2022 through mid-2024.
In central Canada, Toronto and Ottawa have very similar gasoline prices because they receive supply from similar sources and face comparable transportation costs. These markets are primarily supplied by the Nanticoke and Sarnia refineries, as well as refineries in Quebec. Central Canadian markets are also supported by several modes of transporting RPPs, including pipelines. As a result, price differentials between Toronto and Ottawa tend to remain relatively narrow over time. Montreal generally shows a premium relative to Toronto, with the premium widening beginning in 2022. This is partly due to differences in refinery crude oil sourcing; Montreal is more directly linked to Atlantic Basin crude oil and gasoline markets, including the U.S. East Coast.Footnote 15 In contrast, Toronto and Ottawa are supplied primarily by domestic refining centres that receive more crude oil supply from western Canada via pipeline and are more closely tied to North America crude oil pricing.Footnote 16 These differences in crude oil supply costs can result in persistent price differentials between these markets.
In Atlantic Canada, Saint John, New Brunswick, home to Irving Oil’s refinery, also tends to be priced higher than Toronto and Ottawa despite having significant refining capacity. Unlike central Canadian refineries, Saint John does not have pipeline access to western Canadian crude oil supply and is more exposed to global crude oil and refined product markets through marine transportation. Gasoline rack prices in Saint John generally track those in Montreal and, like Montreal, have been higher than Toronto since 2022. The relatively small difference between Saint John and Montreal partly reflects similar exposure to Atlantic Basin pricing dynamics.
In Canada, RPPs are transported using pipelines, marine vessels, rail, and trucks. The role of each mode of transportation varies by region, depending on the available infrastructure, geography, and refining capacity. These modes of transportation tend to operate as an integrated system. Pipelines, rail, and marine tankers transport large volumes into regional markets, whereas trucks typically distribute products from wholesale terminals to commercial and retail consumers. Trucks also provide flexibility when other transportation options are constrained or unavailable.
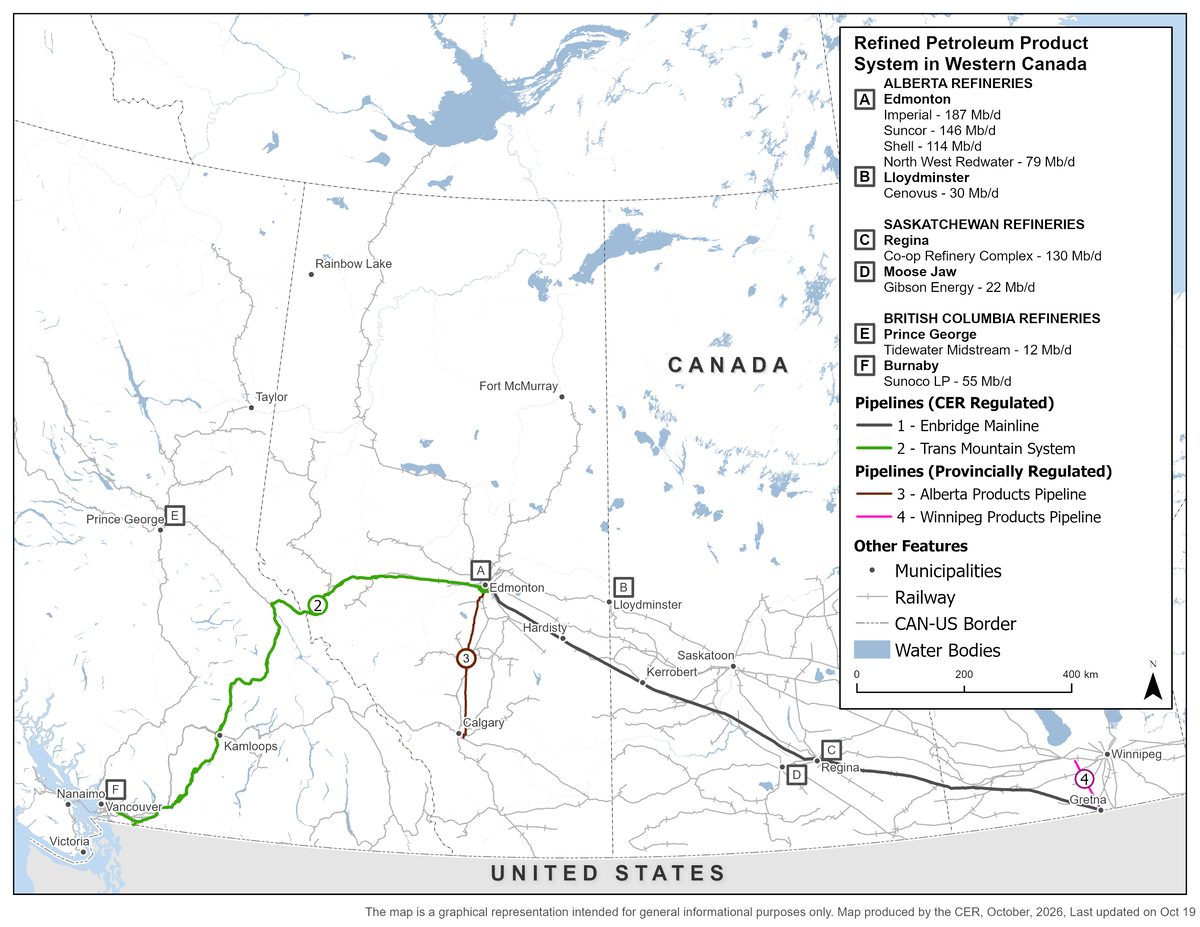
In western Canada, RPPs are supplied from multiple refineries, including several in the Edmonton area, as well as in Regina, Moose Jaw, Prince George, and Burnaby. The Edmonton region is the largest refining hub and supplies much of Alberta, as well as portions of B.C., Saskatchewan, and Manitoba. Two large CER-regulated pipelines enable transportation of Alberta-produced RPPs to other western Canadian provinces.
Figure 8: Refined petroleum product transportation network in western Canada
Source: CER; Geomatics Data Management Inc. (GDM)
Text Alternative: Map showing the location of refineries in western Canada and their approximate capacities (Mb/d), along with major pipeline infrastructure used to transport RPPs. The CER-regulated pipelines shown are the Enbridge Mainline and Trans Mountain systems, while provincially regulated infrastructure shown includes the Alberta Products Pipeline and Winnipeg Products Pipeline. The figure highlights the concentration of refining capacity in the Edmonton region, along with smaller refineries in Lloydminster, Regina, Moose Jaw, Prince George, and Burnaby. It also illustrates how pipeline infrastructure connects western Canadian refining centres to demand markets in B.C., the Prairies, and export markets on the west coast.
The Trans Mountain System transports RPPs, along with crude oil, westbound from Edmonton to delivery points in B.C. RPPs are delivered to product terminals in Kamloops and Burnaby,Footnote 17 where they enter local distribution networks. Crude oil is delivered to the Burnaby refinery, where it is processed into RPPs for regional distribution. As a result, B.C. receives RPP supply from the Trans Mountain System through both direct shipments of RPPs and indirect supply of crude oil that is locally refined.
RPP throughput on the Trans Mountain System averaged 32.3 Mb/d in 2021 and gradually increased over the following two years as transportation fuel demand normalized after the pandemic. In the year before the expansion entered service, RPP throughput averaged 35.3 Mb/d in 2023 (Figure 9). Following the startup of the expanded system, throughput increased to an average of 45.9 Mb/d in 2025, reflecting a 42% increase from 2021. Prior to the expansion, available capacity for RPPs was more limited and shipper nominations were periodically apportioned. Since the expansion entered service, the system has had greater available capacity to transport both RPPs and crude oil.Footnote 18
Figure 9: Refined product flows on Trans Mountain System
Source: CER, Pipeline Throughput and Capacity Data; Geomatics Data Management Inc. (GDM), Esri, TomTom, Garmin, FAO, NOAA, USGS, &sopy;OpenStreetMap contributors, and the GIS User Community
Text Alternative: This figure presents a map on the left and a time-series chart on the right. The map highlights the Trans Mountain System and identifies key delivery points in Alberta and B.C., including Edmonton, and Sumas and Burnaby in the Lower Mainland export region. The time-series chart displays monthly throughput trends in thousand barrels per day (Mb/d) for the Trans Mountain System from 2015 to 2025.
The Enbridge Mainline System also transports RPPs in western Canada. In particular, Line 1 can transport RPPs from the Edmonton area and Regina refineries to delivery points in Saskatchewan and Manitoba.Footnote 19Footnote 20 These deliveries supplement RPPs produced by Saskatchewan refineries.
Provincially regulated pipeline systems also play an important role, moving supply from refining hubs to major demand centres. For instance, the Alberta Products Pipeline distributes RPPs within Alberta by moving supply from the Edmonton refining hub to major demand centres, such as Calgary. The Winnipeg Products PipelineFootnote 21 moves RPPs within Manitoba from the Enbridge Mainline System’s delivery point at Gretna to the Winnipeg demand centre.Footnote 22
Rail is also used to move RPPs within western Canada, particularly to destinations not directly connected by pipeline infrastructure or during periods of reduced pipeline capacity, such as outages. Trucks are used to move products from wholesale terminals to end users across the region. Coastal B.C. markets rely on marine transportation for some RPP movements.
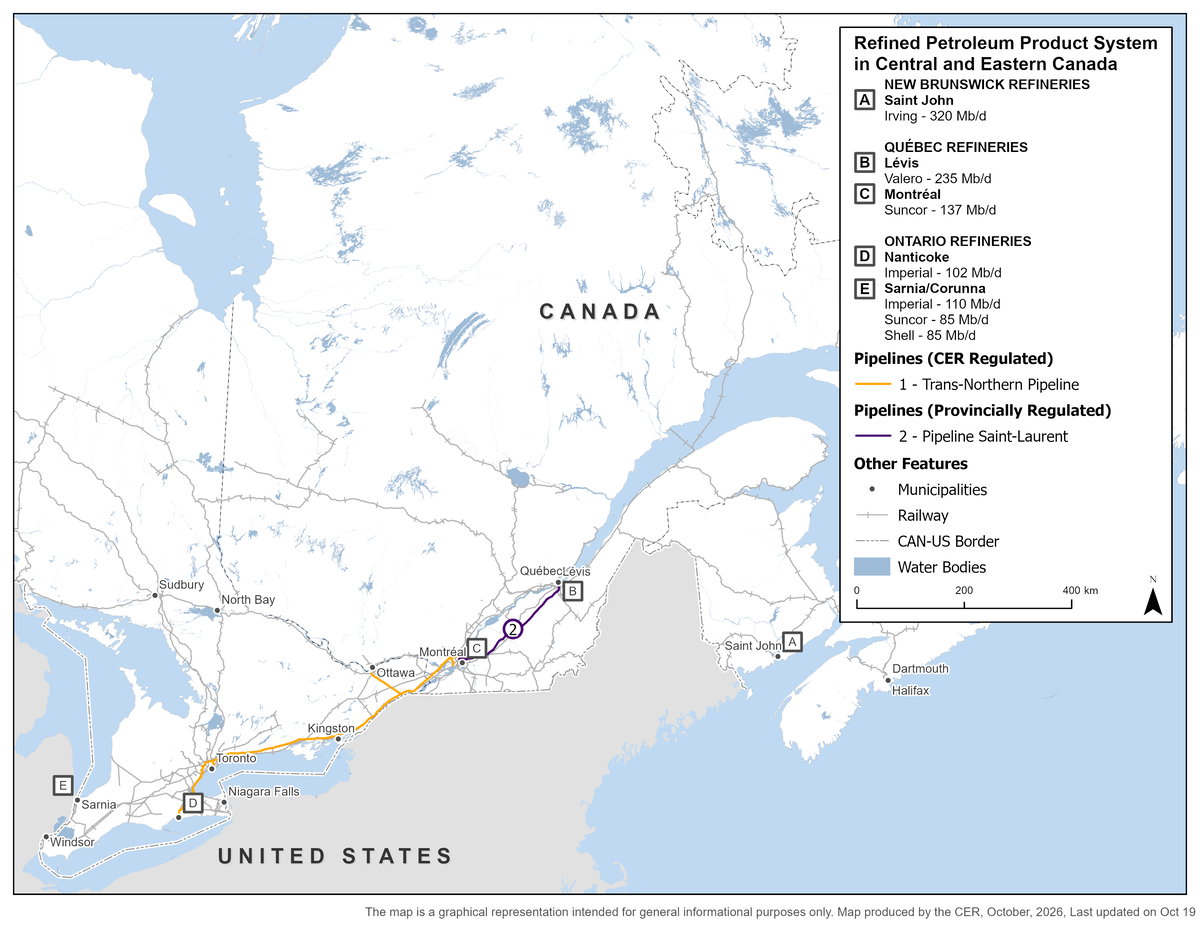
In central Canada, RPPs are supplied from refineries located in Sarnia and Nanticoke, Ontario, as well as in Montreal and Levis, Quebec. RPPs are transported to highly populated downstream markets using a combination of pipelines, marine vessels, rail, and truck transportation.
Figure 10: Refined petroleum product transportation network in central and eastern Canada
Source: CER; Geomatics Data Management Inc. (GDM)
Text Alternative: Map showing the location of refineries in central and eastern Canada and their approximate capacities (Mb/d), along with key pipeline infrastructure used to transport RPPs. The CER-regulated infrastructure shown is the Trans-Northern Pipeline System, while provincially regulated infrastructure shown is the St. Lawrence Pipeline. The figure highlights refinery locations in Ontario, Quebec, and New Brunswick, specifically the refining hub in Sarnia/Corunna, and refineries in Nanticoke, Montreal, Levis, and Saint John. It also illustrates how pipeline infrastructure supports product movements between major population centres in central Canada.
The Trans-Northern Pipeline System (TNPI System) transports RPPs across Ontario and Quebec, connecting refining centres with major demand regions, including the Greater Toronto Area (GTA), Ottawa, and Montreal. The TNPI System operates as two main segments: the Nanticoke-East segment, which provides west-to-east movements from Nanticoke to the GTA, and the Montreal-West segment, which provides east-to-west movements from Montreal to Ottawa. Prior to July 2025, the Montreal-West segment also served the GTA market, but service on the West Line (i.e. the portion of the segment downstream of Farran’s Point) ceased.Footnote 23
Overall, RPP throughput on the TNPI System declined from 212 Mb/d in 2015 to 136 Mb/d in 2025 (Figure 11). Throughput fell sharply in 2020, reflecting reduced transportation fuel demand during the pandemic, before partially rebounding in 2023. It declined again in 2024 and 2025 as the West Line portion of the system became uneconomic, under-utilized, and ultimately ceased service at the end of June 2025.
Utilization varies across the remaining portions of the system. The Montreal–West segment has shown greater variability, with throughput dropping from approximately 73 Mb/d in 2024 to 51 Mb/d in the second half of 2025 after service ceased on the West Line. The Nanticoke–East segment has remained more stable, averaging approximately 74–75 Mb/d over 2024 and 2025. Since the Nanticoke-East segment has generally been fully utilized and was apportioned in recent years, TNPI and its owners are considering reversing a portion of the West Line from North Toronto to Oakville. Some shippers indicated that they use a combination of marine and rail transportation to replace the West Line service, which also requires greater use of a portion of the Nanticoke-East segment from Oakville terminal into the GTA.Footnote 24
Figure 11: Trans-Northern Pipeline System refined petroleum product throughput
Source: CER, Pipeline Throughput and Capacity Data; Geomatics Data Management Inc. (GDM), Esri, TomTom, Garmin, FAO, NOAA, USGS, &sopy;OpenStreetMap contributors, and the GIS User Community
Text Alternative: This figure presents a map on the left and a time-series chart on the right. The map highlights the Trans-Northern Pipeline System. The time-series chart displays monthly throughput trends in thousand barrels per day (Mb/d) for the overall Trans-Northern Pipeline System, as well as for the two main segments (Nanticoke-East and Montreal-West) from 2015 to 2025.
Southern Ontario, including the GTA, receives RPPs from refineries in Sarnia, Nanticoke, and Montreal through a combination of pipeline systems, rail, marine, and truck transportation. Regional pipeline systems, including the TNPI System, as well as the provincially regulated Sun-Canadian Pipe Line and Sarnia Products Pipeline, transport RPPs from refinery hubs to distribution terminals across southwestern Ontario and the GTA. Marine transportation into Ontario operates primarily during non-winter months, while rail and truck transportation provide additional supply flexibility, particularly for markets that are not directly connected to pipeline infrastructure or no longer receive supply from portions of the TNPI System.
Quebec and eastern Ontario receive RPPs from: refineries in Montreal and Levis, Quebec; marine deliveries along the St. Lawrence from domestic and imported sources; and rail. Eastern Ontario receives RPPs from a combination of Ontario and Quebec refining centres, supported by the TNPI System and other transportation modes. Pipeline Saint-Laurent transports RPPs from Valero’s refinery in Levis to the Montreal East terminal, supporting supply to the Montreal metropolitan region and western Quebec. Following the cessation of TNPI’s service west of Farran’s Point, some markets in eastern Ontario that no longer receive supply from the TNPI System increasingly rely on rail and truck transportation.
In Atlantic Canada, RPPs are supplied primarily by the Irving Oil refinery in Saint John, New Brunswick, along with marine imports delivered to coastal terminals. The region is not connected to pipeline infrastructure from other parts of Canada and relies primarily on marine transportation to move products between provinces, supply regional markets, and support imports and exports. Truck transportation is used to distribute products from terminals to end users, including retail fuel stations, airports, and industrial customers. Terminal storage is important for managing supply between marine deliveries and downstream distribution.
In Yukon, the Northwest Territories, and Nunavut, the absence of pipeline infrastructure from other provinces means these regions rely on non-pipeline transportation alternatives, including truck transportation, often using seasonal winter roads, as well as rail connections in limited areas and seasonal marine transportation. The transportation modes used vary by location, and RPP deliveries are often scheduled around seasonal access windows, including annual marine shipments during ice-free periods and winter road access for some remote communities. These transportation constraints increase the importance of local storage capacity, particularly for diesel fuel oil used in transportation, heating, and power generation.Footnote 25