ARCHIVED – National Energy Board – 2016–17 Departmental Results Report – Results: what we achieved
This page has been archived on the Web
Information identified as archived is provided for reference, research or recordkeeping purposes. It is not subject to the Government of Canada Web Standards and has not been altered or updated since it was archived. Please contact us to request a format other than those available.
Programs
Energy Regulation
Description
This program provides the regulatory framework under which the NEB carries out its mandate and achieves part of its strategic outcome. Specifically, it enables Canadian federally regulated energy infrastructure to be developed and supervised throughout its lifecycle. The regulatory framework includes components such as setting expectations for industry and others, monitoring and enforcing compliance with requirements, measuring performance of the NEB’s regulatory framework and focusing on continual improvement. The authority for this program is derived from the National Energy Board Act, the Canada Oil and Gas Operations Act, the Canada Petroleum Resources Act, the Canada Labour Code and other associated regulations and guidelines. Energy regulation provides Canadians with safe, reliable and efficient energy supply.
Results
Significant recommendation and decision reports released in 2016–17 included:
NEB conducted 31 hearings in 2016–17, 15 of which were still active at the end of the fiscal year. Our Participant Funding Program (PFP) was used extensively over the year, and the NEB administered a funding envelope of more than $15M, enabling 281 groups or individuals to participate in our adjudication processes who otherwise may not have done so.
In 2016–17, the PFP doubled the funding envelope for Energy East from $5M to $10M and announced $1.2M for 5 new funding opportunities. The PFP also reimbursed $794 thousand to 41 recipients (37% Indigenous, 7% individuals, 56% non-for-profit) for eligible expenses, such as legal/expert consultants and travel, to participate in the Line 10, Towerbirch, Vaughn and Energy East hearings. Improvements were made to the program based on feedback from the 5 year evaluation and funding applicants.
We made significant process improvements to our Indigenous public participation activities and adjudication processes to provide culturally appropriate opportunities for Indigenous Peoples to provide input into the hearing process including Oral Traditional Evidence, and better reflect the issues of concern to First Nations communities in our project reviews:
- In the Enbridge Line 10 assessment, the NEB piloted an idea called “pre-decided standing”, offering Indigenous Peoples, landowners and municipalities automatic approval to participate in the hearing, in the way that best suited them.
- For the Vaughn Mainline Expansion Project, we piloted on-the-record Community Meetings: an informal way for the Panel, who would eventually make the final ruling on the project, to hear those who wanted to share their views and knowledge. Participants were not required to submit their comments in writing, and could speak their concerns and ask questions directly to the Panel.
Tracking Project Conditions
We continue to make strides towards being more transparent and open with the launch of an online Condition Compliance Table that lets Canadians track how well companies are doing with pipeline approval conditions. Information on more than 3,200 detailed approval conditions is now available to Canadians in a simplified, searchable format.
REGDOCS, our public external website for regulatory documents, was revamped in December 2016, making the records easier for the public to search for and access. We received more than 200 comments on the new structure from the public, and are using that feedback to plan for further user-driven improvements.
The NEB also made significant progress in supporting the co-development of the Terms of Reference for the Indigenous Advisory and Monitoring Committees (IAMC) which is being led by the Major Projects Management Office – West (MPMO-W). The IAMC is a result of a commitment made by the Prime Minister in November 2016 following the approval of the TMX and Line 3 projects. IAMC working groups for both projects have been established. Workshops were held in February throughout BC and Alberta with Indigenous groups along the routes for each project to seek input on the Terms of Reference, with a total of more than 150 Indigenous participants contributing to the finalized Terms.
The NEB completed a total of 402 compliance activities over the course of the 2016–17 fiscal year, including 172 Field Inspections and 6 focused management system audits. In addition to surpassing our planned compliance activity targets, the NEB has steadily increased its capacity for regulatory program data tracking and analysis.
The NEB has implemented new electronic tools enabling more standardized, efficient field data collection, and facilitating faster compliance analysis and action. This focuses our activities where they will be most effective in identifying and preventing harms, and prepares a foundation for more transparent and responsive reporting to Canadians under our Department Results Framework.
Collaboration for Safety Culture
The NEB is a part of the North American Working Group on Safety Culture, a collaborative group of regulators from across Canada and the United States that works together to advance safety culture.
The NEB is also leading a multi-phased safety culture indicators project on behalf of the International Regulators Forum.
NEB and ASEA (the Ministry of the Environment and Natural Resources of the United Mexican States) made a joint proposal to the Organization for Economic Cooperation and development to progress Safety Culture related research.
The NEB is using these learnings to formulate indicators and tools to collect baseline information on safety culture across industry, and identify specific dimensions, attributes and measures that allow us to evaluate an internal culture of safety and environmental protection.
NEB’s leadership of the North American Regulatory Working Group resulted in three accepted recommendations to advance safety culture:
- safety culture assessment for regulators
- pilot indicators in compliance verification activities
- safety culture competency and training
In doing this, the NEB has developed a framework through which prevention of harms is the lens through which our regulated companies – and we as a regulator – assess our on-going activities. Ultimately, this results in better safety and environmental protection for Canadians.
| Expected results | Performance indicators | Target | Date to achieve target | 2016–17 Actual results |
2015–16 Actual results |
2014–15 Actual results |
|---|---|---|---|---|---|---|
Regulated activities are conducted in accordance with regulatory requirements |
Number of inspections conducted per fiscal year | 150 | Annually | 172 | 177 | 192 |
| Number of audits conducted per fiscal year | 6 | Annually | 6 | 5 | 6 |
| 2016–17 Main Estimates |
2016–17 Planned spending |
2016–17 Total authorities available for use |
2016–17 Actual spending (authorities used) |
2016–17 Difference (actual minus planned) |
|---|---|---|---|---|
| 58,584,596 | 61,322,894 | 61,255,420 | 40,961,325 | (20,361,569) |
| 2016–17 Planned |
2016–17 Actual |
2016–17 Difference (actual minus planned) |
|---|---|---|
| 294.2 | 276.7 | (17.5) |
Information on the National Energy Board’s lower-level programs is available on the departmental website and in the TBS InfoBase.
Energy Information
Description
Under this program, the supply, demand, production, development, transmission and trade of energy are analyzed to ensure the requirements of Canadians are appropriately met. Advice is provided on energy issues of interest. The Board uses energy information to inform its regulatory decisions and to produce publicly available assessments of energy trends, events and issues that may affect Canadian energy markets and the supply and demand for energy.
Results
Key Energy System Publications of 2016–17:
The NEB provides accurate and neutral Energy System Information and Pipeline Information on our website. Canadians accessed that energy information on our website information close to 570,000 times in 2016–17 – an increase of 23 percent over the total of just under 550,000 the previous year. The NEB released several prominent Energy System Information products over the year, including content covering broader issues such as greenhouse gas emissions and renewable energy. Many of these products featured streamlined content and innovative formats, including maps and provincial or territorial information, giving Canadians more insight into where and how energy moves throughout our country.
Additional innovations undertaken in 2016 include the launch of interactive data visualizations designed to make complex information more accessible and useful to Canadians. These focused on long-term energy production and consumption trends and provided an additional 168,000 website visits beyond those already mentioned. We also increased our use of social media platforms to share energy system and pipeline information, including Twitter and LinkedIn. The NEB’s Twitter engagement with stakeholders grew by 711 percent, from less than 700 in 2015–16 to 4,958 in 2016–17.
Ongoing publication of short, informative Market Snapshots also ensured that a consistent and timely online presence was maintained. In doing so, NEB energy information generated 352 public queries, an increase of 28 percent over our target, indicating that our energy products are working to stimulate informed discussion and interaction with Canadians.
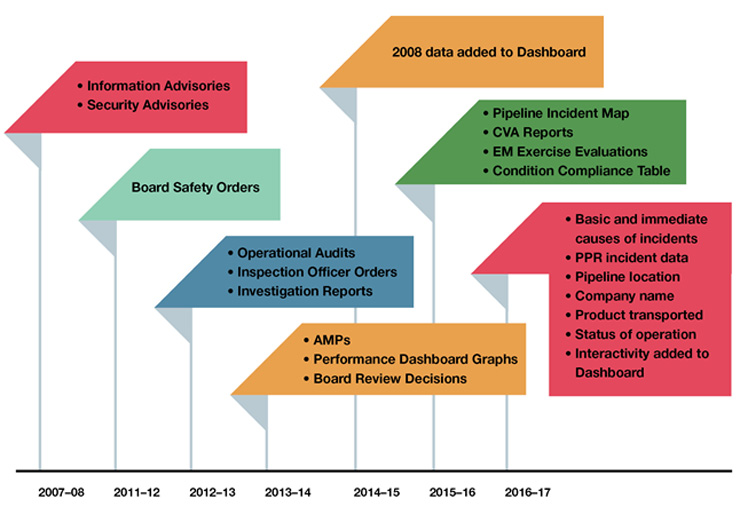
Fig. 1: Timeline of NEB Pipeline Information released online
The NEB continued to expand the amount of information it provides to Canadians on pipeline safety and environmental issues. During the fiscal year, the NEB enhanced its pipeline incident map by adding incident cause data under the Processing Plant Regulations. Interactive profiles of NEB-regulated pipelines, including locations, company names, products transported, and status of operation were also added to the map. In addition, the NEB enhanced its Safety and Environmental Performance Dashboard by adding new interactive features. Canadians can now access a comprehensive overview of pipeline performance, regulatory actions and operation status, all in one place.
| Expected results | Performance indicators | Target | Date to achieve target |
2016–17 Actual results |
2015–16 Actual results |
2014–15 Actual results |
|---|---|---|---|---|---|---|
| Energy supply and market information supports regulatory decision-making | Percentage of level of satisfaction of Board Members with energy supply and market information and analysis in the context of regulatory processes | 100% | Annually | 100% | n/a | n/a |
| Canadians access energy related analysis and information | Number of visits to the Energy Information webpage or material per fiscal year | ≥ 500,000 | Annually | 569,102 | 544,244 | 558,073 |
| 2016–17 Main Estimates |
2016–17 Planned spending | 2016–17 Total authorities available for use |
2016–17 Actual spending (authorities used) |
2016–17 Difference (actual minus planned) |
|---|---|---|---|---|
| 7,307,066 | 7,648,605 | 7,542,996 | 6,125,216 | (1,523,389) |
| 2016–17 Planned | 2016–17 Actual | 2016–17 Difference (actual minus planned) |
|---|---|---|
| 42.4 | 37.3 | (5.1) |
Internal Services
Description
Internal Services are those groups of related activities and resources that the federal government considers to be services in support of programs and/or required to meet corporate obligations of an organization. Internal Services refers to the activities and resources of the 10 distinct service categories that support Program delivery in the organization, regardless of the Internal Services delivery model in a department. The 10 service categories are: Management and Oversight Services; Communications Services; Legal Services; Human Resources Management Services; Financial Management Services; Information Management Services; Information Technology Services; Real Property Services; Materiel Services; and Acquisition Services.
Results
The NEB invested significantly in its Management and Oversight Program over 2016–17, in support of our transition a new DRF, which was approved in December 2016. To establish the necessary governance and accountability structures to successfully implement a results-oriented culture and drive continual improvements in the outcomes of our Core Responsibilities, the NEB developed a Board Member Operating Model, a Management System Manual, and a detailed accountability matrix for all programs.
In addition, the NEB undertook a significant reorganization, to ensure that our programs were correctly aligned to efficiently support our Core Responsibilities, and to reflect the Policy on Results’ defined structures Internal Services.
During the past year the NEB has prioritized an “Enterprise-First, Architecture-Principled and Data-Driven Approach” in our Information Technology and Information Management (IM/IT) services, piloting an Information Management and Architecture portfolio management process focused on capacity planning and budget strategies. The new portfolio management process has increased NEB planning efficiency by identifying common business requirements and consolidating efforts. It also ensures that all IT/ IM investments support the Departmental Results Framework and are aligned with the Enterprise Architecture Framework.
In conjunction with this, the NEB’s IM/IT services have also been reviewed and adapted to incorporate Shared Services Canada’s evolving mandate, as well as to support the Canada’s Action Plan on Open Government. Working with the Treasury Board Secretariat on the Canada.ca Web Renewal Initiative, the NEB’s web team launched Web Experience Toolkit 4.0, which was an important milestone towards readying our site for full content migration to the Canada.ca site.
Steady progress has been made on aligning the NEB’s resource planning, financial management and procurement systems with Government of Canada-wide standards; MyGCHR and the Phoenix pay systems have been onboarded.
| 2016–17 Main Estimates |
2016–17 Planned spending |
2016–17 Total authorities available for use |
2016–17 Actual spending (authorities used) |
2016–17 Difference (actual minus planned) |
|---|---|---|---|---|
| 23,533,785 | 24,633,776 | 24,358,500 | 37,530,277 | 12,896,501 |
| 2016–17 Planned |
2016–17 Actual |
2016–17 Difference (actual minus planned) |
|---|---|---|
| 158.8 | 160.5 | 1.7 |
- Date modified: