ARCHIVED – Canada’s Energy Future 2016: Update – Energy Supply and Demand Projections to 2040
This page has been archived on the Web
Information identified as archived is provided for reference, research or recordkeeping purposes. It is not subject to the Government of Canada Web Standards and has not been altered or updated since it was archived. Please contact us to request a format other than those available.
October 2016
Copyright/Permission to Reproduce
ISSN 2369-1479
Analysis in the Energy Futures series is not a prediction of what will take place in the future. Rather, Energy Futures employs economic, and energy supply and demand models, to make projections based on a certain set of assumptions of what we know today about technology, energy and climate policies, human behaviour and the structure of the economy. Over the projection period, it is likely that developments beyond the realm of normal expectations, such as geopolitical events or technological breakthroughs, will occur. Likewise, new information becomes available and trends, policies, and technology evolve. Readers of this analysis should consider the projections a baseline for discussing Canada’s energy future today, not a prediction of what will take place
How to cite: National Energy Board. Canada's Energy Future 2016: Update - Energy Supply and Demand Projections to 2040
DOI: https://doi.org/10.35002/vk3y-j476
Downloads
Data
Table of Contents
Letter from the Chair and CEO of the National Energy Board
I am pleased to present the latest edition of the National Energy Board’s (NEB or Board) Energy Futures series: Canada’s Energy Future 2016: Update (Update 2016). This report builds upon the report the Board released in January 2016, which was prepared at a time of considerable change for the Canadian and global energy systems. The Paris climate agreement had just been adopted and governments in Canada were beginning to take ambitious actions related to climate change. Meanwhile, the price of crude oil had dropped by more than US$10 per barrel over a two month period, and was just above US$ 30 per barrel on the day of the report’s release.
In January we committed to providing an update to our work in fall 2016 to continue to inform Canadians on evolving market and policy conditions. Update 2016 delivers the NEB’s latest long-term energy supply and demand outlook for Canada, incorporating developments over the past year. As the only publically available long-term energy supply and demand outlook covering all energy commodities and all provinces and territories, this provides Canadians a key reference point for discussing the country's energy future.
Update 2016 also comes during a time of transition. Earlier this month the Government of Canada announced its plan to price carbon pollution, a central component of the Pan-Canadian Framework on Clean Growth and Climate Change. The plan, which ensures all jurisdictions in Canada have some form of carbon pricing in place by 2018, represents perhaps one of the most significant federal climate policy announcement in Canada to date. This plan was revealed while this report was in production and consequently this policy is not included in these projections.
While this significant policy is not included in this report, a baseline outlook is an important part of having an informed energy dialogue. The projections in Update 2016 suggest that energy use, including energy derived from fossil fuels, increases but at a slower pace compared to our January 2016 projections, and much slower than the last 25 years. Crude oil production continues to grow in the Reference Case but the oil price is a key uncertainty for future growth. Recent policies that target the electricity sector have a large impact, with even more growth in renewables than projected in our January report, and by 2040, coal-fired generation without carbon capture and storage technology accounts for a very small part of Canada’s electricity mix.
Canadians need up-to-date, unbiased and factual energy information to form their own opinions and make decisions affecting their own energy futures. The Board will continue to provide this through our Energy Futures series as well as our many other energy information publications. We are also committed to making our information more accessible and transparent for Canadians, and this is why I would also suggest users of this report visit our Explore Canada’s Energy Future visualizations, which provides an opportunity to interact with the large dataset behind these projections. In addition, the recent ratification of the Paris Agreement suggests that momentum globally and in Canada on climate change is increasing. As a result, the Board will update these projections in 2017 to reflect evolving climate policy frameworks in Canada.
Executive Summary
The National Energy Board (NEB or Board) released its latest long-term energy outlook, Canada’s Energy Future 2016: Energy Supply and Demand Projections to 2040 (EF 2016), in January 2016. This report, Canada’s Energy Future 2016: Update (Update 2016), takes into account new information since that analysis was completed and provides an updated perspective on Canada’s energy outlook.
It is important to note that the projections presented in Update 2016 are a baseline for discussing Canada’s energy future today and do not represent the NEB’s predictions of what will take place over the next 25 years. The projections are based on assumptions which allow for analysis of possible outcomes. Any assumptions made about current or future energy infrastructure or policy developments are strictly theoretical and have no bearing on the regulatory proceedings that are, or will be, before the Board.
Key Findings
The key findings of Update 2016 are outlined below and summarized in the following sections:
- Update 2016 includes several recently announced climate policies. Future climate action remains a key uncertainty to the projections.
- Energy use, including energy derived from fossil fuels, increases but at a slower pace compared to EF 2016.
- The crude oil price assumptions in Update 2016 are lower to reflect recent market developments, resulting in lower crude oil production projections.
- The electricity sector adds new wind, solar, hydro, and natural gas-fired generation to accommodate demand growth and replace coal-fired generation.
Key Finding 1: Update 2016 includes several recently announced climate policies. Future climate action remains a key uncertainty to the projections.
The last edition of Energy Futures was released in January 2016, a time of significant change from a climate policy perspective in Canada. Following the Paris climate agreement in late 2015, the particular nature of future federal and provincial climate actions was largely unknown.
The months prior to, and the year following, that agreement saw renewed ambition among federal and provincial governments to act on climate issues. Since then, numerous new climate policies and action plans have been announced. The inclusion of additional climate policies has important implications for the projections in Update 2016 as discussed throughout this report. Recently announced policies that are modelled include:
- Alberta’s carbon levy on end-users and large industrial emitters
- The accelerated phase-out of coal in Alberta
- Ontario’s economy-wide cap and trade program
Canada’s climate framework is still evolving. While some recently announced climate policies are included in the projections, many are not. Sufficient information is required to reliably factor new programs or policies into the economic and energy modelling underpinning this analysis. As these announced policies and action plans develop, they have potential to significantly impact the outcomes of upcoming editions of Energy Futures. Given that more than 80 per cent of Canada’s greenhouse gas (GHG) emissions are related to the consumption and production of energy, the details of policies not included in Update 2016, and of future climate policies, represent key uncertainties for the Canadian energy outlook.
The projections in Update 2016 do not model targets or goals, but rather the policies in place to achieve them. Canada’s target of reducing GHG emissions by 30 per cent from 2005 levels by 2030 is not explicitly modelled in this analysis.
Policies that were announced and implemented prior to September 2015, such as Quebec’s cap and trade system and the carbon tax in B.C., were included in EF 2016 and are also modelled in Update 2016.
Key Finding 2: Energy use, including energy derived from fossil fuels, increases but at a slower pace compared to EF 2016.
Total end-use energy consumption in the Reference Case increases by 13 per cent over the 25 year projection period, reaching nearly 13 000 petajoules (PJ) by 2040. The annual average growth rate of 0.5 per cent is considerably slower compared to the previous 25 years, when consumption increased by 1.3 per cent per year.
Relative to the Energy Futures Reference Case projection released in January 2016, energy use grows more slowly. By 2040, total consumption is nearly 900 PJ, or almost seven per cent lower in Update 2016. The inclusion of recently announced climate policies, lower crude oil production projections, and somewhat slower economic growth are key drivers of this change.
Fossil fuel use in Canada also grows over the projection period. Including energy used to generate electricity; fossil fuel energy use increases from just over 10 000 PJ in 2015 to about 11 300 PJ in 2040, or an average increase of 0.5 per cent per year. While fossil fuel use increases, the mix of fuels becomes less GHG-intensive, as the share of coal consumption decreases. Compared to EF 2016, fossil fuel consumption is 11 per cent, or almost 1 300 PJ lower by 2040 in Update 2016.
Figure ES.1 - Total Demand for Fossil Fuels, Reference Case

The results of Update 2016 imply that energy-related GHG emissions increase over the projection period. It is likely that additional actions beyond those included in Update 2016 are required for Canada to achieve its international targets related to climate change. Upcoming Energy Futures editions could contain considerably different fossil fuel consumption projections as additional details about announced policies and action plans become available.
Key Finding 3: The crude oil price assumptions in Update 2016 are lower to reflect recent market developments, resulting in lower crude oil production projections.
The price of crude oil is a key driver of the Canadian energy system. The Reference Case price assumptions in Update 2016 are lower compared to EF 2016, reflecting updated perspectives on global crude oil supply and demand trends.
The Reference Case Brent crude oil price increases from US$45 per barrel (bbl) in 2016 to US$68/bbl in 2020 in inflation adjusted terms. After 2020, the price gradually rises to US$90/bbl by 2040. The Reference Case crude oil price assumption is US$17/bbl lower than in EF 2016 by 2040.
In the Reference Case, Canadian crude oil production increases from 639 thousand cubic metres per day (103m3/d), or four million barrels per day (4.0 MMb/d) in 2015 to 900 103m3/d (5.7 MMb/d) in 2040, a 41 per cent increase. This increase is driven primarily by a 72 per cent increase in oil sands production, which reaches 691 103m3/d (4.3 MMb/d) by 2040, up from 402 103m3/d (2.5 MMb/d) in 2015. Total crude oil production increases less quickly than in EF 2016, largely due to lower price assumptions, with total production 62 103m3/d, or 391 thousand barrels per day (Mb/d) lower by 2040.
Figure ES.2 – Crude Oil Price Assumptions and Total Oil Production, Reference, High and Low Price Cases
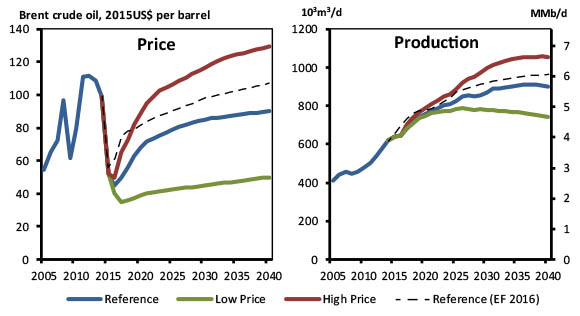
The Canadian crude oil production projections vary significantly depending on crude oil price assumptions. The global price is determined by supply and demand for oil, driven by factors like economic growth, technological developments, and geopolitics. Factors like domestic climate policies, such as those recently implemented in Alberta, and access to pipeline infrastructure can impact Canadian production. However, the results of the High and Low Price Cases suggest that global supply and demand drivers will likely be the most important determinant of future Canadian oil production.
Key Finding 4: The electricity sector adds new wind, solar, hydro, and natural gas-fired generation to accommodate demand growth and replace coal-fired generation.
Canada benefits from a very low carbon electricity system. Over 80 per cent of electricity generated in 2015 was derived from non-fossil fuel sources, the majority of which was hydroelectric power. While hydro generation continues to be the dominant source of electricity in Canada, the declining cost of renewables and increasing regulations on coal-fired generation continue to reduce the GHG intensity of the electricity system over the projection period.
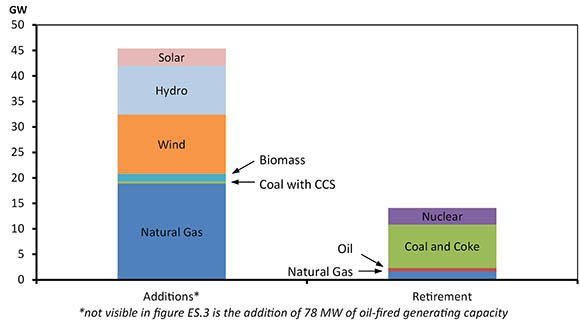
Electricity generated from coal, a GHG-intensive power source, drops to 10 per cent of current levels by 2040. Federal regulations result in the retirement of many coal facilities and this trend is accelerated by the planned phase-out of coal in Alberta by 2030. More than one third of the all coal consumed in Canada in 2040 is used by facilities in Saskatchewan that are enabled with carbon capture and storage (CCS) technology. In total, coal-fired generating capacity declines to 1.8 gigawatts (GW) by 2040, over eight GW less than in 2015.
To replace declining coal generation and accommodate new electricity demand growth, considerable natural gas, wind, solar, biomass, and hydro capacity is added over the projection period. Hydroelectric capacity increases by nine GW, or 12 per cent from 2015 to 2040. Combined, wind, solar, and biomass capacity more than doubles over the projection period, adding 17 GW of generating capacity by 2040. Natural gas is increasingly used as a baseload power source, particularly in Alberta and Saskatchewan, with net capacity increasing by 17 GW from 2015 to 2040.
Figure ES.3 - Generating Capacity Additions and Retirements by 2040, Reference Case
Foreword
The National Energy Board is an independent federal, quasi-judicial regulator that promotes safety and security, environmental protection, and economic efficiency in the Canadian public interest within the mandate set by Parliament for the regulation of pipelines, energy development, and trade.
The Board's main responsibilities of the NEB are established in the National Energy Board Act (the NEB Act) and include regulating:
- the construction, operation and abandonment of oil and gas pipelines that cross international borders or provincial/territorial boundaries, as well as the associated pipeline tolls and tariffs;
- the construction and operation of international power lines, and designated interprovincial power lines; and
- imports of natural gas, and exports of crude oil, natural gas, oil, natural gas liquids (NGLs), refined petroleum products and electricity.
Additionally, in specified areas, the Board has regulatory responsibilities for oil and gas exploration and production activities under the NEB Act, Canada Oil and Gas Operations Act (COGOA), the Canada Petroleum Resources Act (CPRA), and the North West Territories’ Oil and Gas Operations Act (OGOA) and Petroleum Resources Act (PRA). For oil and natural gas exports, the Board’s role is to evaluate whether the oil and natural gas proposed to be exported is surplus to reasonably foreseeable Canadian requirements, having regard to the trends in the discovery of oil or gas in Canada. The Board monitors energy markets, and assesses Canadian energy requirements and trends of oil and natural gas discovery to support its responsibilities under Part VI of the NEB Act. The Board periodically publishes assessments of Canadian energy supply, demand, and markets in support of its ongoing market monitoring. These assessments address various aspects of energy markets in Canada. This report, Canada’s Energy Future 2016: Update (Update 2016) is one such assessment that projects long-term Canadian energy supply and demand trends.
This report does not provide an indication about whether any application will be approved or not. The Board will decide on specific applications based on the material in evidence before it at that time.
Comments or questions on this report can be directed to: energyfutures@cer-rec.gc.ca.
If a party wishes to rely on material from this report in any regulatory proceeding before the NEB, it may submit the material, just as it may submit any public document. Under these circumstances, the submitting party in effect adopts the material and that party could be required to answer questions pertaining to the material.
EF 2016 was prepared by National Energy Board technical staff under the Direction of Abha Bhargava, Director, Energy Integration; Bryce van Sluys (bryce.vansluys@cer-rec.gc.ca, 403-299-3711), Project Manager - Energy Futures.
Specific questions about the information in this report may be directed to:
Michael Nadew (michael.nadew@cer-rec.gc.ca)
Chris Doleman (chris.doleman@cer-rec.gc.ca)
Chapter 1: Introduction
- Canada’s Energy Future 2016: Energy Supply and Demand Projections to 2040 was released in January 2016Footnote 1. The report examined how possible energy futures might unfold for Canadians up to the year 2040.
- The findings in EF 2016 were based on inputs, assumptions, and policies and programs in place at the time of the analysis, which was summer 2015. The period during and following that analysis was characterized by considerable uncertainty and volatility in domestic and global energy markets.
- This report, Canada’s Energy Future 2016: Update builds upon the analysis in EF 2016. The crude oil and natural gas price assumptions were decreased to reflect recent trends. The federal and many provincial governments made several major climate policy announcements since the completion of EF 2016 analysis. These new policies have been included to the extent possible.
- Update 2016 considers three cases:
- The Reference Case, based on a current macroeconomic outlook and a moderate view of energy prices.
- The High and Low Price Cases, which address uncertainties related to future crude oil and natural gas prices.
- As noted in Chapter 3, the cases are based on certain key assumptions including that over the long term, all energy production will find markets and infrastructure will be built as needed.
- While developing this report the NEB sought input from various energy experts and stakeholders to gather input and feedback on the preliminary projections. The Board would like to thank all participants for their contributions to Update 2016.
- Over the projection period, it is likely that developments beyond the realm of normal expectations, such as geopolitical events or technological breakthroughs, will occur. Likewise, new information becomes available and trends, policies, and technology evolve. Readers of this analysis should consider the projections a baseline for discussing Canada’s energy future today, not a prediction of what will take place.
Chapter 2: Recent Developments and Key Assumptions
The Canadian energy system is constantly changing. Factors like technology, economics, infrastructure, societal preferences, and government policy and programs continually influence how energy is produced, transported, and consumed in Canada. This section discusses what significant changes occurred since the EF 2016 analysis was completed in summer 2015.
Crude Oil Prices
- Crude oil prices are a key driver of the Canadian energy system. Canada is a major crude oil producer and prices are an important driver of future production growth. The price of refined petroleum products, such as gasoline and diesel, are closely related to crude oil prices and can influence energy use.
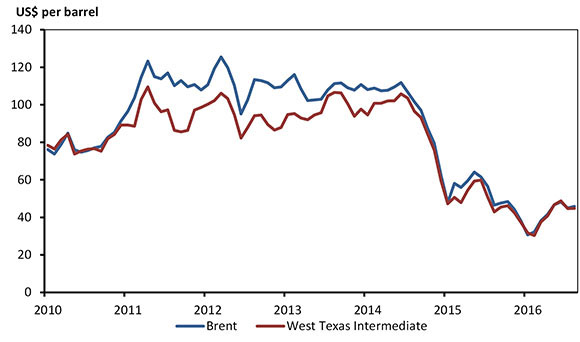
- From 2011 to mid-2014, global crude oil prices were relatively stable near US$100/bbl. Prices dropped steadily starting in mid-2014, with the Brent crude oil price falling to US$50/bbl by January 2015, and to less than US$30/bbl in January 2016. In spring 2016 the Brent crude price began to increase, nearing US$50/bbl by summer. Figure 2.1 shows the prices for Brent and West Texas Intermediate (WTI) from 2010 to mid-2016. Further information on factors driving the recent crude oil price decline is available in the “Crude Oil Price Trends” section of Chapter 2 in EF 2016Footnote 2.
Figure 2.1 - Global Crude Oil Prices
- Figure 2.2 depicts the Brent crude oil price assumptions of Update 2016. The updated Reference Case price, in constant 2015 dollar terms, is roughly US$17/bbl lower in the longer term compared to the EF 2016 assumptions, reaching US$90/bbl by 2040.
Figure 2.2 - Brent Crude Oil Price, Reference, High and Low Price Cases
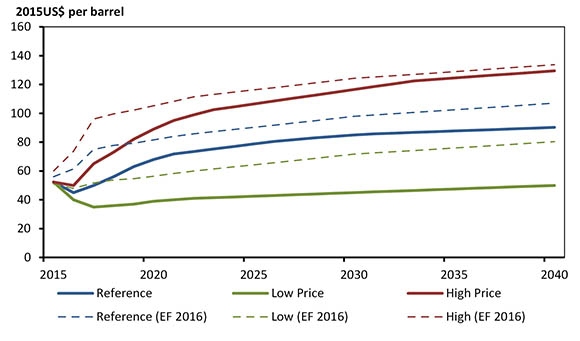
- The High Price and Low Price Case assumptions in Update 2016 cover a wider range than in EF 2016, roughly 45 per cent above and below the Reference Case by 2040. This wider range reflects price volatility over the past two years and greater uncertainty in price expectations going forward.
- Western Canadian Select (WCS), a benchmark price for Canadian heavy oil, represents the approximate value Canadian heavy oil and oil sands producers receive for their non-upgraded production. The difference between WCS and WTI is due primarily to their different physical properties and the cost to transport the marginal barrel of Canadian heavy oil to the U.S. Gulf Coast crude oil refining center. Crude oil can be moved by either pipeline or rail; the cost of rail transportation is generally more expensive.
- All cases assume that the differential between WTI and WCS widens by an additional US$6/bbl between 2018 and 2020 based on rail, rather than pipelines, providing incremental takeaway capacity over that period. After 2020 the differential returns to normal levels as this analysis assumes that, over the long term, infrastructure is built as needed. However, this assumption is a key uncertainty to the projections. Chapter 10 in EF 2016Footnote 3 provides a full analysis of the pricing dynamics described here and the longer-term implications of continued constrained pipeline capacity over time.
Natural Gas Prices
- Natural gas prices have declined considerably over the past decade. Henry Hub prices fell from the US$6-9 per million British thermal units (MMBtu) range between 2006 and 2008 to less than US$4/MMBtu for the majority of the last five years. For much of the first half of 2016, Henry Hub prices were near US$2/MMBtu.
- Over the past several years many analysts have steadily reduced their long-term expectations for North American natural gas prices. Largely driven by continued improvements in drilling and completion technology, North American natural gas production has significantly increased, creating downward pressure on prices. Further discussion of these technology improvements are found in the “Oil and Natural Gas Production from Shale and Tight Resources” section in Chapter 2 of EF 2016Footnote 4.
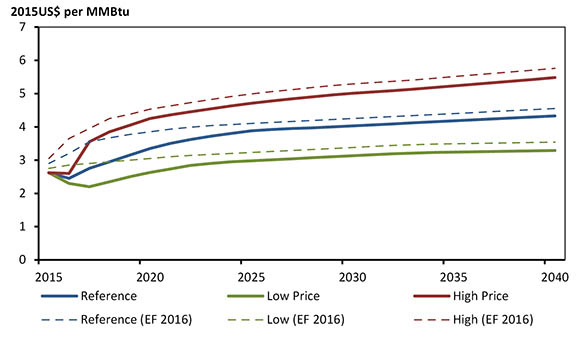
- Figure 2.3 depicts the Henry Hub natural gas price assumptions. In all cases, prices are roughly five per cent lower than EF 2016 in the long term. The Reference Case assumes that the Henry Hub price for natural gas increases from US$2.45/MMBtu in 2016 to US$4.30/MMBtu in 2040 in 2015 dollars.
Figure 2.3 - Henry Hub Natural Gas Price, Reference, High and Low Price Cases
Climate Policy Developments
- Discussion in EF 2016 highlighted numerous uncertainties surrounding the energy projections in that report. Future climate policies were chief among them. At the time of the analysis, the Paris Climate Change Conference had not taken place and the details of new, ambitious federal and provincial climate initiatives were limited or unknown.
- Many major climate policies were announced over the past year. The projections in Update 2016 include as many of these new policies as possible. However, several announced plans have not reached the stage where final regulations to implement the policies are available. The following criteria were applied to determine whether a certain policy was included in Update 2016:
- Sufficient detail is available to allow modeling of the policy. When necessary, provincial governments were consulted to obtain clarification on certain details.
- The policy is unlikely to undergo substantial changes before it is implemented.
- Goals and targets, including Canada’s international climate targets, are not explicitly modelled. Rather, the policies currently in place to meet those targets are included.
- Table A.1, found at the end of this document, describes many recent climate policy developments and whether that policy is included in the Update 2016 analysis. Policies already implemented as of summer 2015, such as Quebec’s cap and trade system and British Columbia’s (B.C.) carbon tax, are not included in the table but are still incorporated in the projections.
- As discussed in this report, additional policy action beyond those included in Update 2016 are likely required for Canada to achieve its international targets related to climate change. Climate policy in Canada continues to evolve and the nature of future policies remains a key uncertainty to the projections in Update 2016.
Chapter 3: Results
Overview
- Analysis in this chapter focuses primarily on the key results of Update 2016 and how those results differ from the projections in EF 2016. Refer to the discussion in EF 2016 for a more thorough analysis of long-term energy supply and demand trends.
- Update 2016 includes three cases: the Reference, High Price and Low Price Cases.
- Three key assumptions underpin these cases:
- Over the long term, all energy production will find markets and infrastructure will be built as needed.
- Environmental and socio-economic considerations beyond the included policies and programs are outside the scope of the analysis.
- Energy markets are constantly evolving. Update 2016 is based on the best available information at the time of the analysis.
- A key assumption in past Energy Futures editions was that only policies and programs that were law at the time of analysis were included in the projections. However, many recently announced climate policies have not yet become law but will have major implications for the Canadian energy system. Some of these announced, but not fully implemented, policies are included in Update 2016. Refer to Table A.1 at the end of this document for a detailed description of recently announced policies.
- Detailed data tables supporting the discussion in this Chapter are available in the online Data Appendices.
Macroeconomic Drivers
- The economy is a key driver of the energy system. Economic growth, industrial output, inflation, exchange rates, and population growth all influence the Canadian energy system.
- The long-term outlook for economic growth in the Reference Case is slightly slower compared to EF 2016, as shown in Table 3.1. This is largely a result of lower crude oil production and somewhat lower expectations for industries like fertilizer production, forestry, and construction.
| Economic Indicator | Compound Average Annual Growth Rate - 2015 to 2040 | |
|---|---|---|
| Update 2016 | EF 2016 | |
| Real Gross Domestic Product | 1.6% | 1.7% |
| Population | 0.7% | 0.8% |
| Inflation | 2.0% | 1.8% |
- Regionally, economic growth in the Reference Case is fastest in B.C. and Alberta, averaging 1.7 per cent per year from 2015 to 2040. The investment associated with liquefied natural gas (LNG) exports and steady growth in oil sands production results in above average economic activity. Combined, Quebec and Ontario’s annual economic growth averages 1.6 per cent over the projection period. Growth is slowest in Atlantic Canada because of slower population growth and declining offshore oil and natural gas production in the long term.
Energy Demand
- This section focuses mainly on end-use, or secondary energy demand. This includes energy used in four sectors: residential, commercial, industrial, and transportation. Secondary demand excludes energy used to generate electricity, which is accounted for in primary demand.
- Figure 3.1 shows that energy use increased by 1.3 per cent per year from 1990 to 2014. In the projection period, energy use increases more slowly, at an average rate of 0.5 per cent per year. This is a slightly lower rate of growth compared to EF 2016, which was 0.6 per cent per year from 2015 to 2040. In the Update 2016 Reference Case, total end-use energy consumption increases to 12 973 PJ by 2040; 6.5 per cent, or 895 PJ less than in EF 2016.
Figure 3.1 - Historical and Projected Growth in End-Use Energy Demand by Sector, Reference Case
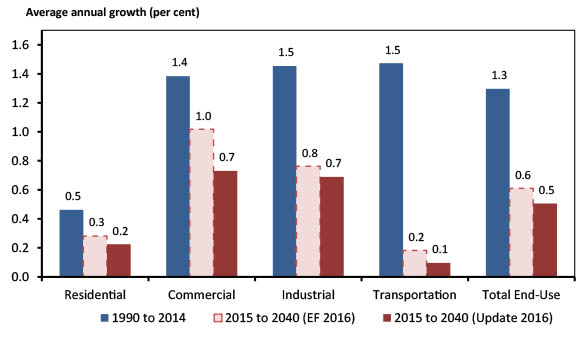
- Figure 3.1 demonstrates end-use energy demand growth by sector. Consumption growth in all sectors slows compared to its historical pace and compared to projections in EF 2016.
- The industrial sector is one of the fastest growing sectors, increasing at an average of 0.7 per cent per year over the projection period, reaching 6 918 PJ by 2040 in the Reference Case. Growth is driven mainly by energy use associated with growing oil sands and natural gas production, as well as moderate increases in manufacturing activity.
- Transportation energy use grows the least and is essentially flat over the projection period, growing at an average of 0.1 per cent per year. On-road passenger energy use declines steadily over the projection, as federal efficiency standards, carbon pricing in several large provinces, and slower population growth all act to reverse a long-term trend of increasing passenger transportation energy use. This is offset by continued increases in freight transportation demand, driven by growth in goods-producing industries and increasing demand for consumer goods.
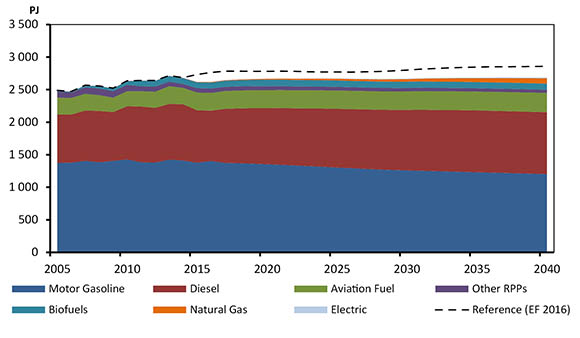
- Figure 3.2 shows transportation energy demand by fuel. Gasoline demand falls at an annual average of 0.5 per cent over the projection in line with declining passenger energy use. Diesel consumption increases steadily as it is the primary fuel in the freight sector. Emerging vehicle technologies, such as electric vehicles and LNG-powered freight vehicles, gain market share but do not significantly impact the overall fuel demand mix. Total transportation demand is notably lower in Update 2016 relative to EF 2016 as recently available data suggests diesel consumption decreased in 2015, largely due the economic slowdown in Alberta.
Figure 3.2 - Transportation Energy Demand by Fuel, Reference Case
- Household energy use grows at an average rate of 0.2 per cent per year from 2015 to 2040, reaching 1 610 PJ by 2040. Slower growth in new home construction and efficiency improvements result in lower growth relative to the historical period. Commercial energy demand grows at 0.7 per cent per year, exhibiting the largest decrease in growth rate relative to the EF 2016 projections. This is largely driven by a slower economic outlook for industries like retail sales, office buildings, and public services.
Figure 3.3 - Projected Growth in End-Use Energy Demand, Reference, High and Low Price Cases
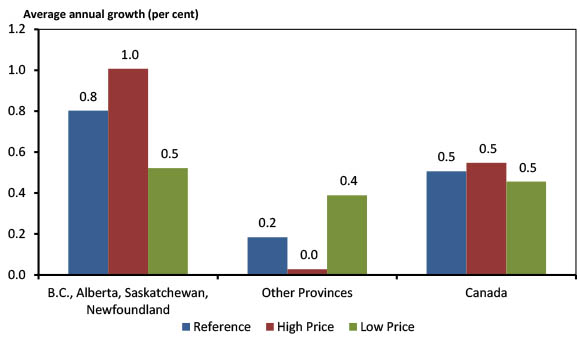
- The impact of higher or lower prices on energy demand varies by province. Figure 3.3 shows that energy use grows more quickly in the High Price Case in Alberta, B.C., Saskatchewan and Newfoundland and Labrador. Those provinces produce significant quantities of oil and natural gas, which can be energy-intensive processes. Growth is slower in the remaining provinces as higher prices reduce demand for natural gas and refined petroleum products, which are linked to the price of crude oil. This dynamic is reversed in the Low Price Case, with oil and natural gas producing provinces growing slower due to less oil and natural gas production growth. For all of Canada, demand growth is similar in all three cases.
- Total energy intensity, measured as energy use per unit of economic activity, decreases by an average annual rate of 1.1 per cent in the Reference Case projection. Energy intensity improves more quickly than projected in EF 2016, a result of lower activity in some energy-intensive industries and the inclusion of new climate policies.
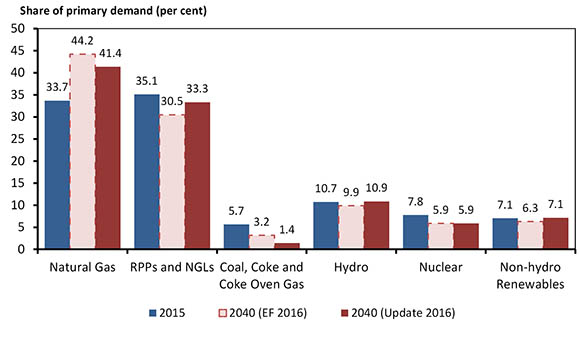
- Primary energy demand, which includes energy used to generate electricity but excludes end-use electricity consumption, increases at an average annual rate of 0.4 per cent over the projection period, reaching 14 917 PJ in 2040. As shown in Figure 3.4, the share of natural gas increases the most, driven by growth of demand for power generation and in the oil sands. Coal’s share of primary demand falls considerably, mostly due to declining coal-fired power generation.
Figure 3.4 - Share of Fuel in Primary Energy Demand, Reference Case
Crude Oil
- By 2040 Canadian crude oil production in the Reference Case reaches 900 103m3/d
(5.7 MMb/d), 41 per cent higher than 2015 levels of 639 103m3/d (4.0 MMb/d)Footnote a. Figure 3.5 shows crude oil production by type in the Reference Case.
Figure 3.5 - Total Canadian Crude Oil and Equivalent Production, Reference Case

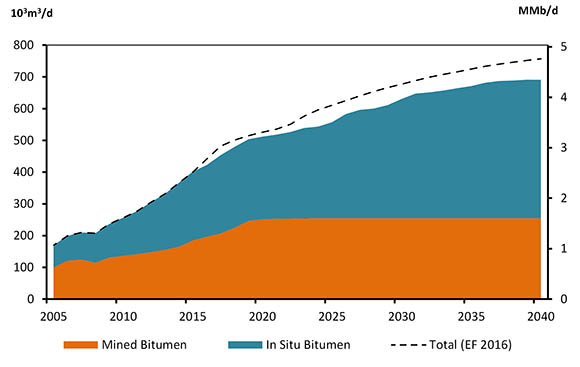
- In 2015, oil sands production made up more than half of Canada’s oil production. Despite the steep decline in crude oil prices since mid-2014, recently completed oil sand projects, as well as those under currently construction, contribute to steady production growth in the first five years of the projection. As shown in Figure 3.6, the Alberta wildfires impacted production in 2016 but they do not have a significant impact thereafter. In the Reference Case, total oil sands production reaches 691 103m3/d (4.3 MMb/d), a 72 per cent increase from 2015 levels of 402 103m3/d (2.5 MMb/d).
Figure 3.6 - Oil Sands Production, Reference Case
- Recent in situ oil sands project deferrals and cancellations result in slower production growth between 2019 and 2022 in the Reference Case. As prices increase gradually, in situ oil sands projects become more economic and production increases steadily, reaching 436 103m3/d (2.7 MMb/d) by 2040, more than doubling from 2015 levels. Lower price assumptions are the primary driver of lower in situ bitumen production compared to EF 2016, with production 13 per cent lower by the end of the projection.
- Mined bitumen production increases robustly from 2017 to 2020, as facilities currently under construction come online. After 2020, production remains steady as the price and investment climate make large scale mining projects less economic. Mined production reaches 255 103m3/d (1.6 MMb/d) by 2024, an increase of 38 per cent from the 2015 level of 185 103m3/d (1.2 MMb/d), and stays relatively flat thereafter. The mined bitumen projections in Update 2016 are similar to the projections in EF 2016.
- Natural gas is the primary fuel used for oil sands extraction. A key measure of the energy efficiency of thermal oil sands production, which includes cyclic steam stimulation (CSS) and steam assisted gravity drainage (SAGD), is the steam to oil ratio (SOR). As shown in Figure 3.7, the average SOR for thermal production declined by 1.7 per cent per year from 2010 to 2015. This decline was the result of efficiency gains from process improvements and the introduction of new technologies.
Figure 3.7 - Annual Average Production-Weighted SOR Improvements of Thermal Oil Sands Production, Reference, High and Low Price Cases

- Figure 3.7 also indicates that this rate of improvement continues over the next decade. Many of the projects coming online in this timeframe add production from high quality oil sands reservoirs, which generally have lower SORs. Over the longer term, average annual SOR improvements slow as new oil sands projects move to areas where steam requirements can often be higher. In addition, oil sands reservoirs become less efficient as they produce more oil, which has an upward effect on SORs.
- Improvements in SORs vary in the price cases as the rate of future production growth impacts both the quality of the reservoirs being brought online and the extent to which existing projects reach a point of increasing SORs. In the High Price Case, overall intensity improvements are somewhat lower as lower quality reservoirs are developed while the opposite occurs in the Low Price Case as fewer new projects with lower quality reservoirs are built.
- Conventional light oil production, most of which occurs in Alberta and Saskatchewan, is relatively flat until 2019 due to low prices. As prices gradually increase, production begins to rise, with western Canadian conventional production reaching 106 103m3/d (664 Mb/d) in 2027. Later in the projection, light oil production begins to decline slowly, as productivity rates from new wells start to decline.
- Production of conventional heavy oil increases slightly in the short term, driven by the application of enhanced oil recovery techniques such as carbon dioxide (CO2) and water flooding. This growth slows and by 2024, conventional heavy oil production in western Canada begins to decline, reaching 73 103m3/d (462 Mb/d) by 2040.
- In the Reference Case, Newfoundland and Labrador offshore production increases steadily over the next five years as the Hebron project comes online and Hibernia adds new production from satellite fields. After peaking at 51.6 103m3/d (325 Mb/d) by 2022, production begins to enter natural decline. The Reference Case assumes production from a generic offshore discovery adds new production in 2030 before returning to a declining trend towards the end of the projection.
Figure 3.8 - Total Canadian Oil Production, Reference, High and Low Price Cases
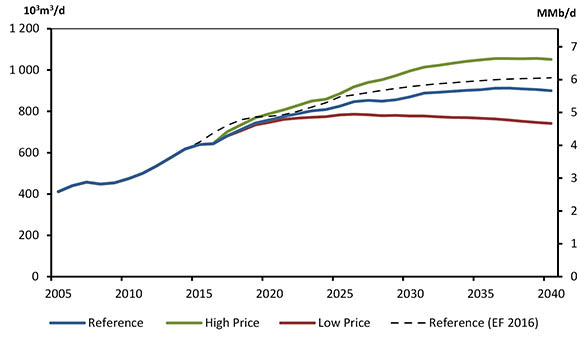
- As shown in Figure 3.8, the Reference Case projects total oil production will reach 900 103m3/d (5.7 MMb/d). In the High Price Case, production reaches 1 052 10³m³/d (6.6 MMb/d), 17 per cent higher than the Reference Case by 2040. Production in the Low Price Case is 18 per cent lower than the Reference Case by 2040, at 741 103m3/d (4.7 MMb/d).
Natural Gas
- After increasing steadily from 2012 to 2015, Canadian marketable natural gas production in the Reference Case begins to decline slowly, decreasing from 438 million cubic metres per day (106m3/d), or 15.4 billion cubic feet per day (Bcf/d) in 2016 to 421 106m3/d (14.8 Bcf/d) in 2020 as prices are not sufficient to warrant enough drilling to maintain production levels. All three cases assume LNG exports from the B.C. Coast start in 2021 and increase by 14 106m3/d (0.5 Bcf/d) per year to reach 71 106m3/d (2.5 Bcf/d) by 2025. In the Reference Case the onset of these exports reverses the declining trend, with production reaching 489 106m3/d (17.3 Bcf/d) by 2026, as shown in Figure 3.9. Higher prices encourage steady growth after 2026, with production reaching 502 106m3/d (17.7 Bcf/d) by 2040, 18 per cent higher than 2015 levels.
Figure 3.9 - Natural Gas Production by Type, Reference Case
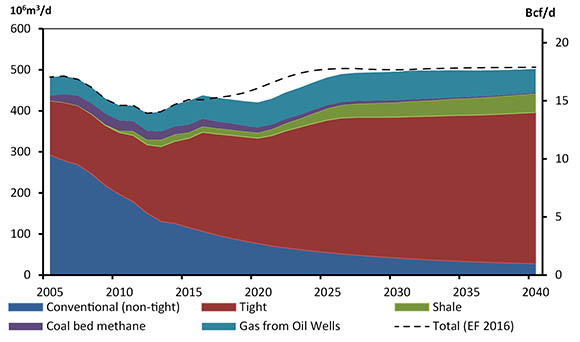
- Total Canadian production is slightly lower in Update 2016 relative to EF 2016 throughout much of the projection period. This is a result of a later start date for LNG exports and a slightly lower price outlook. This is largely offset in the longer term by higher productivity improvements in some key producing regions. As a result, production in the Reference Case is less than one per cent lower in Update 2016 compared to EF 2016 by 2040.
- Natural gas production in Alberta declines slightly over the first five years of the projection period as prices are too low to encourage enough drilling to outpace production declines from existing wells. As prices gradually rise, production in Alberta begins to steadily increase, reaching 286 103m3/d (10.1 Bcf/d) by 2040, 2.3 per cent higher than 2015 levels. Relative to EF 2016, production in Alberta is somewhat higher over the projection period due to higher production from emerging plays, namely the Duvernay Shale.
- B.C. production grows considerably from 2020 to 2026 with the onset of LNG exports. Production is relatively flat after 2026 and production reaches 210 106m3/d (7.4 Bcf/d) by 2040. Reference Case production in B.C. is slightly lower than in EF 2016 due to the delayed onset of assumed LNG exports. Chapter 11 of EF 2016 provides additional context and analysis of higher or lower LNG exports on Canadian natural gas production.
- Production from other provinces, including Saskatchewan, Nova Scotia, New Brunswick and the Territories, declines steadily over the projection period as new natural gas drilling activity is focused in Alberta and B.C.
Figure 3.10 - Total Canadian Marketable Natural Gas Production, Reference, High and Low Price Cases
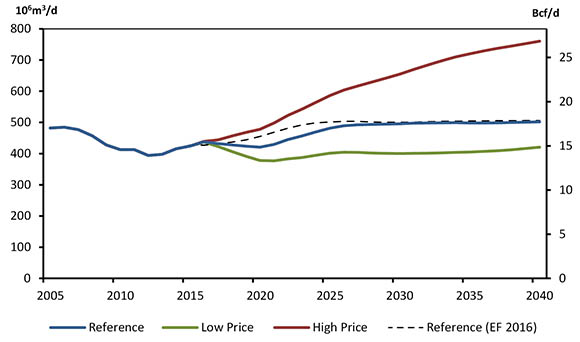
- As shown in Figure 3.10, Canadian marketable natural gas production in the High Price Case averages 761 106m3/d (26.8 Bcf/d) in 2040, or 52 per cent higher than the Reference Case. Western Canada’s significant resource base, coupled with higher prices, encourages more drilling activity throughout the projection period. Canadian production in the Low Price Case declines until 2021 when assumed LNG exports reverse this trend. After 2025, production is relatively flat, reaching 421 106m3/d (14.8 Bcf/d) by 2040, 16 per cent lower than the Reference Case.
- Natural gas liquids (NGLs), which include ethane, propane, butanes, and pentanes plus, are found in raw natural gas in varying proportions and are mostly extracted at natural gas processing facilities. NGLs are also produced as a by-product of oil refining or bitumen upgrading. As shown in Figure 3.11, combined NGL production increases steadily over the projection period, from 126 103m3/d (790 Mb/d) in 2015 to 145 103m3/d (911 Mb/d) in 2040.
Figure 3.11 - Natural Gas Liquids Production, Reference Case
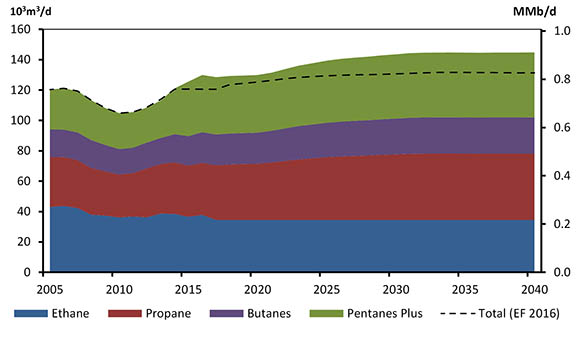
- Ethane production is relatively flat over the projection period, limited by the capacity of existing ethane petrochemical facilities. Propane, butanes, and pentanes plus production increases as most new natural gas drilling activity is centered in NGL-rich areas in Alberta and B.C. Compared to the projections in EF 2016, total NGL production is 10 per cent higher by 2040. This increase is the result of more gas being produced along with crude oil and tight gas production, both of which tend to contain more NGLs than other types of gas production.
Electricity
- In the Reference Case, electric generating capacity increases by almost 32 GW from 2015 to 2040, increasing total installed capacity to 177 GW. Installations of new capacity over the projection period total 46 GW, the majority of which is hydro, natural gas and non-hydro renewable facilities. Capacity retirements total 14 GW from 2015 to 2040, mostly coal plants, driven by existing federal coal regulations and Alberta’s planned coal phase-out. Ontario will refurbish much of its existing nuclear capacity between 2019 and 2034 and the Pickering plant retires in the early 2020s.
- The capacity additions and retirements over the projection period drive changes to the electricity fuel mix. As shown in Figure 3.12, the share of non-hydro renewable resources and natural gas increase substantially. Installed capacities of both resources grow significantly in Alberta where the phase-out of coal by 2030 requires considerable capacity replacement.
Figure 3.12 - Capacity Mix by Primary Fuel, 2015 and 2040, Reference Case

- Coal’s share of the generating mix decreases from seven per cent in 2015 to one per cent in 2040. More than one third of all coal consumed in Canada in 2040 is used by facilities in Saskatchewan that are enabled with CCS technology. The shares of nuclear and hydro capacity decline as their total capacities stay relatively constant while total capacity increases.
Figure 3.13 – Non-hydro Renewable Capacity, Reference Case
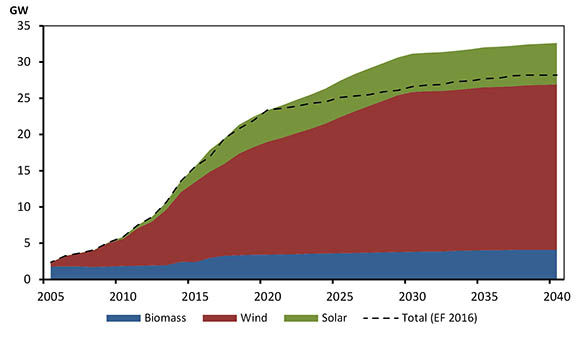
- Non-hydro renewable capacity more than doubles over the projection period, from nearly 16 GW in 2015 to 33 GW in 2040, as shown in Figure 3.13. The growth of these resources in Update 2016 is similar to EF 2016 up to 2020. After 2020, non-hydro renewable capacity in Update 2016 grows faster, and is 16 per cent higher than EF 2016 by 2040. This is primarily due to new policy initiatives and announced capacity expansions.
- Total electricity generation in Canada increases at 0.6 per cent per year, from 653 TW.h in 2015 to 755 TW.h in 2040. Figure 3.14 shows electricity generation by fuel. Relative to EF 2016, total generation is five per cent lower in 2040, due to slower electricity demand growth. Generation from coal, hydro and natural gas are lower in Update 2016 while wind and solar generation are greater.
Figure 3.14 – Generation by Fuel, Reference Case

Greenhouse Gas Emissions
- Currently, energy use and GHG emissions in Canada are closely related. The majority of GHGs emitted in Canada are a result of fossil fuel combustion. Fossil fuels include crude oil, natural gas, coal, and refined petroleum products such as gasoline and diesel. In 2015, they provided the vast majority of energy used to heat homes and businesses, transport goods and people, and power industrial equipment. Emissions from fossil fuels, including those used for the production of energy, accounted for 81 per cent of Canadian GHG emissions in 2014Footnote 5. The remaining emissions are from non-energy sources such as agricultural and industrial processes, and waste handling.
- Environment and Climate Change Canada (ECCC) publishes Canada’s official GHG projections in its Canada’s Emission Trends reportFootnote 6 and in Canada’s Biennial Report to the United Nations Framework Convention on Climate ChangeFootnote 7.
- The amount of GHGs emitted by various fossil fuels depends on the emission content of the fuel and how efficiently the fuel is used. Not all fossil fuels produce the same amount of GHG emissions when converted to energy. For example, natural gas emits slightly more than half the GHGs emitted by coal to produce the same amount of energy. As a result, the outlook for energy-related GHG emissions depends on fossil fuel consumption trends as well as the mix of fuels used.
- The Reference Case projection for total fossil fuel consumption is shown in Figure 3.15. From 2015 to 2040, the use of fossil fuel energy increases by 13 per cent, an average rate of 0.5 per cent per year.
Figure 3.15 - Total Demand for Fossil Fuels, Reference Case
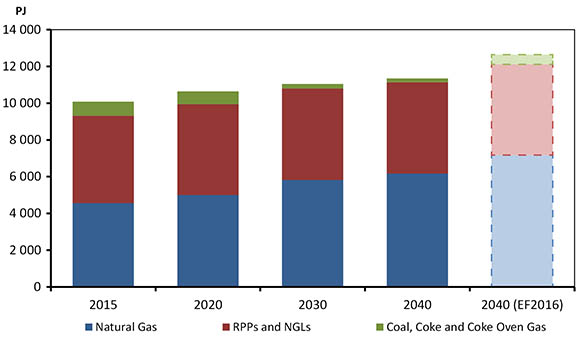
- Compared to EF 2016, consumption of fossil fuels is lower throughout the projection period, and is 11 per cent lower by 2040. The introduction of carbon pricing policies in Alberta and Ontario is a factor in this trend. This impact is tempered, however, by lower crude oil and natural gas price assumptions in Update 2016, making those fuels relatively less expensive than in EF 2016.
- While fossil fuel consumption does grow over the projection, a changing fuel mix leads to declining fossil fuel GHG intensity, as shown in Figure 3.17. A greater share of natural gas, the least GHG-intensive fossil fuel, and a declining share of coal, a more GHG-intensive fuel, drives this trend. The GHG intensity of the fossil fuel mix declines by seven per cent from 2015 to 2040, slightly more than in EF 2016. This is primarily due to lower coal consumption in Update 2016.
Figure 3.16 - Estimated Weighted-Average Fossil Fuel Emission Intensity, Reference Case

- Relative to EF 2016, fossil fuel consumption growth is lower and the GHG intensity of the fuel mix declines slightly faster. Given Canada’s complex and diverse energy system, many factors contribute to this shift, including revised projections for economic growth and energy production. However, the inclusion of new climate policies in the Update 2016 projection plays a key role in these changing trends.
- The growth in fossil fuel consumption still outpaces the decline in GHG intensity of Canada’s fossil fuel consumption mix. This implies increasing energy-related GHG emissions.
- Several climate policies and plans have been announced recently but were not included in the Update 2016 projections, including the recently announced Pan-Canadian Approach to Pricing Carbon Pollution. The inclusion of these new polices could result in reduced fossil fuel consumption projections in upcoming Energy Future editions.
Key Uncertainties
- The results of Update 2016 imply that additional actions beyond those included in Update 2016 are required for Canada to achieve its international targets related to climate change. Federal and provincial governments continue to work on policy frameworks to reach their climate goals. Many of these frameworks are described in Table A.1 but insufficient details were available at the time of analysis to include them in Update 2016. As climate policy in Canada continues to evolve, the nature of future policies remain an uncertainty for the long-term energy outlook.
- Update 2016 includes modest growth of emerging technologies. However, technology’s influence on the energy system can be substantial and often difficult to predict. Speculating on whether or not technologies become game-changers due to sudden shifts in fundamental factors like costs and societal preferences, is beyond the scope of this analysis and represents a key uncertainty.
- This analysis assumes that over the long term, all energy production will find markets and infrastructure will be built as needed. However, projects to increase oil transportation capacity in North America have proven controversial. In addition, several proposed LNG export facilities aiming to access new markets for Canadian natural gas have been deferred or cancelled. Chapters 10 and 11 in EF 2016 provide additional analysis of the impact of these key uncertainties to the Canadian energy outlook.
- The High and Low Price Cases cover some of the uncertainty related to future crude oil and natural gas prices. However, the possibility of higher, lower or volatile prices is still an uncertainty to the projections.
- Economic conditions can significantly affect Canadian energy use patterns. The outlook for demand of Canadian goods exported internationally is uncertain and could impact the growth of many energy intensive industries such as manufacturing, mining, and oil and gas.
Appendices
Detailed data tables supporting the discussion in this Chapter are available in the online Data Appendices.
Table A.1 describes many recent climate policy developments and whether that policy is included in the analysis of Update 2016. Policies already implemented as of summer 2015, such as Quebec’s cap and trade system and the British Columbia’s (B.C.) carbon tax, are not included in the table but are still incorporated in the projections.
| Description | Details | Update 2016, Reference, High Price and Low Price Cases |
|---|---|---|
| Pan-Canadian framework for clean growth and climate change | The federal government is working with the provinces and territories to develop a pan-Canadian climate change framework with the goal of meeting or exceeding Canada’s international emission targetsFootnote 8. Discussions among the First Minsters in March led to the Vancouver DeclarationFootnote 9. In the Declaration, the Ministers agreed to a number of commitments, including increasing the level of ambition with respect to climate change and enhancing cooperation among provinces and territories. |
Specific details of the framework were not available at the time of analysis and are not included in Update 2016. |
| Pan-Canadian Approach to Pricing Carbon Pollution | As part of the Pan-Canadian framework, the federal government outlined its proposed approach to carbon pricing in Canada in October 2016Footnote 10. The approach sets a minimum price on carbon of $10 per tonne in 2018. The minimum price increases by $10 a year to reach $50 per tonne in 2022. Provinces and territories will have flexibility to either implement a direct price on carbon pollution or adopt a cap-and-trade system. Provinces and territories will have control of the revenue from carbon pricing and use the revenues as they see fit. |
The federal carbon pricing plan was announced after the analysis in Update 2016 was completed. How provinces will choose to structure their pricing policies is currently unknown. Update 2016 does not include a national price on carbon. |
| Canada-U.S. joint action to reduce methane emissions from the oil and gas sector | In March 2016 Canada and the U.S. announced joint action to reduce methane emissions from the oil and gas sector by 40 to 45 per cent below 2012 levels by 2025Footnote 11. The development of methane regulations is underway in both the U.S. and Canada. ECCC intends to publish an initial phase of proposed regulations by early 2017. |
The methane regulations were still under development at the time of analysis and are not included in Update 2016. |
| North American Climate, Clean Energy, and Environment Partnership Action Plan | In June 2016 Canada, the U.S., and Mexico announced a joint action plan that identifies initiatives and goals in key areas such as advancing clean and secure energy and driving down short-lived climate pollutantsFootnote 12. One key announcement was a goal for North America to achieve 50 per cent clean power generation by 2025. | Initiatives described in the action plan were under development at the time of analysis and are not included in Update 2016. The goal of 50 per cent clean power generation in North America is not explicitly modelled in Update 2016. |
| B.C. – Climate Leadership Plan | In August 2016, the B.C. government released its Climate Leadership PlanFootnote 13. The plan highlights 21 action items to reduce GHG emissions in key areas such as transportation, industry and utilities, and natural gas. | Many of the actions described in the B.C. Climate Leadership Plan were still under development at the time of analysis and are not included in Update 2016. Targets described in the plan are not explicitly modelled in Update 2016. B.C.’s carbon tax is included in Update 2016. |
| Alberta Climate Leadership Plan | In spring 2016, the Alberta government unveiled a climate change and emissions strategy based on recommendations put forth by the Climate Leadership Panel in fall 2015Footnote 14. The main elements of the Alberta Climate Leadership Plan are discussed below. | Several, but not all, elements of the Alberta Climate Leadership Plan are included in Update 2016 as described below. |
| Alberta - carbon pricing: end-use emissions |
In June 2016, the Alberta government passed legislation implementing an economy-wide carbon levy on GHG-emitting fuelsFootnote 15. Beginning in 2017, the levy will be set at $20/tonne and will increase to $30/tonne in 2018. The funds generated by the levy will be recycled back into the Alberta economy through direct payments to low- and middle-income families, small business tax reductions and investments in energy efficiency, technology and infrastructureFootnote 16. | The carbon levy is included and is set at $20/tonne in 2017, and increases to $30/tonne in 2018. The price stays at that level, in nominal terms, throughout the projection period. The carbon levy does not increase over time as recommended by the Climate Leadership Panel (as long as similar pricing exists in other jurisdictions). Future price increases are uncertain and are not included in Update 2016. |
| Alberta - carbon pricing: large industrial emitters | Alberta announced plans to replace its existing carbon pricing program for large industrial emitters, the Specified Gas Emitters Regulation, with a new program referred to as the Carbon Competitiveness Regulation by the Climate Leadership PanelFootnote 17. Large emitters would pay a carbon levy of $30/tonne starting in 2018 on their combustion emissions. The Climate Leadership Panel proposes a sector-specific output-based performance standard as a method to mitigate competitiveness impacts of carbon pricing on trade-exposed industrial sectorsFootnote 18. Under the performance standard Alberta firms would receive allocations, essentially free emission permits, on a per-unit-of-output basis. The allocations would equal the emissions per-unit-of-output of the top quartile in terms of emission intensity in a given industry. This approach provides firms with an incentive to reduce their emission intensity and a measure of protection for emission-intensive and trade-exposed industries. |
Pricing of industrial GHG emissions is included. The price is held at $30/tonne in nominal terms throughout the projection period. |
| Alberta - accelerated coal phase-out | Under existing federal regulations, existing coal-fired power plants are required to meet a strict performance standard or be retired once they reach the end of their useful lifeFootnote 19. The Alberta government has stated its plan to accelerate this transition, requiring no pollution from coal-fired electricity generation by 2030Footnote 20. Under existing federal regulations, 12 of Alberta’s 18 remaining coal-fired plants will be retired prior to 2030; the six remaining plants will also be phased out under the Alberta plan. The plan calls for replacing coal capacity with two thirds renewable capacity and one third natural gas-fired capacity. The Alberta government tasked the Alberta Electric System Operator with implementing a plan to bring new renewable generation capacity to market through a competitive processFootnote 21. The Alberta government also stated that by 2030, renewable sources will account for up to 30 per cent of electricity generation. |
An accelerated phase-out of coal-fired generation is included in Update 2016. The up to 30 per cent of electricity generation from renewables by 2030 goal is not explicitly modelled. |
| Alberta - 100 MT limit on oil sands emissions | The Alberta government is proposing a legislated limit of 100 MT on oil sands emissions, with provisions for cogeneration and new upgrading capacityFootnote 22. The province established the Oil Sands Advisory Group to consider, among other things, how to implement the emission limitFootnote 23. | Details on the implementation of the 100 MT limit at the time of analysis were limited and it is not included in Update 2016. |
| Alberta - reducing methane emissions | The Alberta government plans to reduce methane emissions from oil and gas operations by 45 percent by 2025Footnote 24. Regulations to reach this goal are under development. | Details of the approach to reduce methane emissions were limited at the time of analysis and are not included in Update 2016. |
| Saskatchewan - 50 per cent renewable target | Saskatchewan’s provincial utility, SaskPower, set a target of increasing renewable generating capacity up to 50 per cent of total capacity by 2030Footnote 25. Currently about 25 per cent of generating capacity in Saskatchewan is renewable. | As a target, this initiative is not explicitly modelled in Update 2016. |
| Manitoba - Climate Change and Green Economy Action Plan | The Manitoba government released a climate action plan in December 2015Footnote 26. The plan includes initiatives to improve efficiency and to invest in emission reduction projects, and implement a cap and trade program that is linked with the Quebec, Ontario, and California systems. The proposed cap and trade program would apply to large emitters. | Initiatives described in Manitoba’s Action Plan, including the cap and trade program, were still under development at the time of analysis and are not included in Update 2016. |
| Ontario - cap and trade program | In spring 2016, Ontario finalized regulations for its cap and trade program, which will begin in 2017Footnote 27. Ontario intends to link its program to the Quebec-California carbon marketFootnote 28. The cap will be set at 142 MT in the first year of the program and will decline to 125 MT by 2020. The program will be phased in and provide temporary allowances to trade-exposed industries. Revenues from the plan will be invested in GHG-reducing initiatives for homes and businesses, such as electric vehicle purchase incentives and energy retrofits. |
The Ontario cap and trade program is included in Update 2016. The permit price increases to $30/tonne by 2020 and is held at that level in nominal terms throughout the projection period. |
| Ontario - Climate Action Plan | In June 2016, the Ontario government released its Climate Change Action Plan. The five-year plan introduces key actions Ontario will take towards meetings its emissions reduction targets. It also defines how revenues from the province’s cap and trade program will be spent. The plan lists key actions to be taken in nine areas, such as transportation, land-use planning, and research and development. The Ontario government will consult with stakeholders regarding the design and implementation of many of these actions. |
The initiatives described in the Ontario Climate Action Plan were still under development at the time of analysis and are not included in Update 2016. |
| Quebec - The 2030 Energy Policy | In spring 2016, Quebec released an energy policy document that aims to guide the province’s energy transition to 2030Footnote 29. The document outlines the government’s plans to establish a cohesive governance structure to manage the transition, promote a low-carbon economy, diversify Quebec’s energy supply, and take a new approach to fossil fuel energy. It also sets out targets to be achieved by 2030 for improving energy efficiency, reducing petroleum consumption and increasing renewable energy production. The 2030 Energy Policy will be implemented by first amending the existing statutory framework, followed by a series of action plans describing the measures that will be taken to implement the plan. |
Measures to implement the Quebec 2030 Energy Policy were still under development at the time of analysis and are not included in Update 2016. Targets described in the plan are not explicitly modelled in Update 2016. The Quebec cap and trade system is included in Update 2016. |
| Newfoundland and Labrador - Management of Greenhouse Gas Act | The Newfoundland and Labrador government passed legislation in June 2016 that enables the regulation of GHG emissions from industrial facilities in the provinceFootnote 30. The plan will include a form of carbon pricing for industrial emitters, the revenues of which will support funding of emission-reducing technology. | Regulations to enact the plan were still under development at the time of analysis and are not included in Update 2016. |
List of Figures
| Figure ES.1 | Total Demand for Fossil Fuels, Reference Case |
| Figure ES.2 | Crude Oil Price Assumptions and Total Oil Production, Reference, High and Low Price Cases |
| Figure ES.3 | Generating Capacity Additions and Retirements by 2040, Reference Case |
| Figure 2.1 | Global Crude Oil Prices |
| Figure 2.2 | Brent Crude Oil Price, Reference, High and Low Price Cases |
| Figure 2.3 | Henry Hub Natural Gas Price, Reference, High and Low Price Cases |
| Figure 3.1 | Historical and Projected Growth in End-Use Energy Demand by Sector, Reference Case |
| Figure 3.2 | Transportation Energy Demand by Fuel, Reference Case |
| Figure 3.3 | Projected Growth in End-Use Energy Demand, Reference, High and Low Price Cases |
| Figure 3.4 | Share of Fuel in Primary Energy Demand, Reference Case |
| Figure 3.5 | Total Canadian Crude Oil and Equivalent Production, Reference Case |
| Figure 3.6 | Oil Sands Production, Reference Case |
| Figure 3.7 | Annual Average Production-Weighted SOR Improvements of Thermal Oil Sands Production, Reference, High and Low Price Cases |
| Figure 3.8 | Total Canadian Oil Production, Reference, High and Low Price Cases |
| Figure 3.9 | Natural Gas Production by Type, Reference Case |
| Figure 3.10 | Total Canadian Marketable Natural Gas Production, Reference, High and Low Price Cases |
| Figure 3.11 | Natural Gas Liquids Production, Reference Case |
| Figure 3.12 | Capacity Mix by Primary Fuel, 2015 and 2040, Reference Case |
| Figure 3.13 | Non-hydro Renewable Capacity, Reference Case |
| Figure 3.14 | Generation by Fuel, Reference Case |
| Figure 3.15 | Total Demand for Fossil Fuels, Reference Case |
| Figure 3.16 | Estimated Weighted-Average Fossil Fuel Emission Intensity, Reference Case |
List of Tables
| Table 3.1 | Economic indicators, Reference Case |
| Table A.1 | Recent Major Climate Policy Announcements |
List of Acronyms and Abbreviations
| B.C. | British Columbia |
| CO2 | carbon dioxide |
| CSS | carbon capture and storage |
| ECCC | Environment and Climate Change Canada |
| EF 2016 | Canada’s Energy Future 2016: Energy Supply and Demand Projections to 2040 |
| GHG | greenhouse gas |
| LNG | liquefied natural gas |
| NEB | National Energy Board |
| NGL | natural gas liquid |
| SAGD | steam assisted gravity drainage |
| SOR | steam to oil ratio |
| Update 2016 | Canada’s Energy Future 2016: Update |
| WCS | Western Canadian Select |
| WTI | West Texas Intermediate |
List of Units
| 10³ | thousand |
| 106 | million |
| 109 | billion |
| 1012 | trillion |
| m³ | cubic metres |
| bbl | barrel |
| Mb | thousand barrels |
| MMb | million barrels |
| MMcf | million cubic feet |
| Bcf | billion cubic feet |
| Tcf | trillion cubic feet |
| /d | per day |
| C$ | Canadian dollars |
| US$ | U.S. dollars |
| MT | megatonnes of CO2 equivalent |
| GJ | gigajoule |
| PJ | petajoule |
| MMBtu | million British thermal units |
| MW | megawatt |
| GW | gigawatt |
| kW.h | kilowatt-hour |
| GW.h | gigawatt-hour |
| TW.h | terrawatt-hour |
Glossary
| Biomass | Organic material such as wood, crop waste, municipal solid waste, hog fuel or pulping liquor, processed for energy production. |
| Bitumen or crude bitumen | A highly viscous mixture of mainly hydrocarbons which are heavier than pentanes. In its natural state, it is not usually recoverable at a commercial rate through a well because it is too thick to flow. |
| Brent | A key global crude oil benchmark price. It is a light sweet grade that is extracted from the North Sea. |
| Capacity (Electricity) | The maximum amount of power that a device can generate, use or transfer, usually expressed in megawatts. |
| Carbon capture and storage (CCS) or carbon capture and sequestration | A method of capturing (and storing) CO2, such that it is not released into the atmosphere, hence reducing GHG emissions. Carbon dioxide is compressed into a transportable form, moved by pipeline or tanker, and stored in some medium, such as a deep geological formation. |
| CO2 flooding | CO2 flooding is a process of enhanced oil recovery, in which CO2, in a liquid form, is injected into oil-bearing reservoirs in an effort to increase the amount of oil that can be extracted. |
| Coalbed methane (CBM) | An unconventional form of natural gas that is trapped within the matrix of coal seams. Coalbed methane is distinct from typical sandstone or other conventional gas reservoir, as the methane is stored within the coal by a process called adsorption. |
| Cogeneration | Production of electricity and another form of useful thermal energy, such as heat or steam, from the same energy source. Either the byproduct heat from industrial processes can be used to power an electrical generator or surplus heat from an electric generator can be used for industrial purposes. |
| Conventional crude oil | Crude oil, which at a particular point in time, can be technically and economically produced through a well using normal production practices and without altering the natural viscous state of the oil. |
| Conventional natural gas | Natural gas that is found in the reservoir and produced through a wellbore with known technology and where the drive for production is provided by expansion of the gas or by pressure from an underlying aquifer. |
| Crude oil | A mixture of hydrocarbons of different molecular weights that exists in the liquid phase in underground reservoirs and remains liquid at atmospheric pressure and temperature. Crude oil may contain small amounts of sulphur and other non-hydrocarbons, but does not include liquids obtained from the processing of natural gas. |
| Cyclic steam stimulation (CSS) | A repeatable, thermal in situ recovery technique involving steam injection followed by oil production from wells injected with steam. Steam injection increases oil mobility and allows heated bitumen to flow into a well. |
| Energy efficiency | Technologies and measures that reduce the amount of energy and/or fuel required for the same work. |
| Energy intensity | The amount of energy used per unit of activity. Two common forms of energy intensity are energy use per capita and energy use per unit of GDP. |
| Enhanced oil recovery | The extraction of additional crude oil from reservoirs through a production process other than natural depletion. Includes both secondary and tertiary recovery processes such as pressure maintenance, cycling, water flooding, thermal methods, chemical flooding, and the use of miscible and immiscible displacement fluids. |
| Fossil fuel | Hydrocarbon-based fuel sources such as coal, natural gas, natural gas liquids and crude oil. |
| Generation (electricity) | The process of producing electric energy by transforming other forms of energy. Also, the amount of energy produced. |
| Greenhouse gas (GHG) | A gas such as carbon dioxide, methane or nitrogen oxide, which actively contribute to the atmospheric greenhouse effect. Greenhouse gases also include gases generated through industrial processes such as hydroflurocarbons, perflurocarbons and sulphur hexafluoride. |
| Gross Domestic Product (GDP) | GDP is a measure of economic activity within a country. It is the market value of all goods and services in a year within Canada’s borders. |
| Heat content (natural gas) | A measure of the amount of energy per unit of volume of the natural gas stream. Natural gas produced from oil and gas wells primarily consists of methane but can also contain natural gas liquids (NGLs) like ethane, propane, and butane. Because NGLs burn hotter than methane on a per volume basis, gas that is "rich" in NGLs has higher heat content than "lean" gas. |
| Heavy crude oil | Generally, a crude oil that has a density greater than 900 kg/m³, or an API gravity below 25. |
| Henry Hub (price) | Henry Hub is the pricing point for natural gas futures traded on the New York Mercantile Exchange. The hub is a point on the natural gas pipeline owned by Sabine Pipe Line and located in Louisiana. |
| Hydroelectric generation | A form of renewable energy wherein electricity is produced from hydropower. |
| In situ recovery | The recovery of bitumen through the use of wellbores, generally in areas where depth of burial precludes surface-mining operations. |
| Light crude oil | Generally, crude oil having a density less than 900 kg/m³, or an API gravity above 25. Also a collective term used to refer to conventional light crude oil, upgraded heavy crude oil and pentanes plus. |
| Liquefied natural gas (LNG) | Liquefied natural gas is natural gas in its liquid form. Natural gas is liquefied by cooling to minus 162 degrees Celsius (minus 260 degrees Fahrenheit), and the process reduces the volume of gas by more than 600 times, allowing for efficient transport via LNG tanker or trucks. |
| Marketable natural gas | The volume of gas that can be sold to the market after allowing for removal of impurities and after accounting for any volumes used to fuel surface facilities. As used in this report for undiscovered volumes, it is determined by applying the average surface loss from existing pools in that formation to the recoverable volumes of undiscovered pools of the same formation. |
| Natural gas liquids (NGLs) | Those hydrocarbon components recovered from natural gas as liquids. These liquids include, but are not limited to, ethane, propane, butanes, and pentanes plus. |
| Oil sands | Sand and other rock material that contains bitumen. Each particle of oil sand is coated with a layer of water and a thin film of bitumen. |
| Primary energy demand | The total requirement for all uses of energy, including energy used by the final consumer, intermediate uses of energy in transforming one energy form to another, and energy used by suppliers in providing energy to the market. |
| Real or constant dollar | When price levels are held constant at a base year, eliminating the effect of inflation. |
| Refined petroleum product | A wide range of products derived from crude oil through the refining process such as gasoline, diesel, heating oil, and jet fuel, among others. |
| Shale gas | A form of unconventional gas that is trapped within shale, a sedimentary rock originally deposited as clay or silt and characterised by extremely low permeability. The majority of the gas exists as free gas or adsorbed gas though some gas can also be found in a dissolved state within the organic material. |
| Solar energy | Includes active and passive solar heat collection systems and photovoltaics. |
| Steam assisted gravity drainage (SAGD) | SAGD is a steam stimulation technique using pairs of horizontal wells in which the bitumen drains, by gravity, into the producing wellbore, after it has been heated by the steam. In contrast to cyclic steam stimulation, steam injection and oil production are continuous and simultaneous. |
| Synthetic crude oil | Synthetic crude oil is a mixture of hydrocarbons generally similar to light sweet crude oil, derived by upgrading crude bitumen or heavy crude oil. |
| Tight gas | A form of conventional natural gas that is held in the pore space of a rock that has a lower permeability or ability to flow than usual for that type of rock. |
| Upgrading (bitumen) | The process of converting bitumen or heavy crude oil into a higher quality crude oil either by the removal of carbon (coking) or the addition of hydrogen (hydroprocessing). |
| Wave / Tidal power | Also known as tidal energy, tidal or wave power makes use of the rise and fall in sea levels, or tidal flow, to create hydropower. |
| West Texas Intermediate (WTI) | West Texas Intermediate (WTI) A key North American benchmark crude oil price. It is a light sweet grade of crude oil, priced at Cushing, Oklahoma. |
| Western Canadian Select (WCS) | Western Canadian Select (WCS) A heavy crude oil blend, priced at Hardisty, Alberta. |
- Date modified: