ARCHIVED – Canada’s Role in the Global LNG Market – Energy Market Assessment
This page has been archived on the Web
Information identified as archived is provided for reference, research or recordkeeping purposes. It is not subject to the Government of Canada Web Standards and has not been altered or updated since it was archived. Please contact us to request a format other than those available.
The Global LNG Landscape
Table 2 shows the countries that have the largest liquefaction/export capacity and largest regasification/import capacity in 2016.
Table 2 – Leading Countries in the Global LNG Trade
| LNG Liquefaction Capacity by Country (Mmtpa) | LNG Regasification Capacity by Country (Mmtpa) | ||||
|---|---|---|---|---|---|
| Qatar | 77 | Japan | 198 | ||
| Australia | 61 | United States | 132 | ||
| Malaysia | 29 | South Korea | 99 | ||
| Algeria | 25 | Spain | 49 | ||
| Nigeria | 22 | China | 49 | ||
| Indonesia | 21 | United Kingdom | 35 | ||
| Trinidad | 15 | India | 27 | ||
| Russia | 11 | France | 20 | ||
| Oman | 11 | Mexico | 17 | ||
| Egypt | 7 | Taiwan | 13 | ||
| Other | 47 | Other | 131 | ||
Source: NEB, IHS Markit, IGU, GIIGNL
Global LNG Supply
Global LNG liquefaction capacity is currently about 300 MMtpa (40.0 Bcf/d). The majority of current liquefaction capacity is in Qatar, Australia, Southeast Asia, North Africa, and Russia.
Figure 10 – Global Liquefaction Capacity

Source: IHS Markit
Description:
This stacked bar chart shows that global liquefaction capacity is forecast to nearly double by 2030, with Australia, U.S., and Qatar as top liquefaction players.
Currently, the world’s largest operating LNG liquefaction facility, with a capacity of about 22 MMtpa (3 Bcf/d), is the Bontang facility in Indonesia. Other large facilities include the North West Shelf in Australia, Bethioua in Algeria, Qatar Gas 2, Rasgas II, and RL 3 in Qatar, and Sakhalin 2 in Russia. Qatar has the largest total capacity in the world, at over 77 MMtpa (10.3 Bcf/d), and Australia is second with over 42 MMtpa (5.6 Bcf/d).
Four new projects adding over 25 MMtpa (3.3 Bcf/d) of combined capacity began operations in 2016, including three in Australia (GLNG, Australia Pacific, and Gorgon LNG) and Sabine Pass in the U.S. The majority of the near to medium-term increases in supply will come from capacity already under construction in Australia and the U.S., which combined account for 75% of capacity under construction worldwide. This will secure Australia and the U.S., along with Qatar, as the world’s largest LNG exporters in the next decade.
In the NEB’s Canada’s Energy Future 2016: Update – Energy Supply and Demand Projections to 2040, Canadian LNG exports from the B.C. Coast are assumed to start in 2021 and increase by 14 106 m³/d (0.5 Bcf/d) per year to reach 71 106 m³/d (2.5 Bcf/d) by 2025. Based on this assumption, Canada would be a relatively small contributor to global LNG supply over the next decade, contributing approximately 11.24 MMtpa (2.5 Bcf/d).
Global LNG Demand
Current global regasification capacity is approximately 770 MMtpa (102.7 Bcf/d) and is spread across more than 170 facilities (Figure 11). Most of these facilities are located in Asian countries, such as Japan, South Korea, Taiwan, China, and India, followed by the U.S. and western Europe.
Figure 11 – Global Regasification Capacity

Source: IHS Markit
Description:
This stacked bar chart shows global regasification capacity is forecast to grow but utilization rates on a global level will remain relatively low (below 50%).
LNG regasification capacity has been under-utilized, with global utilization rates of 35-40% over the past decade. Actual imports of LNG were about 270 MMtpa (36.0 Bcf/d) in 2016 versus 770 MMtpa (102.7 Bcf/d) of existing regasification capacity.
Regasification utilization is low for a variety of reasons. Some facilities were built in regions where expected gas demand growth did not materialize, where domestic gas supply growth far exceeded expectations, and/or where new pipeline capacity has now been added. The U.S. is an example where many regasification facilities were built on the East Coast in anticipation of gas supply shortages in a high demand region, but shale gas developments in the U.S. Northeast have since more than met demand.
Global LNG Pricing
Although LNG trade has become global, there is no standard global LNG pricing systemFootnote 6. Currently, some LNG contract prices are linked to global oil index prices like Brent. Other contracts are linked to regional natural gas index prices like Henry Hub plus a fixed fee for liquefaction and additional costs. Futures exchanges, such as the Intercontinental Exchange (ICE), now list LNG pricing products, but trading volumes are not significant yet.
Historically, the majority of LNG contract prices have been linked to oil prices and contracted to a fixed destination for long terms (15-20 years). This has been the standard contract structure for major Asian LNG purchasers. More recently, given the volatile price environment for both gas and oil, contracts are becoming shorter as sellers are less willing to accept long-term at current prices and buyers are less willing to lock in above today’s market prices. Also, LNG buyers are increasingly able to negotiate flexible contract terms, including different routes, shipping practices, and export and delivery points compared to traditional purchase agreements.
LNG prices vary by region. Figure 12 shows crude oil prices rising between 2010 and 2014 relative to North American natural gas prices. Since most LNG contracts outside of North America are oil-linked, Asian LNG prices and European gas prices were also rising and were significantly higher than North American natural gas prices. It was during this period that many North American companies, particularly natural gas producers, started considering building major LNG liquefaction facilities. Additionally, many Asian importing countries started making significant investments in North American gas projects that would eventually supply the LNG facilities.
Figure 12 – Global Historical LNG Prices and the WTI Oil Price
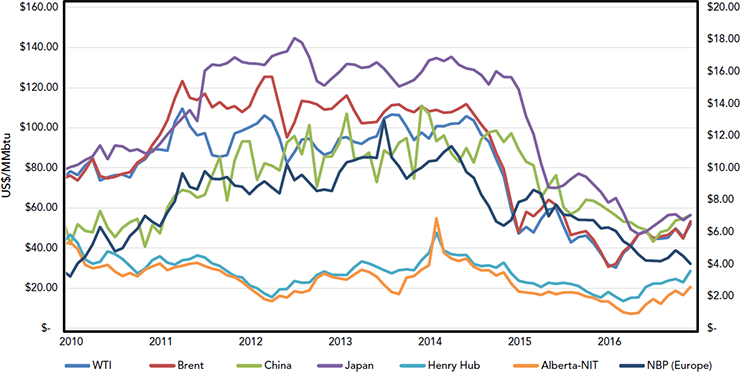
Source: NEB, NGX, NYMEX, IHS Markit, Various Asian customs import websites
Description:
This line graph shows Asian LNG import prices declining, along with the decline in crude prices; however, Asian LNG prices still are much higher than domestic North American natural gas prices.
As global oil prices dropped in late 2014, so did Asian LNG prices (to a lesser extent, so did European gas prices). As an example, the weighted-average Japanese import price dropped more than $6 per million British thermal units (MMBtu) throughout 2015, or 43%. The LNG price drop was due to the direct impact of lower oil prices on oil-linked contracts coupled with decreased LNG demand and increased global energy supply options.
Current global pricing conditions and, ultimately, the inability to secure higher priced long-term contracts have resulted in the delay and cancellation of many proposed LNG projects and expansions, particularly in North America and Australia. In addition, liquefaction projects that are already in operation with uncontracted capacity are looking for alternate LNG markets outside of Asia.
Global LNG Trends
A growing trend in global LNG is the use of Floating Storage Regasification Units (FSRUs). These are popular in emerging markets such as Lithuania, Pakistan, and the Middle East (Jordan, Israel, Kuwait, and UAE). They are also being used extensively in South America.
For example, all of Brazil and all of Argentina’s regasification capacity is provided by FSRUs. Globally, 21 of the 170 Bcf/dexisting regasification projects are floating facilities (totalling 78 MMtpa or 10.4 Bcf/d). FSRUs are generally a lower cost option than land-based LNG facilities, and are faster to bring into operation.
LNG is also being used as transportation fuel in the trucking and marine shipping industries. The International Maritime Organization (IMO)’s upcoming requirement effective in 2020 will require barges, tankers, and other ships to use only low sulfur fuel (<0.5%). Therefore, LNG demand could increase due to the retrofitting or building of new LNG-fueled ships.
- Date modified: