ARCHIVED – Canada’s Role in the Global LNG Market – Energy Market Assessment
This page has been archived on the Web
Information identified as archived is provided for reference, research or recordkeeping purposes. It is not subject to the Government of Canada Web Standards and has not been altered or updated since it was archived. Please contact us to request a format other than those available.
The U.S. LNG Industry
In years prior to the large-scale production of shale and tight gas resources, companies in the U.S. invested in the construction of LNG import terminals, anticipating a need to import natural gas to meet future demand (see Appendix 2). With increased domestic natural gas production, most of these facilities have been under-utilized, decommissioned, or are being converted (or considered for conversion) into export liquefaction capacity.
Existing U.S. import facilities such as Cove Point LNG, Freeport LNG, Corpus Christi LNG, and Sabine Pass LNG are being re-purposed from regasification terminals to liquefaction terminals. The conversion helps reduce the high costs associated with building greenfield facilities (such as many of those proposed in Canada), and is a major factor in the global competition for capital to develop LNG projects.
The U.S. has the only two existing LNG export terminals in North America with one currently in operation. The Sabine Pass terminal has a current capacity of around 33.9 106 m3/d (1.2 Bcf/d) and was the first project to add liquefaction capacity to its existing regasification terminal, with commercial operations beginning in May 2016. Kenai LNG, located in Alaska is currently up for sale and has not exported since 2015.
Table 1 – Liquefaction Capacity in Canada and the U.S.
| United States | Canada | |||
|---|---|---|---|---|
| Projects | Capacity (Bcf/d) | Projects | Capacity (Bcf/d) | |
| Existing | 2 | 1.4 | - | - |
| Under Construction | 5 | 7 | - | - |
| Proposed | 33 | 40 | 29 | 55 |
| Canceled | 11 | 11 | 2 | 4 |
Figure 8 – U.S. LNG Export/Liquefaction Projects

Source: NEB
Description:
This map shows U.S. liquefaction facilities that are either existing, under construction, proposed, or stalled/canceled. Most facilites are concentrated around the Gulf of Mexico.
Implications of U.S. LNG Development for Canada
Sabine Pass is currently exporting to many of the markets which Canadian projects are hoping to access. In 2016, 32% of U.S. LNG exports (all from Sabine Pass) went to South America, 30% to Asia, 15% to Mexico, 11% to the Middle East, and 10% to Europe.
Figure 9 – U.S. LNG Export Destinations
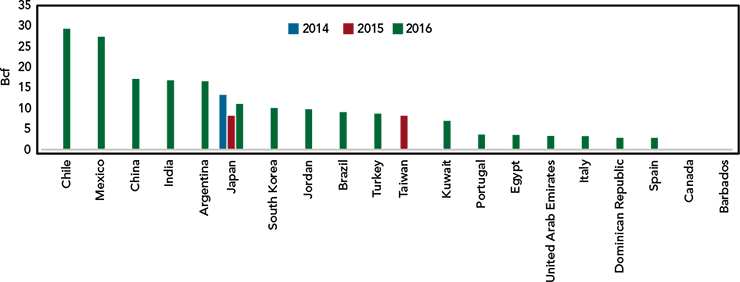
Source: EIA
Description:
This chart shows U.S. LNG export destinations in 2014, 2015, and 2016. In 2016 most LNG exports went to Chile, followed by Mexico, and China.
Most of the proposed projects in the U.S. are located along the Gulf of Mexico. However, the Jordan Cove project is located along the U.S. West Coast and would compete with Canadian west coast projects with respect to proximity to Asian markets.
The U.S. has contracts to export LNG to many countries, but nearly 70% of U.S. capacity is not dedicated to a specific location. This reflects the challenge LNG exporters face in securing long-term contracts, as buyers are diversifying their supply away from single LNG projects and single regions. If they become operational, Canadian LNG projects are likely to face similar contracting challenges.
A recent deal between the U.S. and China, whereby U.S. LNG developers could target Chinese buyers directly, could support project financing and lead to Chinese investment in liquefaction and upstream development in the U.S.

- Date modified: