ARCHIVED – Canada’s Energy Future 2016: Province and Territory Outlooks
This page has been archived on the Web
Information identified as archived is provided for reference, research or recordkeeping purposes. It is not subject to the Government of Canada Web Standards and has not been altered or updated since it was archived. Please contact us to request a format other than those available.
Executive Summary
Canada’s Energy Future 2016: Province and Territory Outlooks provides an overview of the regional dynamics in Canada’s Energy Future 2016: Energy Supply and Demand Projections to 2040 (EF 2016). It reviews EF 2016 findings and data points for each province and territory, and provides comparisons for energy production and consumption trends between the regions.
Key Findings
- Canada has a diverse energy system, and this influences its energy future.
Canada is a large and diverse country; energy is produced and consumed differently across its unique regions. The provinces and territories differ in terms of energy resource availability, historical infrastructure, industrial structures, energy and environmental policies and regulations, consumer preferences, and weather conditions. These differences greatly influence current and projected energy trends. - Electricity is increasingly generated from renewables and natural gas, to varying degrees across the provinces and territories.
The type of energy used to generate electricity varies substantially between regions because of resource accessibility and historical infrastructure development. This diversity continues over the projection period, as provinces and territories meet their electricity demands, replace aging infrastructure, and target environmental objectives in unique ways. The share of renewable electricity grows in most future capacity mixes, but the type and magnitude of change differs between regions. Natural gas plays a larger role, particularly in western Canada to replace aging coal units, and nuclear power continues to remain a significant part of the Ontario and New Brunswick’s capacity mix. - The majority of crude oil and natural gas production occurs in western Canada, and will be influenced by energy market and infrastructure developments.
Alberta leads the projected growth in crude oil production. About 60 percent of current oil production comes from the oil sands and it drives future production growth. In the Reference Case, British Columbia (B.C.) leads natural gas production growth, with the assumed LNG exports encouraging additional production. The EF 2016 alternate projections for higher and lower energy prices, and alternate market access and energy infrastructure assumptions, highlight the importance of these factors for future production trends. - Future energy price trends impact provinces and territories differently.
Energy price fluctuations impact energy consumption differently between producing and consuming regions. Overall, Canadian energy use is higher in the High Price Case and lower in the Low Price Case, largely because higher prices lead to more oil and gas development in Alberta, B.C. and Newfoundland and Labrador and therefore, more energy use. In most other regions, higher prices lead to less energy use, and lower prices lead to more energy use. - Provincial and territorial energy needs continue to be met by a unique mix of energy sources depending on the region.
The types of energy consumed by end users vary widely across the country as a result of differing regional availability and pricing. For example, provinces with large hydroelectric infrastructure tend to use more electricity, western provinces consume relatively more natural gas, and the territories use more petroleum products such as fuel oil and diesel. These shares vary moderately over the EF 2016 projections, but substantial regional variation continues. In the Reference Case projection for 2040, the share of electricity used in the end-use fuel mix ranges between 8.5 and 43 per cent among the provinces and territories. Petroleum products share of demand ranges between 30 per cent and 85 per cent and the natural gas’ share varies between 0 and 60 per cent.
Figure ES.1 - Overview of EF 2016 Projections and Key Assumptions
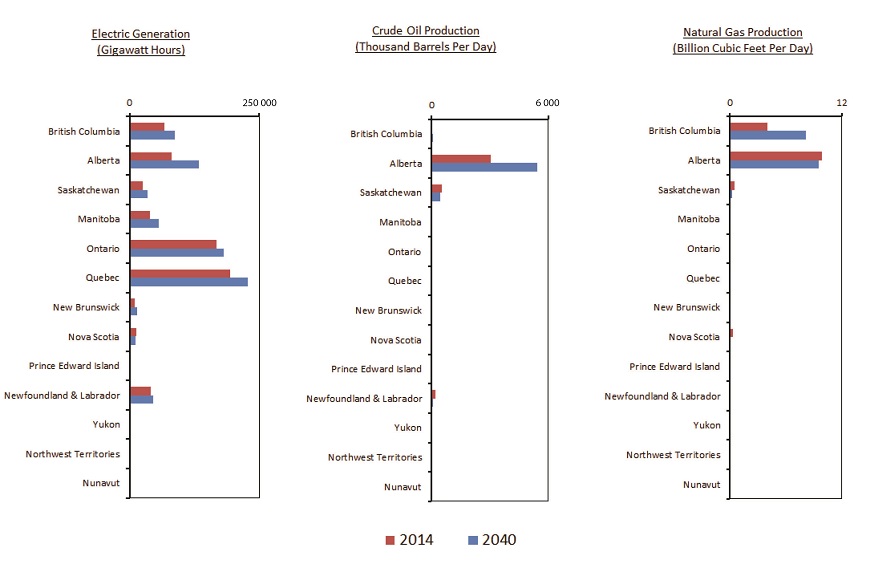
These results are from the Reference Case projection, which is a baseline outlook assuming mid-range energy prices, and policies and regulations that were law or near law at the time the analysis was finalized, which was August 2015
Figure ES.2 - Projected End-use Fuel Mix by Province and Territory, 2040
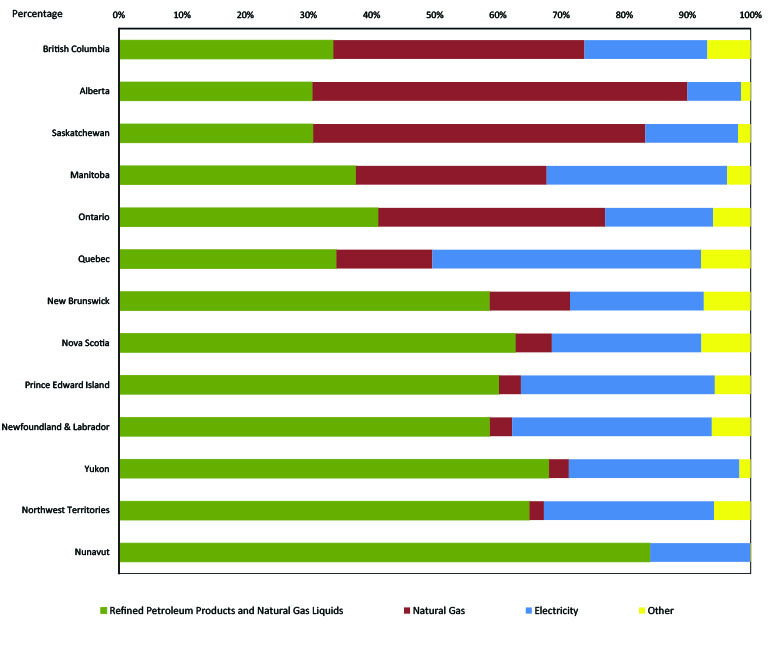
These results are from the Reference Case projection, which is a baseline outlook assuming mid-range energy prices, and policies and regulations that were law or near law at the time the analysis was finalized, which was August 2015
- Date modified: