ARCHIVED – Employment Equity Report 2014-2015
This page has been archived on the Web
Information identified as archived is provided for reference, research or recordkeeping purposes. It is not subject to the Government of Canada Web Standards and has not been altered or updated since it was archived. Please contact us to request a format other than those available.
ISSN 1929-2511
Table of Contents
2.0 Employment Equity Initiatives During This Reporting Period
4.0 Analysis of Total Employee Population
5.0 Analysis by Employment Equity Occupational Groups
- 5.1 Senior Managers
- 5.2 Middle Managers
- 5.3 Professionals
- 5.4 Semi-Professionals and Technicians
- 5.5 Supervisors
- 5.6 Administrative and Senior Clerical
- 5.7 Skilled Crafts and Trades
- 5.8 Clerical Personnel
- 5.9 Semi-Skilled Workers
- 5.10 Summary
6.0 Analysis of the Numbers of Employee Hires, Promotions and Regrettable Departures
List of Tables and Figures
- Table 1 Comparison of Total Employee Population with Availability Data
- Table 2 – Comparison of Employee Population with Availability Data by Employment Equity Groups and by Occupational Groups
- Table 3 Comparison of Employee Hires with Availability Data by Employment Equity Groups and by Occupational Groups
- Table 4 Employee Promotions by Employment Equity Groups and by Occupational Groups
- Table 5 Employee Regrettable Departures by Employment Equity Groups and by Occupational Groups
- Table 6 Workforce Availability – Women
- Table 7 Workforce Availability – Aboriginal Peoples
- Table 8 Workforce Availability – Visible Minorities
- Table 9 Workforce Availability – Persons with Disabilities
- Figure 1 Representation of Women 2012 to 2015
- Figure 2 Representation of Aboriginal Persons 2012 to 2015
- Figure 3 Representation of Visible Minorities 2012 to 2015
- Figure 4 Representation of Persons with Disabilities 2012 to 2015
1.0 Introduction
The human resources management focus of the National Energy Board (NEB) is to ensure it has the right people, at the right time, for the right jobs. The NEB is committed to providing an inclusive workplace. The cornerstones of our initiatives are based on the legislative requirements under the Employment Equity Act.
Employment Equity looks at the following groups when determining gaps in a work force: [1] Women, [2] Aboriginal People, [3] Visible Minorities and [4] Persons with Disabilities.
This annual report provides a description of Employment Equity activities at the NEB and an analysis of the results achieved during the reporting period from 1 April 2014 to 31 March 2015. In addition, the report provides a workforce description of the employees at the NEB as of 31 March 2015 and includes an analysis of internal representation versus labour market availability.
1.1 The Organization
The National Energy Board (NEB or the Board) is an independent federal, quasi-judicial regulator established in 1959 to promote safety and security, environmental protection and economic efficiency in the Canadian public interest within the mandate set by Parliament for the regulation of pipelines, energy development and trade.
A majority of employees of the NEB are headquartered in Calgary, Alberta. Regional offices were established in Montreal and Vancouver as of 1 April 2015. Since February 2004, all unionized employees have been represented by the Professional Institute of the Public Service of Canada (PIPSC), the one union certified as the bargaining agent for the NEB.
The NEB follows a strategic planning process that establishes priorities to meet its mandate. In the current environment of increasing global demand for safe and secure supplies of energy and fluctuating energy prices, the NEB’s role as Canada’s national energy regulator is as important as ever. We are challenged to maintain a skilled and knowledgeable workforce in what is typically a very competitive employment market in Calgary, where a thriving private sector oil and gas industry competes with our ability to attract and retain qualified staff over the long term. We continue to promote diversity and eliminate barriers to employment.iving private sector oil and gas industry makes it difficult to attract and retain qualified staff over the long term. We continue to promote diversity and eliminate barriers to employment.
1.2 Analysis
Data Sources: This report uses 2011 Census Availability data received from Human Resources and Skills Development Canada (HRSDC) to compare overall representation of the designated groups (Women, Aboriginal People, and Visible Minorities) at the NEB with the composition of the local population (Calgary). Persons with Disabilities data is at the national level as those statistics are not available at the local level. In previous years the NEB has used national data for all groups; utilizing Calgary data provides a more accurate comparison.
2.0 Employment Equity Initiatives During This Reporting Period
Given the NEB’s unique role, one of the greatest challenges is to attract and retain expert staff. The NEB Employment Equity and Diversity Plan (EEDP) 2013-2016 recognizes we must embrace and represent diversity to enable us to achieve excellence through our employees. It is important to move beyond considering diversity as a purely intellectual exercise to it becoming an inherent component of our organizational culture.
2.1 Aboriginal Engagement Program
In response to the NEB’s growing need for experience with Aboriginal peoples and culture, the Aboriginal Awareness committee has expanded the Aboriginal Awareness Week into a year-long program of events.
These events are educational and participation-based to provide hands-on experience to NEB staff, which supports achieving the NEB’s strategic priority of “Engaging Canadians”. The theme of this year’s activities is “Coast to Coast to Coast,” representing the need to highlight the uniqueness of Aboriginal cultures across Canada. To that end, the Aboriginal Awareness committee holds internal events such as: documentary screenings and discussions, interactive sessions with modern Aboriginal artists, crafting events which support development of materials for Enhanced Aboriginal Engagement meetings, discussion sessions on current events, and open houses to highlight resources available at the Board. The committee also promotes external events that staff can attend.
The committee has established an Aboriginal research area which is stocked with donated and loaned books, artifacts donated from staff, maps and a poster board advertising internal and external learning opportunities. This space also serves as a location for informal discussions about Aboriginal issues; it is important to have a physical element to supporting Aboriginal culture and to remember that not all information can be found on the Internet.
There is an ongoing community of practice to support Aboriginal Awareness, including an iWeb page that references key resources and provides updates on upcoming events.
2.2 Persons with Disabilities
Our focus has been to promote an inclusive, healthy and productive work environment. Accommodation for Persons with Disabilities is provided to employees as required. Work schedules are adjusted to provide variable start times where circumstances warrant and modified work weeks are provided whenever feasible. Ergonomic assessments of individual work stations continue to be provided. Employees with disabilities who require measures to be implemented in order to accommodate their needs are given attention.
The Duty to Accommodate Policy, procedures and guidelines were updated in 2014-15 and training was provided within the organization. The intent is to ensure this policy provides for an inclusive, barrier-free, non-discriminatory workplace, allowing for the full participation of both its employees and selection process candidates.
2.3 Other Initiatives
- The NEB Employment Equity & Diversity Committee (EEDC), comprised of Management, PIPSC Union representation, Employment Equity Members (employees) and Human Resources was active. The Committee is responsible for monitoring the progress of the EEDP and for making recommendations to enhance the program.
- EEDC launched a new program for employees to learn about other employees and their travels and/or their home countries. Employees volunteered to participate as presenters. Discussions included such topics as cultural differences, background, language, indigenous animals, landscape and everyday lifestyles. The sessions were well attended and feedback from presenters and participants continues to be extremely positive.
- Consultations with employee representatives on Employment Equity initiatives took place within the mandate of the NEB Union-Management Consultation Committee.
- An online orientation course that includes an Employment Equity component continues to be offered.
- The services of an Ombudsperson were available to all employees to discuss and receive coaching on issues that are related to harassment and discrimination.
- Each year, the NEB awards an individual or team who has continuously enhanced Employment Equity and diversity through behavior, actions or achievements.
- The NEB Talent Management Framework (TMF) builds upon current practices to recruit, develop, and retain a pool of talent in order to meet current and future business objectives. A key element within the framework is learning and development. The current focus on leadership development brought about a renewal of the leadership competencies used at the NEB and shared across the organization. As well, a review of the leadership development programs was initiated. This may help all employment equity employees prepare for leadership roles.
- A refreshed Emerging Leader Program for employees, including employment equity employees, interested in career advancement was launched this past year. All employees had the opportunity to apply to this program. The purpose of the NEB's Emerging Leaders Program is to develop future leaders at the NEB. Through this Program we allow individuals who have shown an interest in leadership and who have demonstrated management and leadership potential through concrete behaviors to receive support in their development and pursuit of leadership positions within the NEB. The Program is comprised of formal and experiential learning.
3.0 Workforce Analysis
3.1 Data Availability
Comparison data for this report comes from the 2011 Census Data for Calgary, with the exception of Persons with Disabilities where the source is the 2011 Participation and Activity Limitation Survey, which is based on national statistics.
The inclusion of Landed Immigrants in the statistical data can be misleading for government departments and agencies, such as the NEB, that are regulated by the Public Service Employment Act (PSEA) and the Security of Information Act. External systemic barriers and the inability to facilitate security clearances from the country of origin for Landed Immigrants create barriers to the employment of some visible minorities. Under the provisions of the PSEA, departments are required to provide Canadian Citizens with a preference for employment opportunities. Foreign educational documentation is not recognized and often difficult to verify, creating delays in potential employment for immigrants whose credentials do not meet Canadian standards, especially in hard to find skill sets such as specialty engineers, and geo-physicists.
3.2 Employee Population
The workforce analysis was conducted on the total employee population with the exception of those employees who work less than 12.5 hours/week. In addition, the following persons were not included in the NEB workforce analysis:
- Governor-in-Council appointments: Chair/CEO, Vice-Chair, and Board Members;
- Persons who were brought into the NEB on Interchange from other Federal Government departments/agencies and private industry;
- Persons who worked for a period less than thirteen weeks; or
- Students.
3.3 Self-Identification
The Self-Identification initiative continues to be a mandatory process for all employees. Mandatory information includes their name and signature; other information is voluntary.
Only those employees who voluntarily identify themselves as Aboriginal People, Visible Minorities or Persons with Disabilities are counted as members of designated groups for the purpose of conducting this workforce analysis and implementing Employment Equity. Women were also included but identified using information provided by the NEB’s Human Resources Information System (HRIS).
3.4 Analysis
Analysis of representation levels of designated groups within the NEB was conducted and conclusions appear before each table. It is important to note that, because of our small workforce, a change of one or two individuals within the designated group can change percentages dramatically.
To protect the privacy of employees, data is not shown if representation amounts to fewer than three employees with exception to men and women.
4.0 Analysis of Total Employee Population
Employment Equity representation is determined by comparing the representation within an occupational category with its workforce availability. To ensure confidentiality for employment equity groups this report will not indicate any numbers where representation is three (3) or less. Note: Tables also include number of men to ensure data is accurate.
An analysis of the total employee population was conducted; the results by gender and designated group members are shown in Table 1.
Table 1 shows that as of 31 March 2015, the total employee population was 438 employees, made up of 410 full-time and 28 part-time employees. Men comprised 37.9% of the total population, while Women had a representation of 62.1%, a slight increase from last year.
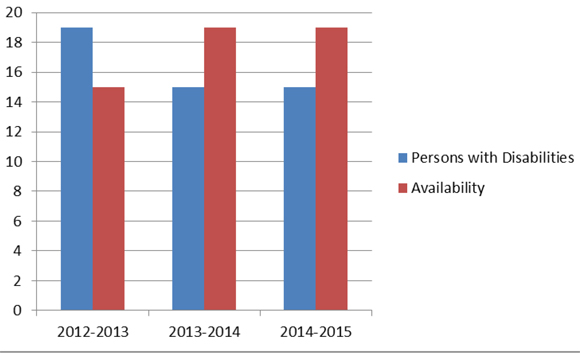
Table 1 also shows the percentage of representation by designated groups compared with the labour market availability data. From these comparisons, it can be seen that Women and Aboriginal People are represented at a higher rate at the NEB than the overall labour market and that Visible Minorities and Persons with Disabilities show lower representation than availability.
The NEB workforce analysis shows these results:
Women: Exceeds workforce availability in this group by 15%.
Aboriginal: Slightly exceeds workforce availability in this group by 1.8%.
Visible Minorities: Data indicates a slight shortage in this group by -10.9%.
Persons with Disabilities: Data indicates a slight shortage in this group by -1.5%.
Table 1: Comparison of Total Employee Population with Availability
Data as of 31 March 2015
| Number of Employees | Men | Women | Aboriginal People | Visible Minorities | Persons with Disabilities | |
|---|---|---|---|---|---|---|
| Full-Time | 410 | 163 | 247 | 15 | 61 | 14 |
| Part-Time | 28 | 3 | 25 | 4 | 4 | 1 |
| Total | 438 | 166 | 272 | 19 | 65 | 15 |
| NEB Representation | 37.9% | 62.1% | 4.3% | 14.8% | 3.4% | |
| 2011 Census Availability Data | 52.9% | 47.1% | 2.5% | 25.7% | 4.9% | |
| NEB’s differential (over and under-represented) |
-15% | 15% | 1.8% | -10.9% | -1.5% | |
5.0 Analysis by Employment Equity Occupational Groups
Table 2 shows the breakdown into Employment Equity occupational groups of the total employee population by gender and designated groups. For each occupational group, the representation by gender and designated group members is given in whole numbers, as well as a proportion of the total number of employees (the first percentage figure at the bottom of each cell). The Calgary labour market availability data is the percentage figure that follows. Where representation is fewer than three (with exception of Women), for confidentiality purposes, (*) is used to denote data.
5.1 Senior Managers
Table 2 shows that as of 31 March 2015, there were 10 senior managers employed at the NEB. Of these, three were women, which, at 30%, is higher than the overall Calgary labour market availability data of 22.2%. There is no representation of Aboriginal People or Visible Minorities in this group.
The occupational groups for Senior Managers and Middle Managers were combined for Persons with Disabilities. Total number of Persons with Disabilities within this group is fewer than three therefore analysis cannot be completed.
5.2 Middle Managers
There was a decrease from 30 to 28 middle managers (Directors) between 2014 and 2015; the representation of Women increased to 57.1%. Visible Minorities were fewer than three therefore analysis not completed. There is no representation of Aboriginal People in this group.
5.3 Professionals
The Professional group is comprised of financial officers, engineers, economists, environmental specialists, human resources advisors, communications advisors, information systems specialists, translators and lawyers. In this occupational group, Women were well represented compared with the availability data (58% vs. 49.9%) as were Aboriginal People (2.9% vs. 1.4%). Visible Minorities were under represented (14.7% vs. 24.8% availability) as were Persons with Disabilities (2.9% vs. 3.8% availability).
5.4 Semi-Professionals and Technicians
The Semi-Professionals and Technicians occupational group includes geological technologists, engineering inspectors, library technicians, information technology service analysts and graphic designers. Women are well represented in this group: Women (54.3% vs. 48.6%). The other three groups are less than 3 therefore analysis cannot be provided.
5.5 Supervisors
There are three employees in this occupational group and 100% are Women; no other representation is present in this group.
5.6 Administrative and Senior Clerical
Women made up the vast majority of the NEB’s complement in the Administrative and Senior Clerical occupational group, which includes Business Unit Administrators, Human Resources Assistants, and Assistants to Board Members and other senior level administrative staff. All Employment Equity groups are well represented compared with availability data.
5.7 Skilled Crafts and Trades
There is one employee in this occupation group. The four Employment Equity groups are underrepresented in this category.
5.8 Clerical Personnel
This category includes records, mail clerks and general administrative assistants. All equity groups were represented in this category; the table shows Women (81% vs. 70.2%). Visible Minorities were slightly low (23.8% vs. 24.3%). The other two Employment Equity groups are less than three therefore analysis cannot be provided.
5.9 Semi-Skilled Workers
There are three employees within this occupational group, of which, three or less self-identified as members of the Aboriginal Employment Equity group therefore an analysis cannot be provided.
5.10 Summary
An analysis of occupational groups from an Employment Equity perspective demonstrates a commitment to Employment Equity, with opportunities for maintaining the level of excellence and increasing representation in some occupational groups for some categories. As per our EEDP, we are committed to ensuring our selection processes do not restrict participation of potential candidates.
Women were over-represented in most occupational groups with exception to Skilled Crafts and Trades Workers and Semi-Skilled Manual Workers. The majority of all Women employed at the NEB were found in the Professional (157), Administrative & Senior Clerical (57), and Clerical Personnel (17) groups.
Aboriginal People exceed the availability percentages in the Professionals, and Administrative & Senior Clerical occupational groups.
Visible Minorities exceed the availability percentages in the Administrative & Senior Clerical group. All other occupational groups show an under-representation compared to workforce availability.
Persons with Disabilities data for most groups could not be analyzed due to privacy with exception for Professionals which shows lows representation compared to availability.
In order to increase representation in specific occupational groups, greater opportunities for upward mobility may need to be provided through leadership development, formal learning and access to internal developmental opportunities and coaching.
Table 2: Comparison of Employee Population with Availability Data by Employment Equity Groups and by Occupational Groups
as of 31 March 2015
| Occupational Group | Total | Men | Women | Aboriginal People | Visible Minorities | Persons with DisabilitiesNote b |
|---|---|---|---|---|---|---|
| Senior Managers | 10 | 7 | 3 | 0 | 0 | Note b |
| NEB% : Census% | 70% : 77.7% | 30% : 22.2% | 0%: 1.7% | 0% : 10.4% | Note a% : 4.3% | |
| Middle Managers | 28 | 12 | 16 | 0 | Note a | Note b |
| NEB% : Census% | 42.8% : 62.6% | 57.2% : 37.4% | 0% : 1.7% | Note a% : 19.1% | Note a% : 4.3 % | |
| Professionals | 271 | 114 | 157 | 8 | 40 | 8 |
| NEB% : Census% | 42% : 50.1% | 58 % : 49,9 % | 2.9% : 1.4% | 14.7% : 24.8% | 2.9% : 3.8% | |
| Semi-Professionals & Technicians | 35 | 16 | 19 | Note a | Note a | Note a |
| NEB% : Census% | 45.7% : 51.4% | 54.3% : 48.6% | Note a% : 2.6% | Note a% : 23.2% | Note a% : 4.6% | |
| Supervisors | 3 | 0 | 3 | 0 | 0 | 0 |
| NEB% : Census% | 0% : 45% | 100% : 55% | 0% : 3.1% | 0% : 27.4% | 0% : 13.9% | |
| Administrative & Senior Clerical | 66 | 9 | 57 | 5 | 16 | Note a |
| NEB% : Census% | 13.6% : 19.5% | 86.4% : 80.5% | 7.5% : 2.6% | 24.2% : 16.5% | Note a% : 3.4% | |
| Skilled Crafts & Trades | 1 | 1 | 0 | 0 | 0 | 0 |
| NEB% : Census% | 100% : 95.9% | 0% : 4.1% | 0% : 4.2% | 0% : 18.1% | 0% : 3.8% | |
| Clerical Personnel | 21 | 4 | 17 | Note a | 5 | Note a |
| NEB% : Census% | 19% : 29.8% | 80.9% : 70.2% | Note a% : 3.0% | 23.8% : 24.3% | Note a% : 7.0% | |
| Semi-Skilled Workers | 3 | 3 | 0 | Note a | 0 | 0 |
| NEB% : Census% | 100% : 85.5% | 0% : 14.5% | Note a% : 3.5% | 0% : 33.1% | 0% : 4.8% | |
| Totals | 438 | 166 | 272 | 19 | 65 | 15 |
6.0 Analysis of the Numbers of Employee Hires, Promotions and Regrettable Departures
Tables 3, 4 and 5 summarize new employee hires, promotions and regrettable departure activity between 01 April 2014 and 31 March 2015.
6.1 Employee Hires
Table 3 reports 55 employee hires. Of those, 36 were Women.
6.2 Employee Promotions
Table 4 shows that 68 employees were promoted during this period, up from 56 last year. The majority of promotions were in the Women’s group (46).
6.3 Employee Regrettable Departures
Table 5 reports that in this period, 27 employees left the NEB and of these, 14 were Women.
6.4 Summary
Analysis of hires, promotions and regrettable departures suggests that Women accounted for the greatest staff movements into, within, and out of the NEB.
Aboriginal People figures cannot be disclosed due to privacy.
Several Visible Minorities were hired, ten were promoted and six departed.
Persons with Disabilities figures cannot be disclosed due to privacy.
Table 3: Comparison of Employee Hires with Availability Data by Employment Equity Groups and by Occupational Groups
1 April 2014 to 31 March 2015
| Occupational Group | Total | Men | Women | Aboriginal People | Visible Minorities | Persons with DisabilitiesNote b |
|---|---|---|---|---|---|---|
| Senior Managers | 2 | 1 | 1 | 0 | 0 | 0Note b |
| NEB% : Census% | 50% : 77.7% | 50% : 22.2% | 0% : 1.7% | 0% : 10.4% | 0% : 4.3% | |
| Middle Managers | 1 | 0 | 1 | 0 | 0 | 0Note b |
| NEB% : Census% | 0% : 62.6% | 100% : 37.4% | 0% : 1.7% | 0% : 19.1% | 0% : 4.3% | |
| Professionals | 35 | 14 | 21 | 0 | 7 | Note a |
| NEB% : Census% | 40% : 50.1% | 60% : 49.9% | 0% : 1.4% | 20% : 24.8% | Note a% : 3.8% | |
| Semi-Professionals & Technicians | 3 | 2 | 1 | Note a | 0 | 0 |
| NEB% : Census% | 66.7% : 51.4% | 33.3% : 48.6% | Note a% : 2.6% | 0% : 23.2% | 0%: 4.6% | |
| Supervisors | 0 | 0 | 0 | 0 | 0 | 0 |
| NEB% : Census% | 0% : 45% | 0% : 55% | 0% : 3.1% | 0% : 27.4% | 0% : 13.9% | |
| Administrative & Senior Clerical | 11 | 1 | 10 | Note a | Note a | 0 |
| NEB% : Census% | 10% : 19.5% | 90% : 80.5% | Note a% : 2.6% | Note a% : 16.5% | 0% : 3.4% | |
| Skilled Crafts & Trades | 0 | 0 | 0 | 0 | 0 | 0 |
| NEB% : Census% | 0% : 95.9% | 0% : 4.1% | 0% : 4.2% | 0% : 18.1% | 0% : 3.8% | |
| Clerical Personnel | 2 | 0 | 2 | 0 | 0 | 0 |
| NEB% : Census% | 0% : 29.8% | 100% : 70.2% | 0% : 3.0% | 0% : 24.3% | 0% : 7.0% | |
| Semi-Skilled Workers | 1 | 1 | 0 | 0 | 0 | 0 |
| NEB% : Census% | 100% : 85.5% | 0% : 14.5% | 0% : 3.5% | 0% : 33.1% | 0% : 4.8% | |
| Totals | 55 | 19 | 36 | Note a | Note c | Note a |
Table 4: Employee Promotions by Employment Equity Groups and by Occupational Groups
1 April 2014 to 31 March 2015
| Occupational Group | Total | Men | Women | Aboriginal People | Visible Minorities | Persons with Disabilities |
|---|---|---|---|---|---|---|
| Senior Managers | 0 | 0 | 0 | 0 | 0 | 0 |
| Middle & Other Managers | 0 | 0 | 0 | 0 | 0 | 0 |
| Professionals | 51 | 20 | 31 | Note a | 9 | 0 |
| Semi-Professionals and Technicians | 5 | 1 | 4 | 0 | 0 | Note a |
| Administrative & Senior Clerical Personnel | 10 | 0 | 10 | 0 | Note a | 0 |
| Clerical Personnel | 2 | 1 | 1 | 0 | 0 | 0 |
| Supervisors | 0 | 0 | 0 | 0 | 0 | 0 |
| Totals | 68 | 22 | 46 | Note a | 10 | Note a |
Table 5: Employee Regrettable Departures by Employment Equity Groups and by Occupational Groups
1 April 2014 to 31 March 2015
| Occupational Group | Total | Men | Women | Aboriginal People | Visible Minorities | Persons with Disabilities |
|---|---|---|---|---|---|---|
| Senior & Middle Managers | 7 | 5 | 2 | 0 | Note a | 0 |
| Professionals | 14 | 7 | 7 | Note a | Note a | 0 |
| Administrative & Senior Clerical Personnel | 4 | 0 | 4 | 0 | Note a | 0 |
| Clerical Personnel | 2 | 1 | 1 | 0 | Note a | Note a |
| Semi-Professional and Technicians | 0 | 0 | 0 | 0 | 0 | 0 |
| Totals | 27 | 13 | 14 | Note a | 6 | Note a |
Employees at the NEB are given the option of self-identifying for the purposes of tracking three Employment Equity groups (Aboriginal Persons, Visible Minorities, and/or Persons with Disabilities). Women are not required to self-identify as this information is obtained from the Human Resources Information System(HRIS). The following four tables outline the four employment equity groups broken down into occupational groups verses workforce availability to identify gaps within the NEB workforce.
Table 6 Workforce Availability – Women
| Employment Equity Occupational Group | All Employees # |
Representation | Availability | Gap | ||
|---|---|---|---|---|---|---|
| # | % | % | # | # | ||
| 01: Senior Managers | 10 | 3 | 30.0% | 22.2% | 2 | 1 |
| 02: Middle and Other Managers | 28 | 16 | 57.1% | 37.4% | 10 | 6 |
| 03: Professionals | 271 | 157 | 57.9% | 49.9% | 135 | 22 |
| 04: Semi-Professionals and Technicians | 35 | 19 | 54.3% | 48.6% | 17 | 2 |
| 05: Supervisors | 3 | 3 | 100.0% | 55.0% | 2 | 1 |
| 07: Administrative and Senior Clerical Personnel | 66 | 57 | 86.4% | 80.5% | 53 | 4 |
| 09: Skilled Crafts and Trades Workers | 1 | 0 | 0.0% | 4.1% | 0 | 0 |
| 10: Clerical Personnel | 21 | 17 | 81.0% | 70.2% | 15 | 2 |
| 12: Semi-Skilled Manual Worker | 3 | 0 | 0.0% | 14.5% | 0 | 0 |
| Total | 438 | 272 | – | – | 234 | 38 |
Table 7 Workforce Availability – Aboriginal Peoples
| Employment Equity Occupational Group | All Employees # |
Representation | Availability | Gap | ||
|---|---|---|---|---|---|---|
| # | % | % | # | # | ||
| 01: Senior Managers | 10 | 0 | 0.0% | 1.7% | 0 | 0 |
| 02: Middle and Other Managers | 28 | 0 | 0.0% | 1.7% | 0 | 0 |
| 03: Professionals | 271 | 8 | 3.0% | 1.4% | 4 | 4 |
| 04: Semi-Professionals and Technicians | 35 | Note a | Note a | 2.6% | 1 | Note a |
| 05: Supervisors | 3 | 0 | 0.0% | 3.1% | 0 | 0 |
| 07: Administrative and Senior Clerical Personnel | 66 | 5 | 7.6% | 2.6% | 2 | 3 |
| 09: Skilled Crafts and Trades Workers | 1 | 0 | 0.0% | 4.2% | 0 | 0 |
| 10: Clerical Personnel | 21 | Note a | Note a | 3.0% | 1 | Note a |
| 12: Semi-Skilled Manual Worker | 3 | Note a | Note a | 3.5% | 0 | Note a |
| Total | 438 | 19 | – | – | 8 | 11 |
Table 8 Workforce Availability – Visible Minorities
| Employment Equity Occupational Group | All Employees |
Representation | Availability | Gap | ||
|---|---|---|---|---|---|---|
| # | # | % | % | # | # | |
| 01: Senior Managers | 10 | 0 | 0.0% | 10.4% | 1 | -0 |
| 02: Middle and Other Managers | 28 | Note a | Note a | 19.1% | 5 | Note a |
| 03: Professionals | 271 | 40 | 14.8% | 24.8% | 67 | -27 |
| 04: Semi-Professionals and Technicians | 35 | Note a | Note a | 23.2% | 8 | Note a |
| 05: Supervisors | 3 | 0 | 0.0% | 27.4% | 1 | -1 |
| 07: Administrative and Senior Clerical Personnel | 66 | 16 | 24.2% | 16.5% | 11 | 5 |
| 09: Skilled Crafts and Trades Workers | 1 | 0 | 0.0% | 18.1% | 0 | 0 |
| 10: Clerical Personnel | 21 | 5 | 23.8% | 24.3% | 5 | 0 |
| 12: Semi-Skilled Manual Worker | 3 | 0 | 0.0% | 33.1% | 1 | -1 |
| Total | 438 | 65 | – | – | 99 | -35 |
Table 9 Workforce Availability – Persons with Disabilities
| Employment Equity Occupational Group | All Employees |
Representation | Availability | Gap | ||
|---|---|---|---|---|---|---|
| # | # | % | % | # | # | |
| 01/02: Managers | 38 | Note a | Note a | 4.3% | 2 | Note a |
| 03: Professionals | 271 | 8 | 3.0% | 3.8% | 10 | -2 |
| 04: Semi-Professionals and Technicians | 35 | Note a | Note a | 4.6% | 2 | Note a |
| 05: Supervisors | 3 | 0 | 0.0% | 13.9% | 0 | 0 |
| 07: Administrative and Senior Clerical Personnel | 66 | Note a | Note a | 3.4% | 2 | Note a |
| 09: Skilled Crafts and Trades Workers | 1 | 0 | 0.0% | 3.8% | 0 | 0 |
| 10: Clerical Personnel | 21 | Note a | Note a | 7.0% | 1 | Note a |
| 12: Semi-Skilled Manual Worker | 3 | 0 | 0.0% | 4.8% | 0 | 0 |
| Total | 438 | 15 | – | – | 17 | Note a |
Figure 1 - Representation of Women 2012 to 2015
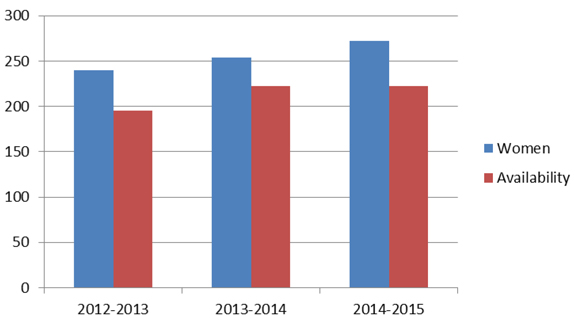
Figure 2 - Representation of Aboriginal Persons 2012 to 2015
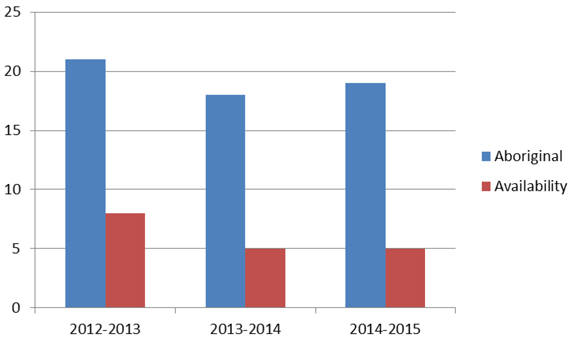
Figure 3 - Representation of Visible Minorities 2012 to 2015
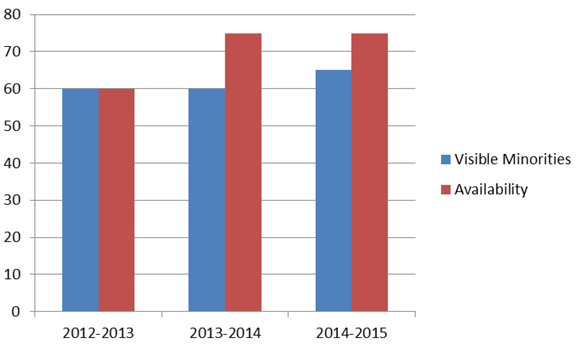
Figure 4 - Representation of Persons with Disabilities 2012 to 2015
7.0 Conclusion
The NEB workforce exceeds representation in two groups: Women and Aboriginal People. There is a slight under-representation within the Visible Minorities and Persons with Disabilities groups. As the NEB has a small workforce, a change of one or two individuals can make a significant impact to the statistics.
The NEB remains committed to promoting diversity within the workforce and improving our representation in the various groups. We continue to take into consideration Employment Equity needs in most staffing actions. This is completed in the posting of the job opportunity and is included in the organizational needs by indicating “The NEB is committed to having a skilled and diversified workforce representative of the population we serve. In support of our strategy to achieve our employment equity goals, selection may be limited to candidates self-identifying as belonging to one of the following Employment Equity groups: Women, Aboriginal Persons, Visible Minorities and Persons with Disability.” The Public Service Commission template for posting job opportunities also promotes Employment Equity and encourages candidates to indicate voluntarily on their application if they are a member of one of the four groups.
As part of our attraction and retention strategy for all employees, the NEB is committed to building a workplace that embraces inclusiveness and diversity. As documented in the NEB People Strategy, retention is an integrated approach to human resources management. Our Talent Management Framework is designed to support the development of all our employees.
We continue to build on our three year EEDP as the initiatives grow and evolve.
- Date modified: