Canada Energy Regulator – Employment Equity Report 2019–2020
Employment Equity Report 2019–2020 [PDF 1122 KB]
ISSN 2563-7088

Table of Contents
2.0 Employment Equity Initiatives
- 2.1 Women
- 2.2 Aboriginal Peoples
- 2.3 Visible Minorities
- 2.4 Persons with Disabilities
- 2.5 Other Initiatives
4.0 Analysis of Total Employee Population
5.0 Analysis by Employment Equity Occupational Groups
- 5.1 Senior Managers
- 5.2 Middle Managers
- 5.3 Professionals
- 5.4 Semi-Professionals & Technicians
- 5.5 Supervisors
- 5.6 Administrative & Senior Clerical
- 5.7 Skilled Crafts & Trades
- 5.8 Clerical Personnel
- 5.9 Semi-Skilled Workers
- 5.10 Summary
6.0 Analysis of the Numbers of Employee Hires, Promotions and Regrettable Departures
7.0 Conclusion and Recommendations
List of Tables
- TABLE 1: Comparison of Total Employee Population with Availability Data (as of March 31, 2020)
- TABLE 2: Comparison of Employee Population with Availability Data by Employment Equity Groups and by Occupational Groups (as of March 31, 2020)
- TABLE 3: Comparison of Employee Hires with Availability Data by Employment Equity Groups and by Occupational Groups (April 1, 2019 to March 31, 2020)
- TABLE 4: Employee Promotions by Employment Equity Groups and by Occupational Groups (April 1, 2019 to March 31, 2020)
- TABLE 5: Employee Departures by Employment Equity Groups and by Occupational Groups (April 1, 2019 to March 31, 2020)
- TABLE 6: Workforce Availability – Women (as of March 31, 2020)
- TABLE 7: Workforce Availability – Aboriginal Peoples (as of March 31, 2020)
- TABLE 8: Workforce Availability – Visible Minorities (as of March 31, 2020)
- TABLE 9: Workforce Availability – Persons with Disabilities (as of March 31, 2020)
- CHART 1: Employment Equity Representation: Women – 2014 to 2020
- CHART 2: Employment Equity Representation: Aboriginal Peoples – 2014 to 2020
- CHART 3: Employment Equity Representation: Visible Minorities – 2014 to 2020
- CHART 4: Employment Equity Representation: Persons with Disabilities – 2014 to 2020
1.0 Introduction
The Canada Energy Regulator (CER) is committed to ensuring legislative requirements of the Public Service Employment Act and the Employment Equity Act are adhered to. Although this report is focused entirely on the four (4) designated employment equity groups detailed below, the CER is also committed to providing an inclusive workplace for all employees.
Employment Equity targets the following designated groups when determining adherence to or gaps in a workforce: [1] Women, [2] Aboriginal Peoples, [3] Visible Minorities and [4] Persons with Disabilities.
CER’s annual Employment Equity report provides an analysis of the results achieved during the reporting period 1 April 2019 to 31 March 2020. The report provides a workforce description of the employees who have chosen to self-identify as belonging to one or more of the four (4) designated groups as of 31 March 2020, and includes an analysis of that internal representation in comparison to labor market availability.1.1 The Organization
The CER works to keep energy moving safely across the country. We review energy development projects and share energy information, all while enforcing some of the strictest safety and environmental standards in the world.
The CER replaced its predecessor, the National Energy Board (NEB), when the Canadian Energy Regulator Act came into force on 28 August 2019. In this report, comparisons of the CER’s workforce to labor market availability are as at 31 March 2020. However analyses of employee hires, promotions and departures includes data from 1 April 2019 to 31 March 2020. In addition, there are charts within this report which depict fiscal year Employment Equity Group Representation commencing from 1 April 2014 up to 31 March 2020. Any references to the CER or data from the period prior to 28 August 2019, are references to and data from the NEB.
1.2 Data Analysis
Since the vast majority of the CER’s employees are resident in Calgary, we use Calgary workforce availability data for Women, Aboriginal Peoples, and Visible Minorities obtained from Employment and Social Development Canada’s (ESDC’s) report on Canada’s 2016 Census. We use National workforce availability data for Persons with Disabilities obtained from Canada’s 2016 Participation and Activity Limitation Survey, because this survey does not have Calgary-specific details.
Notes regarding data analysis:
- Treasury Board Secretariat has confirmed the use of 2016 census data for this 2019/20 fiscal year report.
- As per the census data, the workforce population is considered to be those aged 15 years and older.
2.0 Employment Equity Initiatives
The CER recognizes the value and importance of embracing employment equity, diversity and inclusion within our workforce to achieve service excellence through our employees. The CER is committed to strengthening and continuously improving its workforce representation so that it truly reflects Canada’s diverse population.
In 2019/20, the CER reinvigorated its Diversity & Inclusion Committee (D&IC). Its volunteer membership tripled in size, up from seven (7) members last fiscal year to twenty-two (22) members. This significantly enhanced representation within the committee of members who identified as belonging to one or more of the designated employment equity groups, in addition to members identifying in other diverse communities. In addition, the committee members now reflect all of the CER’s job levels, with representation across the majority of the CER’s business units.
The D&IC nominated the CER’s first Executive Champion of Diversity and Inclusion, and also commenced preparation of its first Annual Work Plan to identify specific initiatives for each of its sub-committees.
Employment equity, diversity and inclusion initiatives are also developed and implemented by each of CER’s business units and internal service units as well. The examples presented below are just a small sample of the many initiatives undertake across the CER during 2109/20.
2.1 Women
As this report will highlight, women are well represented at the CER across all employment equity occupational groups, from Clerical Personnel, to Middle Management and to Senior Management. One of the CER’s initiatives supporting women is our “Women in Leadership” Community of Practice. It promotes the CER as an open and supportive workplace dedicated to providing a safe space for dialogue, builds leadership opportunities for women, and fosters continual improvement of gender diversity via special events, training, and group discussions.
2.2 Aboriginal Peoples
The CER continues to refine and expand its Indigenous awareness initiatives and training. Indigenous awareness at the CER promotes understanding of and respect for Indigenous Peoples’ diverse cultures, unique perspectives and contributions made to complement Canada’s rich past, present and future.
In partnership with other federal departments and industry in Calgary, the CER promotes and encourages employees to participate in meetings, celebrations and traditional ceremonies respecting Indigenous Peoples, as well as commemorative events.
One example of such an event was CER’s promotion of Orange Shirt Day. Over 100 employees wore an orange garment to work to show their support. The day is a legacy of the St. Joseph Mission Residential School (1891-1981) Commemoration Project and Reunion events that took place in Williams Lake, BC, Canada, in May 2013, to commemorate the residential school experience, to witness and honor the healing journey of the survivors and their families, and to commit to the ongoing process of reconciliation.
An example of a unique initiative of the CER, with the help of UBC’s Data Science for Social Good Fellowship Program, was our project to garner the learnings from the Indigenous oral traditional knowledge found in our hearing transcripts. One outcome of the project was a commitment to engage with Indigenous communities to co-design a protocol to better steward this knowledge.
Another example of a unique initiative was when we arranged a partnership with PLATO Testing (a consultancy providing Indigenous software testers) and Code for Canada (a not-for-profit which helps government organizations overhaul their delivery of digital public services). We collaborated on the redesign of our publicly accessible Regulatory Documents database system, which includes over 300,000 regulatory documents including studies on the environment, soil management, endangered species, and traditional knowledge on land use. PLATO conducted user-testing of the system prior to redesign, to understand how Indigenous Peoples navigated through the system. This input was incorporated in the redesign done by Code for Canada. The redesign made access to valuable information much easier for Indigenous Peoples, and for all Canadians.
2.3 Visible Minorities
There were numerous initiatives in 2019/20 aligned with the CER’s strategy for elimination of racial discrimination, such as the promotion of International Day for Elimination of Racial Discrimination, and the work undertaken by the CER’s Diversity & Inclusion Committee (D&IC). This included laying the groundwork for mandatory Unconscious Bias Training for all staff, intranet articles promoting anti-racism, and researching Blind CV Recruitment. The D&IC also hosted a monthly Cultural Awareness session where volunteer presenters bring forward topics as cultural differences, mental and physical health awareness, and the value of diverse backgrounds, languages, and lifestyles.
The CER made specific efforts to recruit students belonging to a visible minority group by using the FSWEP inventory for summer hires. This inventory also included students with disabilities (EOSD) and Indigenous students (ISEO), who registered for employment.
2.4 Persons with Disabilities
In 2019/20 the CER continued to focus on promoting an inclusive, healthy and productive work environment. Accommodations included work schedule adjustments to provide variable start and stop times, and modified work weeks where circumstances warrant. Ergonomic assessments of individual work stations were provided upon request.
Duty to Accommodate training was facilitated in collaboration with the Union and Human Resources and continues to be a mandatory course for leaders.
2.5 Other Initiatives
An online orientation course which includes an Employment Equity component continues to be offered to all new hires at the CER.
Telework Agreements are available as an option for consideration to encourage employment equity groups and other candidates and existing employees to benefit from flexible work arrangements.
The services of a third party Ombudsperson Office are routinely promoted to all employees as one avenue to discuss their concerns and provide an opportunity to receive personal coaching on difficult issues. The Ombuds present several 1.5 hour learning sessions per year on topics such as “Being Aware of your Perceptions”, “Managing Change Fatique”, “Managing Difficult Behaviours” and “Being Mindful”. Attendance at one of these trainings per year is mandatory as part of the CER’s overall Respect in the Workplace Training.
Each year, the CER presents its Diversity and Inclusiveness Award to an individual or team who has continuously enhanced employment equity and diversity through their behavior, actions or achievements.
3.0 Workforce Analysis
3.1 Data Availability
It is noted that Landed Immigrants are included in the statistical data, however external systemic barriers for hiring may skew the results for government departments and agencies, such as the CER, that are regulated by the Public Service Employment Act (PSEA) and the Security of Information Act. Under the provisions of the PSEA, departments are required to provide Canadian Citizens with a preference for employment opportunities. However, barriers exist in regard to hiring Landed Immigrants, such as the inability to expedite security clearances from many Landed Immigrants’ countries, and the candidates’ requirement to go through a lengthy process to ensure their foreign educational documentation is officially verified to Canadian standards. These barriers hinder our ability to hire Landed Immigrants, many of whom we have found to be excellent candidates for hard to find technical skill sets such as specialty engineers.
It is further noted that the census data from which workforce availability is derived includes those 15 years of age and older. It is doubtful whether all Canadian Citizens over the age of 14 are actively seeking employment; nevertheless the CER recognizes that the census data is the available and common measuring stick across the federal government for workforce availability.
3.2 Employee Population
The workforce analysis was conducted on the total employee population with the exception of individuals who work less than 12.5 hours/week. In addition, the following persons were not included in the CER workforce analysis:
- Governor-in-Council appointments: Chair/CEO, Vice-Chair, and Board Members (former appointees to the CER’s predecessor, the National Energy Board);
- Persons who are at the CER on Interchange from other Federal Government departments/agencies and private industry;
- Persons who worked for a period less than thirteen weeks;
- Students;
- Casuals; and
- Contractors.
3.3 Self-Identification
CER is onboarded to MyGCHR 9.1, one of the Government of Canada’s standardized Human Resources (HR) management systems in use by many Federal Departments and Agencies. It is a consolidated automated information system for all HR administrative transactions, including self-service for employees and managers.
Since the arrival of MyGCHR at the CER in March 2016, employees have had the option to self-identify when they log in to the system for the first time. Only those employees who voluntarily identify as Aboriginal People, Visible Minorities or Persons with Disabilities are captured as members of designated groups for the purpose of conducting the workforce analysis. Women were also included but identified using the gender information provided by employees via their hiring documents which are entered into MyGCHR by Human Resources.
3.4 Analysis
An analysis of representation levels of designated groups within the CER was conducted and conclusions are detailed below. It is important to note that, due to our relatively small workforce, a change of one or two individuals within a designated group can change percentages significantly.
4.0 Analysis of Total Employee Population
Employment equity representation is determined by comparing the representation within an occupational category with its workforce availability. To ensure confidentiality for employment equity group employees, the tables presented in this report do not indicate any numbers where representation is three (3) or less, with the exception of Women. Please note that tables include the number of men to ensure data is accurate.
An analysis of the total employee population was conducted and the results by gender and designated group members are shown in Table 1 . Note that the numbers across the rows in Table 1 will exceed the total employee population, because there will be men and women who are represented in more than one category in the row.
Table 1 shows that as of 31 March 2020, the total employee population was 522 employees, made up of 489 full-time and 33 part-time employees. Men comprised 36% of the total population. Women represented 64%, which is a marginal increase from last year as shown in Chart 1: Employment Equity Representation: Women - 2014 to 2020.
Table 1 also shows the percentage of representation by designated groups compared with the labour market availability data. From these comparisons, it can be seen that Women and Aboriginal People are represented at a higher rate at the CER than the overall labour market, and Visible Minorities and Persons with Disabilities show lower than availability.
Note that the comparisons throughout this report are percentage point differentials. For example, if CER representation in a group is 40% and workforce availability is 20%, then the comparison is that the CER is 20% (20 percentage points) higher than availability.
Specifically, the CER workforce analysis shows these results:
Women: Exceeds workforce availability in this group.
Aboriginal Peoples: Exceeds workforce availability in this group.
Visible Minorities: Falls short of workforce availability in this group.
Persons with Disabilities: Falls short of workforce availability in this group.
TABLE 1: Comparison of Total Employee Population with Availability Data (as of March 31, 2020)
| Number of Employees | Men | Women | Aboriginal Peoples | Visible Minorities | Persons with Disabilities** | |
|---|---|---|---|---|---|---|
| Full-Time | 489 | 185 | 304 | 23 | 58 | 19 |
| Part-Time | 33 | 3 | 30 | * | 4 | * |
| Total | 552 | 188 | 334 | * | 62 | * |
| CER Representation | 36% | 64% | *% | 11.9% | *% | |
| 2016 Census Availability Data* | 49.8% | 50.2% | 2.7% | 22.4% | 8.7% | |
| Variance (over and under-represented) |
-13.8% | 13.8% | *% | -10.5% | *% | |
Note: the groups above will not add up to the total # of employees as an employee may belong to more than one group. |
||||||
5.0 Analysis by Employment Equity Occupational Groups
Table 2 shows the breakdown into employment equity occupational groups of the total employee population by gender and designated groups. For each occupational group, the representation by gender and designated group members is given in whole numbers, as well as a proportion of the total number of employees (the first percentage figure at the bottom of each cell). The Calgary labour market availability data is the percentage figure that follows. Where representation is three or fewer (with exception of women), for confidentiality purposes, (*) is used to denote that data exists but is not reported. Data collected for Persons with Disabilities combines the Senior Managers and Middle Managers categories and (**) is used to denote that the data is combined.
5.1 Senior Managers
Table 2 shows that as of 31 March 2020, there were 16 senior managers employed at the CER. Nine (9) were women, which at 56.3%, is higher than the overall Calgary labour market availability of 27.6%. There was no representation of Aboriginal Peoples in this group. The CER’s representation of Visible Minorities in this group is not specified due to being 3 or fewer, however it was lower than the overall national labour market availability of 11.5%.
The occupational groups of Senior Managers and Middle Managers were combined for Persons with Disabilities. The CER’s representation is not specified due to being 3 or fewer, however it was lower than the overall national labour market availability of 5.0%.
5.2 Middle Managers
The number of middle managers (34) increased slightly over the previous year. Women increased from 45.2% to 52.8%, and Visible Minorities remained approximately the same as last year at 9.6%. There was no representation of Aboriginal Peoples, and the CER’s representation of Persons with Disabilities in this group is not specified due to being 3 or fewer.
5.3 Professionals
The Professionals group is comprised of financial officers, engineers, economists, environmental specialists, human resources advisors, communications advisors, information systems specialists, translators and lawyers. In this occupational group, Women were well represented (59.3% vs 45% availability). Aboriginal Peoples (3.5% vs 2.4% availability). Visible Minorities were under represented (10.6% vs 22.1% availability), as were Persons with Disabilities (3.2% vs 8.9% availability).
5.4 Semi-Professionals & Technicians
The Semi-Professionals and Technicians occupational group includes engineering inspectors, library technicians, information technology service analysts and graphic designers. Women are well represented in this group (57.9% vs 37.1%), as were Persons with Disabilities, although specific details are not provided as representation was 3 or fewer. Aboriginal Peoples and Visible Minorities were both under represented and also not specified for the same reason.
5.5 Supervisors
There were four (4) employees in this occupational group and 100% were Women. Visible Minorities were 3 or fewer therefore numbers are not shown.
5.6 Administrative & Senior Clerical
Women made up the majority of the CER’s complement in the Administrative & Senior Clerical occupational group, which includes business unit administrators, human resources assistants, and other senior level administrative staff. Women were well represented (85.7% vs 81.1%), as were Visible Minorities (23.2% vs 20.9%). Aboriginal Peoples and Persons with Disabilities were both 3 or fewer therefore numbers are not shown.
5.7 Skilled Crafts & Trades
There is only one (1) employee within this occupational group, and they have not self-identified.
5.8 Clerical Personnel
This category includes records, mail clerks and general administrative assistants. Most employment equity groups were well represented in this category; Women (81.0 % vs 70.7%) and Aboriginal Peoples (13.8% vs 3.1%). Persons with Disabilities were almost at par with availability (8.6% vs 9.3%), however Visible Minorities were under-represented (15.5% vs 30.6%).
5.9 Semi-Skilled Workers
There is only one (1) employee within this occupational group, and they have not self-identified.
5.10 Summary
An analysis of occupational groups from an employment equity perspective highlights opportunities for increasing representation in under-represented occupational groups, and maintaining or improving in occupational groups that are well represented already.
Women exceeded availability by 13.8%. They were highly represented in all occupational groups, except for Skilled Crafts and Semi-Skilled Workers, noting that the CER only has two (2) staff in those two groups. The top occupational groups for Women were Professionals (186 or 59.3%), Administrative and Senior Clerical (48 or 85.7%) and Clerical Personnel (47 or 81%).
Aboriginal Peoples exceeded availability. The top occupational groups for Aboriginal Peoples were Professionals, Clerical Personnel, Semi-Professionals & Technicians and Administrative & Senior Clerical. Opportunities for improvement were noted in the Senior Management and Middle Management groups.
Visible Minorities fell short of workforce availability by -10.5%. They were less than availability in all occupational groups except for Administrative & Senior Clerical. This indicates that a more vigorous focus for this employment equity group is warranted.
Persons with Disabilities fell short of workforce availability. While they exceeded availability in the Senior Managers group and were generally on par with availability in the Semi-Professionals & Technicians and Clerical Personnel groups, they were less than available workforce in all other occupational groups. Additional focus on this employment equity group is indicated.
TABLE 2: Comparison of Employee Population with Availability Data by Employment Equity Groups and by Occupational Groups
(as of March 31, 2020)
| Employment Equity Occupational Group |
Total | Men | Women | Aboriginal Peoples | Visible Minorities | Persons With DisabilitiesTable Note ** |
|---|---|---|---|---|---|---|
| 01: Senior Managers | 16 | 7 | 9 | 0 | Table Note * | Table Note * |
| CER% : Census% | 43.7% : 62.4% | 56.3% : 27.6% | 0% : 3.2% | Table Note *% : 11.5% | Table Note *% : 5% | |
| 02: Middle Managers | 34 | 16 | 18 | 0 | Table Note * | Table Note * |
| CER% : Census% | 47.2% : 60.6% | 52.8% : 39.4% | 0% : 2.7% | Table Note *% : 17.6% | Table Note ** : 5% | |
| 03: Professionals | 313 | 127 | 186 | 11 | 33 | 10 |
| CER% : Census% | 40.7% : 54.9% | 59.3% : 45% | 3.5% : 2.4% | 10.6% :22.1% | 3.2% : 8.9% | |
| 04: Semi-Profess. & Technicians | 39 | 17 | 22 | Table Note * | Table Note * | Table Note * |
| CER% : Census% | 43.1% : 61.2% | 57.9% : 37.1% | Table Note *% : 3.4% | Table Note *% : 19.2% | Table Note *% %: 7.6% | |
| 05: Supervisors | 4 | 0 | 4 | 0 | Table Note * | 0 |
| CER% : Census% | 0% : 46.2% | 100% : 53.8% | 0% : 3.1% | Table Note *% : 36.7% | 0% : 27.5% | |
| 07: Administrative & Senior Clerical | 56 | 8 | 48 | * | 13 | 0 |
| CER% : Census% | 14.3% : 18.9% | 85.7% : 81.1% | Table Note *% : 2.9% | 23.5% : 20.9% | Table Note *% : 10% | |
| 09: Skilled Crafts and Trade Workers | 1 | 1 | 0 | 0 | 0 | 0 |
| CER% : Census% | 100% : 93.2% | 0% : 6.8% | 0% : 3.8% | 0% : 24.3% | 0% : 7.8% | |
| 10: Clerical Personnel | 58 | 11 | 47 | 8 | 9 | 5 |
| CER% : Census% | 19% : 29.3% | 81% : 70.7% | 13.8% : 3.1% | 15.5% : 30.6% | 8.6% : 9.3% | |
| 12: Semi-Skilled Manual Workers | 1 | 1 | 0 | 0 | 0 | 0 |
| CER% : Census% | 100% : 85.6% | 0% : 14.4% | 0% : 3.0% | 0% : 40.1% | 0% : 10% | |
| Totals | 552 | 188 | 334 | Table Note * | 62 | Table Note * |
|
Note: Occupational Groups will not add up to the totals as employees may belong to more than one designated groups. Note: The #s which precede the Employment Equity Occupational Groups in column 1 are non-sequential numeric codes. |
||||||
6.0 Analysis of the Numbers of Employee Hires, Promotions and Regrettable Departures
Tables 3, 4 and 5 summarize new employee hires, promotions and departure activity between April 1st, 2019 and March 31st, 2020.
6.1 Employee Hires
Table 3 reports 37 employees were hired. Of those, 19 (51.4%) were women. Although there were Aboriginal Peoples and Visible Minorities hired, their numbers are three (3) or less in each category and therefore not disclosed.
6.2 Employee Promotions
Table 4 shows that 57 employees were promoted during this period, approximately 42.5% increase from last year. Like last year, the majority of promotions (71.9%) were Women, and 13 (22.8%) were Visible Minorities. Although there were promotions of Aboriginal Peoples and Persons with Disabilities, their numbers are three (3) or less in each category and therefore not disclosed.
6.3 Employee Departures
Table 5 shows that of the 11 employees who left the CER during this period, five (45.5%) were Women. The departure of Visible Minorities was three (3) or less, hence not specified. As in past reports, these departures primarily occurred among the Professionals occupational group.
6.4 Summary
Analysis of hires, promotions and departures suggests that Women continue to account for the greatest staff movements into, within, and out of the CER. This makes sense since Women accounted for almost 65% of the CER’s workforce in 2019/20, as per Table 1.
7.0 Conclusion and Recommendations
The CER’s overall workforce exceeds representation in two employment equity groups: Women and Aboriginal Peoples. There is an under-representation within Visible Minorities and Persons with Disabilities.
The CER is committed to ensuring our internal selection processes are barrier-free and do not restrict participation of any Canadian citizen, in addition to supporting the development of all our employees.
As one avenue for improving our representation in the various groups, the CER promotes diversity within the workforce to take into consideration employment equity needs in staffing actions. Job postings ensuring the following statement is included: “The CER is committed to having a skilled and diversified workforce representative of the population we serve. In support of our strategy to achieve our employment equity goals, selection may be limited to candidates self-identifying as belonging to one of the following employment equity groups: women, aboriginal persons, visible minorities and persons with disability.” The Public Service Commission template for posting job opportunities also promotes employment equity and encourages candidates to indicate voluntarily on their application if they are a member of one of the four groups.
In order to increase the CER’s numbers in under-represented employee equity groups and within specific occupational groups, targeted staffing where gaps currently exist is recommended. Plans are already underway this fiscal year to create an Indigenous and a Visible Minorities inventory for entry level positions. Targeted opportunities for upward mobility should also be provided via programs and initiatives such as succession planning, leadership development, formal learning and access to internal developmental opportunities. Consideration should also be given to targeted recruitment campaigns at job fairs, universities, on-line venues and social media.
TABLE 3: Comparison of Employee Hires with Availability Data by Employment Equity Groups and by Occupational Groups
– April 1, 2019 to March 31, 2020
| Employment Equity Occupational Group | Total | Men | Women | Aboriginal Peoples | Visible Minorities | Persons With DisabilitiesTable Note ** |
|---|---|---|---|---|---|---|
| 01: Senior Managers | 0 | 0 | 0 | 0 | 0 | 0 |
| CER% : Census% | 0% : 72.4% | 0% : 27.6% | 0% : 3.2% | 0% : 11.5% | 0% : 5% | |
| 02: Middle Managers | 2 | 1 | 1 | 0 | 0 | 0 |
| CER% : Census% | 50% : 60.6% | 50% : 39.4% | 0% : 2.7% | 0% : 17.6% | 0% : 5% | |
| 03: Professionals | 23 | 12 | 11 | Table Note * | Table Note * | 0 |
| CER% : Census% | 52.2% : 54.9% | 47.8% : 45% | Table Note *% : 2.4% | Table Note *% :22.3% | 0% : 8.9% | |
| 04: Semi-Professionals & Technicians | 3 | 2 | 1 | 0 | 0 | 0 |
| CER% : Census% | 66.7% : 41.7% | 33.3% : 58.3% | 0% : 3.3% | 0% : 19.6% | 0%: 7.6% | |
| 07: Administrative & Senior Clerical | 5 | 1 | 4 | 0 | 0 | 0 |
| CER% : Census% | 20% : 18.9% | 80% : 81.1% | 0% : 2.9% | 0% : 20.9% | 0% : 10% | |
| 10: Clerical Personnel | 4 | 2 | 2 | 0 | 0 | 0 |
| CER% : Census% | 50% : 29.3% | 50% : 70.7% | 0% : 3.1% | 0% : 30.6% | 0% : 9.3% | |
| Totals | 37 | 18 | 19 | Table Note * | Table Note * | Table Note * |
|
Note: Occupational Groups will not add up to the totals as employees may belong to more than one designated groups. Note: The #s which precede the Employment Equity Occupational Groups in column 1 are non-sequential numeric codes. | ||||||
TABLE 4: Employee Promotions by Employment Equity Groups and by Occupational Groups
(1 April 2019 to 31 March 2020)
| Employment Equity Occupational Group | Total | Men | Women | Aboriginal Peoples | Visible Minorities | Persons with Disabilities |
|---|---|---|---|---|---|---|
| 01: Senior Managers | 1 | 1 | 0 | 0 | 0 | 0 |
| 02: Middle Managers | 5 | 2 | 3 | 0 | Table Note * | 0 |
| 03: Professionals | 32 | 12 | 20 | 0 | 6 | 0 |
| 04: Semi-Professionals & Technicians | 6 | 1 | 5 | 0 | 0 | 0 |
| 05: Supervisors | 1 | 0 | 1 | 0 | 0 | 0 |
| 07: Administrative & Senior Clerical Personnel | 8 | 0 | 8 | Table Note * | Table Note * | 0 |
| 10: Clerical Personnel | 4 | 0 | 4 | Table Note * | Table Note * | Table Note * |
| Total | 57 | 16 | 41 | Table Note * | 13 | Table Note * |
|
Note: Occupational Groups will not add up to the totals as employees may belong to more than one designated groups. Note: The #s which precede the Employment Equity Occupational Groups in column 1 are non-sequential numeric codes. |
||||||
TABLE 5: Employee Departures by Employment Equity Groups and by Occupational Groups
– (April 1, 2019 to March 31, 2020)
| Employment Equity Occupational Group | Total | Men | Women | Aboriginal Peoples | Visible Minorities | Persons with Disabilities |
|---|---|---|---|---|---|---|
| 01: Senior Managers | 0 | 0 | 0 | 0 | 0 | 0 |
| 02: Middle Managers | 2 | 2 | 0 | 0 | Table Note * | 0 |
| 03: Professionals | 5 | 2 | 3 | 0 | Table Note * | 0 |
| 04: Semi-Professionals &Technicians | 1 | 0 | 1 | 0 | 0 | 0 |
| 05: Supervisors | 0 | 0 | 0 | 0 | 0 | 0 |
| 07: Administrative & Senior Clerical Personnel | 0 | 0 | 0 | 0 | 0 | 0 |
| 10: Clerical Personnel | 3 | 2 | 1 | 0 | 0 | 0 |
| Total | 11 | 6 | 5 | 0 | Table Note * | 0 |
|
Note: Occupational Groups will not add up to the totals as employees may belong to more than one designated groups. Note: The #s which precede the Employment Equity Occupational Groups in column 1 are non-sequential numeric codes. |
||||||
TABLE 6: Workforce Availability – Women
(as of March 31, 2020)
| Employment Equity Occupational Group | All Employees | Representation | Availability | Gap | ||
|---|---|---|---|---|---|---|
| # | # | % | % | # | # | |
| 01: Senior Managers | 16 | 9 | 56.3% | 27.6% | 4 | +5 |
| 02: Middle Managers | 36 | 19 | 52.8% | 39.4% | 14 | +5 |
| 03: Professionals | 312 | 185 | 59.3% | 45% | 140 | +45 |
| 04: Semi-Professionals & Technicians | 38 | 22 | 57.9% | 37.1% | 14 | +8 |
| 05: Supervisors | 4 | 4 | 100% | 53.8% | 2 | +2 |
| 07: Administrative & Senior Clerical Personnel | 56 | 48 | 85.7% | 81.1% | 45 | +3 |
| 09: Skilled Crafts & Trades Workers | 1 | 0 | 0% | 6.8% | 0 | 0 |
| 10: Clerical Personnel | 58 | 47 | 81% | 70.7% | 41 | +6 |
| 12: Semi-Skilled Worker | 1 | 0 | 0% | 14.4% | 0 | 0 |
| Total | 522 | 334 | 64% | 50.2% | 260 | +74 |
* Representation is three (3) or less. Note: Occupational Groups will not add up to the totals as employees may belong to more than one designated groups Note: The #s which precede the Employment Equity Occupational Groups in column 1 are non-sequential numeric codes. |
||||||
TABLE 7: Workforce Availability – Aboriginal Peoples
(as of March 31, 2020)
| Employment Equity Occupational Group | All Employees | Representation | Availability | Gap | ||
|---|---|---|---|---|---|---|
| # | # | % | % | # | # | |
| 01: Senior Managers | 16 | 0 | 0% | 3.2% | 1 | -1 |
| 02: Middle Managers | 36 | 0 | 0% | 2.7% | 1 | -1 |
| 03: Professionals | 312 | 11 | 3.5% | 2.4% | 7 | +4 |
| 04: Semi-Professionals & Technicians | 38 | Table Note * | Table Note *% | 3.3% | 1 | Table Note * |
| 05: Supervisors | 4 | 0 | 0.0% | 3.1% | 0 | 0 |
| 07: Administrative & Senior Clerical Personnel | 56 | Table Note * | Table Note *% | 2.9% | 2 | Table Note * |
| 09: Skilled Crafts & Trades Workers | 1 | 0 | 0% | 3.8% | 0 | 0 |
| 10: Clerical Personnel | 58 | 8 | 13.8% | 3.1% | 2 | +6 |
| 12: Semi-Skilled Worker | 1 | 0 | 0% | 3.0% | 0 | 0 |
| Total | 522 | Table Note * | Table Note *% | 2.7% | 14 | Table Note * |
|
Note: Occupational Groups will not add up to the totals as employees may belong to more than one designated groups. Note: The #s which precede the Employment Equity Occupational Groups in column 1 are non-sequential numeric codes. |
||||||
TABLE 8: Workforce Availability – Visible Minorities
(as of March 31, 2020)
| Employment Equity Occupational Group | All Employees | Representation | Availability | Gap | ||
|---|---|---|---|---|---|---|
| # | # | % | % | # | # | |
| 01: Senior Managers | 16 | Table Note * | Table Note *% | 11.5% | 2 | Table Note * |
| 02: Middle Managers | 36 | 4 | 11.1% | 17.6% | 6 | -2 |
| 03: Professionals | 312 | 33 | 10.8% | 22.3% | 70 | -37 |
| 04: Semi-Professionals & Technicians | 38 | Table Note * | Table Note *% | 19.6% | 8 | Table Note * |
| 05: Supervisors | 4 | Table Note * | Table Note *% | 36.7% | 1 | Table Note * |
| 07: Administrative & Senior Clerical Personnel | 56 | 13 | 23.2 | 20.9% | 12 | +1 |
| 09: Skilled Crafts & Trades Workers | 1 | 0 | 0% | 24.3% | 0 | 0 |
| 10: Clerical Personnel | 58 | 9 | 15.5% | 30.6% | 18 | -9 |
| 12: Semi-Skilled Worker | 1 | 0 | 0% | 40.1% | 0 | 0 |
| Total | 522 | 62 | 11.9% | 22.4% | 117 | Table Note * |
|
Note: Occupational Groups will not add up to the totals as employees may belong to more than one designated groups. Note: The #s which precede the Employment Equity Occupational Groups in column 1 are non-sequential numeric codes. |
||||||
TABLE 9: Workforce Availability – Persons with Disabilities
(as of March 31, 2020)
| Employment Equity Occupational Group | All Employees | Representation | Availability | Gap | ||
|---|---|---|---|---|---|---|
| # | # | % | % | # | # | |
| 01/02: ManagersTable Note ** | 52 | Table Note * | Table Note *% | 5.0% | 3 | Table Note * |
| 03: Professionals | 312 | 10 | 3.2% | 8.9% | 28 | -18 |
| 04: Semi-Professionals & Technicians | 38 | Table Note * | Table Note *% | 7.6% | 3 | Table Note * |
| 05: Supervisors | 4 | 0 | 0% | 27.5% | 1 | -1 |
| 06: Administrative & Senior Clerical Personnel | 56 | Table Note * | Table Note *% | 10% | 6 | Table Note * |
| 07: Skilled Crafts & Trades Workers | 1 | 0 | 0% | 7.8% | 0 | 0 |
| 08: Clerical Personnel | 58 | 5 | 8.6% | 9.3% | 5 | 0 |
| 09: Semi-Skilled Worker | 1 | 0 | 0% | 10.3% | 0 | 0 |
| Total | 522 | Table Note * | Table Note *% | 8.7% | 46 | Table Note * |
|
Note: The #s which precede the Employment Equity Occupational Groups in column 1 are non-sequential numeric codes. |
||||||
CHART 1: Employment Equity Representation: Women – 2014 to 2020
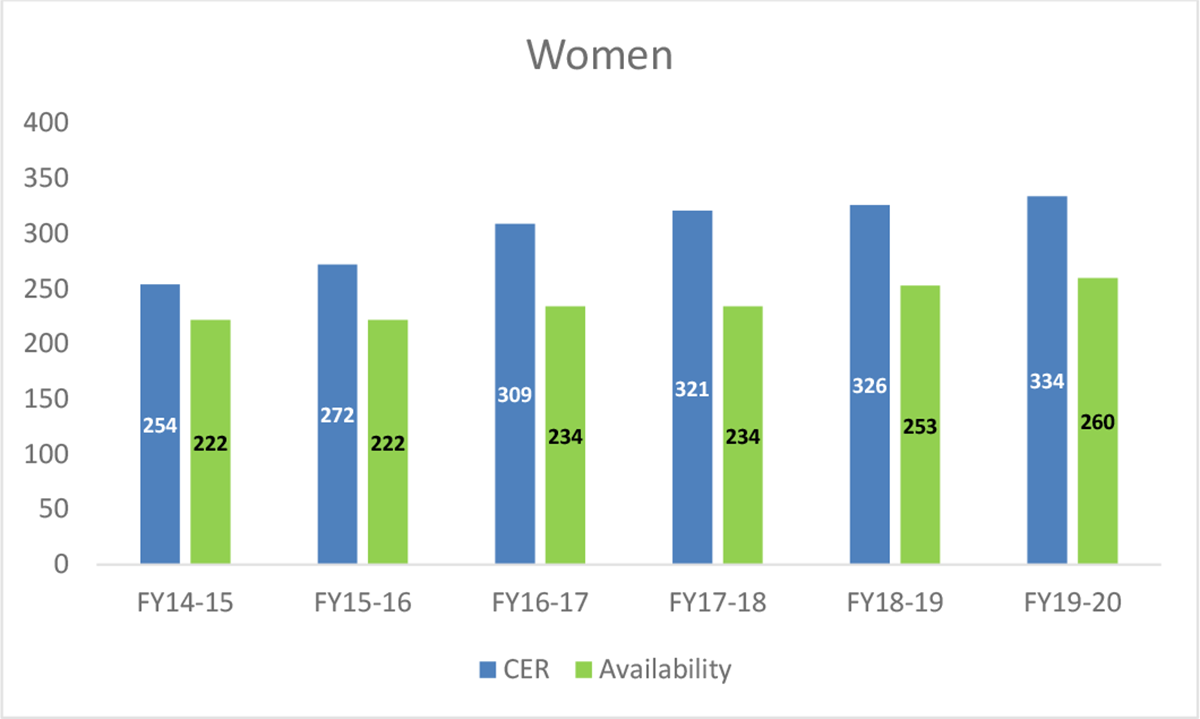
Graphic description
This bar chart compares the Canada Energy Regulator's (CER's) number of Women employees to Canada's workforce availability of Women for the fiscal years 2014/15, 2015/16, 2016/17, 2017/18, 2018/19 and 2019/20.
2014/15 CER: 254
2014/15 Canada: 222
2015/16 CER: 272
2015/16 Canada: 222
2016/17 CER: 309
2016/17 Canada: 234
2017/18 CER: 321
2017/18 Canada: 234
2018/19 CER: 326
2018/19 Canada: 253
2019/20 CER: 334
2019/20 Canada: 260
CHART 2: Employment Equity Representation: Aboriginal Peoples – 2014 to 2020

Graphic description
This bar chart compares the Canada Energy Regulator's (CER's) number of Aboriginal employees to Canada's workforce availability of Aboriginals for the fiscal years 2014/15, 2015/16, 2016/17, 2017/18, 2018/19 and 2019/20.
2014/15 CER: 18
2014/15 Canada: 5
2015/16 CER: 19
2015/16 Canada: 5
2016/17 CER: 22
2016/17 Canada: 8
2017/18 CER: 26
2017/18 Canada: 8
2018/19 CER: 25
2018/19 Canada: 12
2019/20 CER: 25
2019/20 Canada: 14
CHART 3: Employment Equity Representation: Visible Minorities – 2014 to 2020
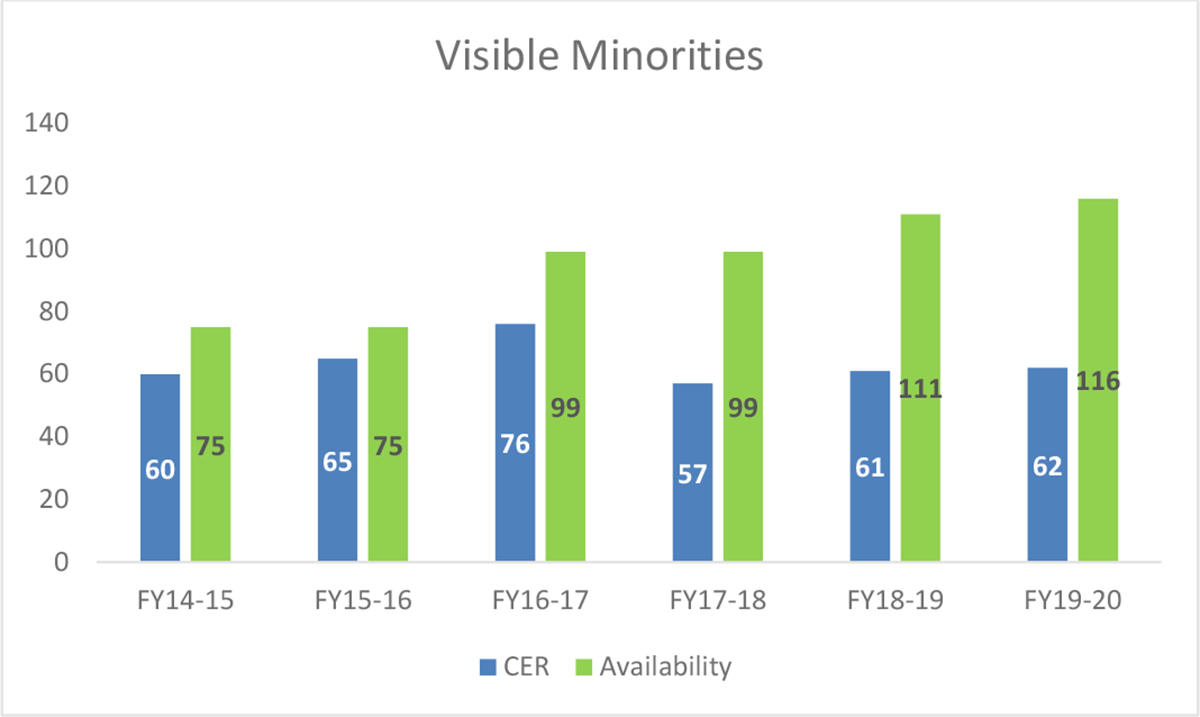
Graphic description
This bar chart compares the Canada Energy Regulator's (CER's) number of Visible Minority employees to Canada's workforce availability of Visible Minorities for the fiscal years 2014/15, 2015/16, 2016/17, 2017/18, 2018/19 and 2019/20.
2014/15 CER: 60
2014/15 Canada: 75
2015/16 CER: 65
2015/16 Canada: 75
2016/17 CER: 76
2016/17 Canada: 99
2017/18 CER: 57
2017/18 Canada: 99
2018/19 CER: 61
2018/19 Canada: 111
2019/20 CER: 62
2019/20 Canada: 116
CHART 4: Employment Equity Representation: Persons with Disabilities – 2014 to 2020
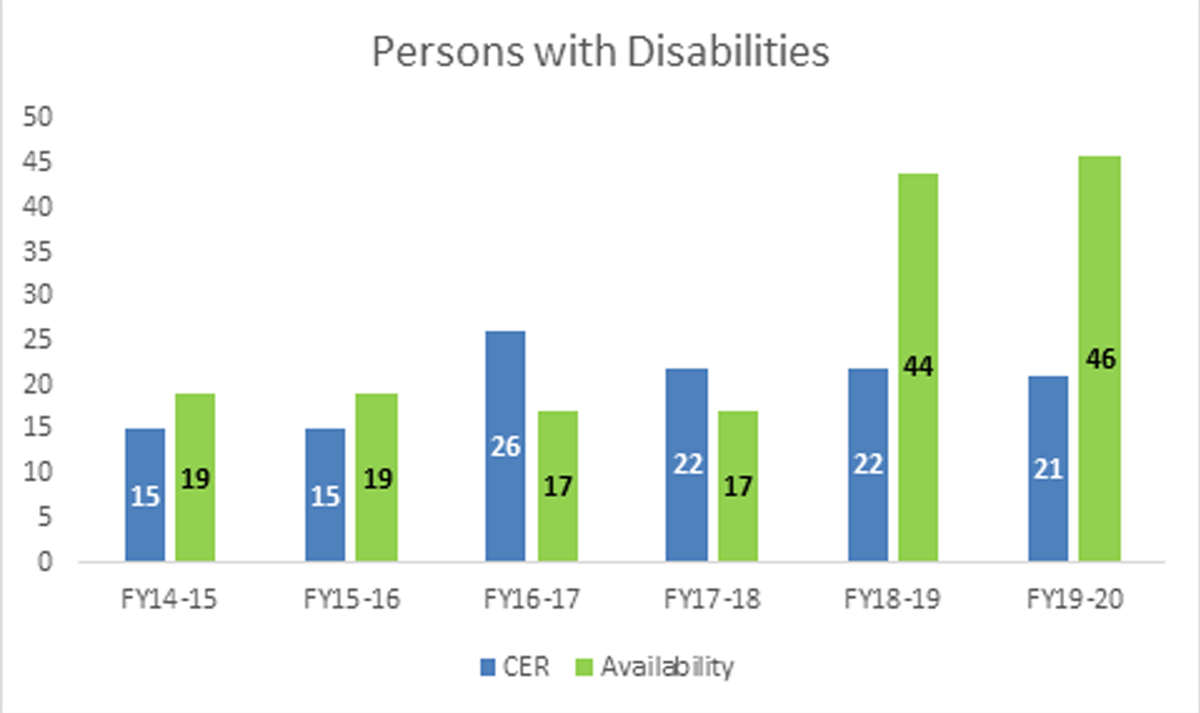
Graphic description
This bar chart compares the Canada Energy Regulator's (CER's) number of Persons with Disabilities employees to Canada's workforce availability of Persons with Disabilities for the fiscal years 2014/15, 2015/16, 2016/17, 2017/18, 2018/19 and 2019/20.
2014/15 CER: 15
2014/15 Canada: 19
2015/16 CER: 15
2015/16 Canada: 19
2016/17 CER: 26
2016/17 Canada: 17
2017/18 CER: 22
2017/18 Canada: 17
2018/19 CER: 22
2018/19 Canada: 44
2019/20 CER: 21
2019/20 Canada: 46
- Date modified: