Energy Briefing Note – Assessment of Discovered Conventional Petroleum Resources in the Northwest Territories and Beaufort Sea
Copyright/Permission to Reproduce
ISSN 978-1-100-25321-3
Energy Briefing Note
Assessment of Discovered Conventional
Petroleum Resources in the
Northwest Territories and Beaufort Sea
November 2014
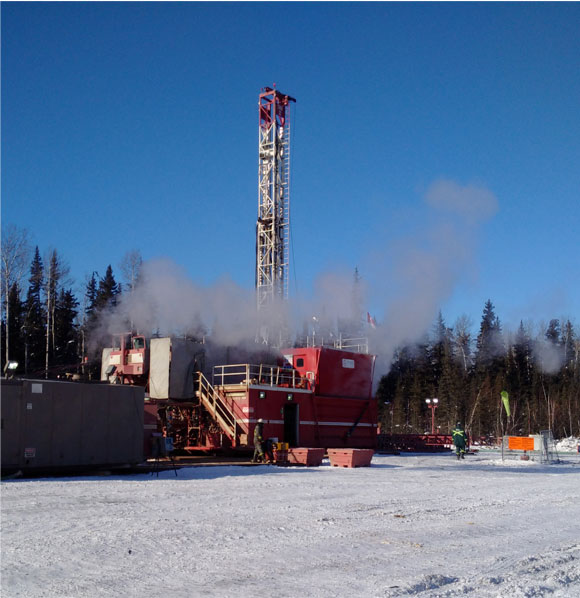


Table of Contents
- List of Units
- List of Figures
- List of Tables
- Foreword
- Executive Summary
- Introduction
- Geological Description
- Methodology
- Assessment Results and Observations
- Appendix A – Methodology
- Appendix B – Resource Estimates and Reservoir Parameters
- Endnotes
List of Units
| Tcf | = trillion cubic feet |
| 109m³ | = billion cubic metres |
| 106m³ | = million cubic metres |
List of Figures
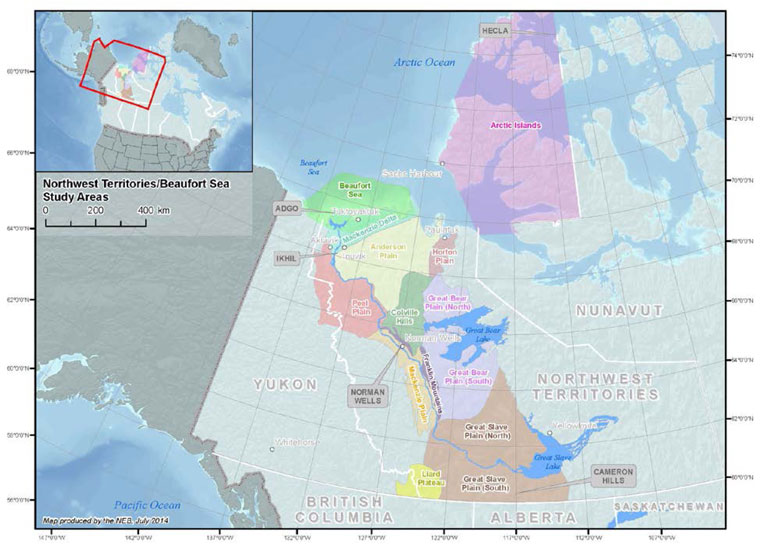
- Figure 1: Study regions
- Appendix A – Figure 1 Example of a Variable Distribution Range
- Appendix A – Figure 2 Example of Output Distribution Curve
List of Tables
- Table 1 Discovered conventional resource volumes
- Table 2 Unconnected discovered conventional petroleum resources in the NWT mainland
- Table 3 Connected discovered conventional petroleum reserves in the NWT mainland
- Table 4 Discovered conventional petroleum resources in the NWT mainland by region
- Table 5 NWT cumulative recoverable petroleum production by field
- Table 6 Discovered conventional petroleum resources in the NWT Arctic Islands
- Table 7 Discovered conventional petroleum resources in the Beaufort Sea
- Appendix A – Table 1 Example of Output Statistics
- Appendix A – Table 2 Geographic Regions, Discovered Geological Plays and Reservoir Lithology
Foreword
National Energy Board
The National Energy Board (NEB or the Board) is an independent federal regulator established to promote safety and security, environmental protection and economic interest within the mandate set by Parliament for the regulation of pipelines, energy development and trade. The Board's main responsibilities include regulating the construction and operation of interprovincial and international oil and natural gas pipelines, international power lines, and designated interprovincial power lines.
For oil and natural gas exports, the Board’s role is to evaluate whether the oil and natural gas proposed to be exported is surplus to reasonably foreseeable Canadian requirements, having regard to the trends in the discovery of oil or gas in Canada.
If a party wishes to rely on material from this report in any regulatory proceeding before the Board, it may submit the material, just as it may submit any public document. Under these circumstances, the submitting party in effect adopts the material and could be required to answer questions pertaining to its content. This report does not provide an indication about whether any application will be approved or not. The Board will decide on specific applications based on the material in evidence before it at that time.
Executive Summary
The National Energy Board has completed an assessment of discovered conventional petroleum resources in the Northwest Territories (NWT) mainland, NWT Arctic Islands and Beaufort Sea regions of northern Canada. Resource volumes are estimated at 467.0 billion m³ (16.4 Tcf) of marketable natural gas[1],[2], 195.1 million m³ (1227.8 million barrels) of crude oil[3] and 8.5 million m³ (53.3 million barrels) of natural gas liquids (NGLs) (Table 1).
The NWT mainland discoveries are estimated to have 213.8 billion m³ (7.6 Tcf) of marketable natural gas, 84.1 million m³ (529.4 million barrels) of crude oil and 8.3 million m³ (52.1 million barrels) of NGLs. In the NWT Arctic Islands, the only discovery at Hecla is estimated to have 75.2 billion m³ (2.6 Tcf) of marketable natural gas and 4.9 million m³ (31.0 million barrels) of crude oil. Beaufort Sea discoveries are estimated to have 178.0 billion m³ (6.2 Tcf) of natural gas, 106.1 million m³ (667.4 million barrels) of crude oil and 0.2 million m³ (1.2 million barrels) of NGLs.
This report concentrates on discovered conventional natural gas, NGLs and crude oil resources without establishing economic criteria related to development. Unconventional resources are not addressed in this report because of the early stage of development for this type of resource in the NWT study regions. This report and the associated data are meant to inform stakeholders, policy makers, regulators, aboriginal communities and other interested parties of the discovered resource volumes in the Northwest Territories and Beaufort Sea. This report makes no attempt to quantify undiscovered petroleum resource potential in the regions.
| Hydrocarbon Type | Expected | |||
|---|---|---|---|---|
| NWT mainland | NWT Arctic Islands | Beaufort Sea | TOTAL | |
| Natural Gas billion m³ |
213.8 | 75.2 | 178.0 | 467.0 |
| Natural Gas (trillion cubic feet) |
(7.6) | (2.6) | (6.2) | (16.4) |
| NGLs – million m³ | 8.3 | 0.0 | 0.2 | 8.5 |
| NGLs – (million barrels) | (52.1) | (0.0) | (1.2) | (53.3) |
| Oil – million m³ | 84.1 | 4.9 | 106.1 | 195.1 |
| Oil – (million barrels) | (529.4) | (31.0) | (667.4) | (1227.8) |
Introduction
The first discovery of hydrocarbons in Canada’s north was at Norman Wells along the Mackenzie River in 1920. Since then, exploration has expanded throughout the NWT mainland (Figure 1), moving west into the Mackenzie Plain, northwest into the Peel Plain and the Mackenzie Delta, and south across the southern Territories (Great Slave Plain and Liard Plateau). In 1972, Hecla was discovered offshore in the Arctic Islands (Figure 1). Offshore drilling in the Beaufort Sea started in 1973 and was successful with a discovery at Adgo in March 1974. Hydrocarbon production in Canada’s north is currently from the Norman Wells oil field, the Ikhil gas field of the Mackenzie Delta and the Cameron Hills oil field in the eastern side of the Great Slave Plain (Figure 1).
Figure 1: Study regions
Geological Description
The geology in Canada’s north can vary widely from play to play and region to region. In the NWT, excluding the Mackenzie Delta, this assessment focuses on conventional sandstone and carbonate reservoirs found in sedimentary rocks that range from Cambrian to Cretaceous in age. Individual sedimentary rock formations have gross rock thicknesses that increase going from east to west as do the depth of the reservoirs. Source rocks for many of the NWT mainland reservoirs assessed in this report are from shale formations such as the Road River, Bluefish, Canol or Mount Cap. The Mackenzie Delta and Beaufort Sea contain conventional sandstone reservoirs that are typically Tertiary and Cretaceous in age, although one Devonian carbonate reservoir has also been discovered. The sandstone reservoirs are stacked on each other and provide multiple opportunities to discover hydrocarbons. In the NWT Arctic Islands, stacked sandstone reservoirs have been discovered at Hecla in the western Sverdrup Basin. A summary of reservoir formations and lithology can be found in Appendix A – Table 2.
Methodology
The volumes of discovered conventional natural gas, NGLs and crude oil in the Northwest Territories and Beaufort Sea were estimated by:
- reviewing relevant data from wells, maps and other information sources,
- gathering input from industry and
- applying probability distributions with low, most likely, and high values to volumetric equations to determine the amount of natural gas, oil, and NGLs in place.
This methodology uses information acquired from wells that have encountered hydrocarbons. Statistical distributions were constructed and applied to drilled lands and adjacent lands where drilling is yet to occur. The output is a distribution of discovered resource volumes at various probabilities. This study uses P10, P50 and P90 probabilities for high, expected and low cases, respectively, with the uncertainty in the estimated values indicated by the spread between low and high values.
The areal extent of a petroleum accumulation is a significant uncertainty when estimating the volume of in-place hydrocarbons in a reservoir. For this study, the drainage area is based on internal mapping of pools or by assignment. For assignments to gas accumulations, an area of 130 hectares was generally used where a pool was only penetrated by a single well outside of significant discovery lands. This is the equivalent of a radius of 644 metres from a well. Likewise, for assignments to oil accumulations, an area of 64 hectares was generally used. In faulted terrain, fault blocks adjacent to a drilled block have been included with a probability of occurrence of hydrocarbons set at less than one.
Recovery and surface loss factors were then applied to in-place volumes to determine a marketable volume estimate. Only primary recovery methods were considered when determining recovery factors. Recovery factors relating to secondary and tertiary extraction techniques can vary significantly due to reservoir variability. Surface loss assumed some loss of production volume during the extraction of byproducts and removal of impurities needed to make recovered volumes fit for sale. Estimates for individual reservoirs and all reservoir data used in the analysis, including recovery and surface loss factors, can be found in Appendix B.
Assessment Results and Observations
The “low“ and “high” values, as used here, refer to a range within which there is reasonably high confidence that the real in-place and marketable (saleable) volumes will occur. However, there is a chance that actual in-place and marketable volumes could be lower than the low values or higher than the high values. While the use of the term “marketable” implies a sense of economic recovery, for the purposes of this report, “marketable” refers to a technically recoverable volume less shrinkage[4] to make volumes fit for use by consumers. No economic assessment has been done for this study. Many of the discovered resources are remote and, therefore, stranded from development until higher commodity prices can justify connecting these resources to markets.
Northwest Territories Mainland
The NWT mainland was split into eleven study regions (Figure 1) based on geography and geology. Seven of the study regions have discovered conventional petroleum resources in them.
The volume of discovered marketable resources and reserves for conventional oil and gas in the NWT mainland (Tables 2 and 3 combined) is currently estimated to be 213.8 109m³ (7.6 Tcf) for natural gas, 8.3 106m³ (52.1 million barrels) for NGLs and 84.1 106m³ (529.4 million barrels) for crude oil. The numbers in the tables may not add up due to rounding.
Table 2 shows the volumes of unconnected conventional petroleum resources. Table 3 identifies the amount of discovered reserves that have been or are connected to the market by pipeline and have reported production.
| Hydrocarbon Type | In-Place | Marketable | ||||
|---|---|---|---|---|---|---|
| Low | Expected | High | Low | Expected | High | |
| Natural Gas – Non-associated billion m³ |
108.9 | 254.4 | 511.2 | 74.1 | 172.9 | 368.7 |
| Natural Gas – Non-associated (trillion cubic feet) |
(3.8) | (9.0) | (18.0) | (2.6) | (6.1) | (13.0) |
| Natural Gas – Associated billion m³ |
5.0 | 12.7 | 26.2 | 3.4 | 8.7 | 18.2 |
| Natural Gas – Associated (trillion cubic feet) |
(0.2) | (0.4) | (0.9) | (0.1) | (0.3) | (0.6) |
| Natural Gas – Solution billion m³ |
7.6 | 16.7 | 31.4 | 4.6 | 10.2 | 19.4 |
| Natural Gas – Solution (trillion cubic feet) |
(0.3) | (0.6) | (1.1) | (0.2) | (0.4) | (0.7) |
| NGLs – million m³ | 3.0 | 8.3 | 19.2 | |||
| NGLs – (million barrels) | (18.7) | (52.1) | (120.7) | |||
| Oil – million m³ | 114.1 | 238.0 | 424.1 | 13.2 | 30.1 | 59.3 |
| Oil – (million barrels) | (717.9) | (1497.0) | (2667.4) | (83.2) | (189.6) | (373.0) |
| Hydrocarbon Type | In-Place | Marketable | ||||
|---|---|---|---|---|---|---|
| Low | Expected | High | Low | Expected | High | |
| Natural Gas – Non-associated billion m³ |
* | * | * | * | 13.8 | * |
| Natural Gas – Non-associated (trillion cubic feet) |
(0.5) | |||||
| Natural Gas – Associated billion m³ |
* | * | * | * | 0.8 | * |
| Natural Gas – Associated (trillion cubic feet) |
(<0.1) | |||||
| Natural Gas – Solution billion m³ |
* | * | * | * | 7.4 | * |
| Natural Gas – Solution (trillion cubic feet) |
(0.3) | |||||
| NGLs – million m³ | * | * | * | * | * | * |
| NGLs – (million barrels) | ||||||
| Oil – million m³ | * | * | * | * | 54.0 | * |
| Oil – (million barrels) | (339.8) | |||||
| *Estimates not available from cumulative production analysis | ||||||
Table 4 shows the estimates of discovered conventional resources by study region and includes those reserves listed in Table 3.
| Region | Marketable (Expected) | ||
|---|---|---|---|
| Natural Gas billion m³ (Tcf) |
NGLs million m³ (million barrels) |
Oil million m³ (million barrels) |
|
| Anderson Plain | 0 | 0 | 0 |
| Colville Hills | 17.8 (0.6) | <0.1 (0.1) | 1.3 (8.1) |
| Great Bear Plain (North) | 0 | 0 | 0 |
| Great Bear Plain (South) | 0 | 0 | 0 |
| Great Slave Plain (North) | <0.1 (<0.1) | 0 | 0 |
| Great Slave Plain (South) | 2.5 (<0.1) | 0 | 0.5 (3.4) |
| Horton Plain | 0 | 0 | 0 |
| Liard Plateau | 14.2 (0.5) | 0 | <0.1 (<0.1) |
| Mackenzie Delta | 160.8 (5.7) | 8.3 (52.0) | 28.8 (181.0) |
| Mackenzie Plain | 18.3 (0.6) | 0 | 53.5 (336.7) |
| Peel Plain | <0.1 (<0.1) | 0 | 0 |
Table 5 summarizes hydrocarbon production from fields in the NWT up to 31 December 2013.
| Field | Gas Production million m³ (billion cubic feet) |
Oil Production million m³ (million barrels) |
Field Status |
|---|---|---|---|
| Norman Wells | 4830 (170.5) | 43.5 (273.6) | Producing |
| Ikhil | 206 (7.3) | Producing | |
| Cameron Hills | 522 (18.4) | 0.4 (2.5) | Producing |
| Pointed Mountain | 8865 (312.9) | Abandoned | |
| Fort Liard | 252 (9.0) | Suspended | |
| For Liard SE | 233 (8.2) | Suspended | |
| Liard | 3887 (137.2) | Suspended | |
| Liard North | 62 (2.2) | Suspended |
Northwest Territories Arctic Islands
The discovered marketable resources for conventional oil and gas in the NWT Arctic Islands (Table 6) are currently estimated to be 75.2 109m³ (2.6 Tcf) for marketable gas and 4.9 106m³ (31.0 million barrels) of crude oil. The estimates are from one discovery at Hecla.
| Hydrocarbon Type | In-Place | Marketable | ||||
|---|---|---|---|---|---|---|
| Low | Expected | High | Low | Expected | High | |
| Natural Gas – Non-associated billion m³ |
34.5 | 95.0 | 198.7 | 23.8 | 67.5 | 145.4 |
| Natural Gas – Non-associated (trillion cubic feet) |
(1.2) | (3.4) | (7.0) | (0.8) | (2.4) | (5.1) |
| Natural Gas – Associated billion m³ |
4.0 | 10.1 | 20.6 | 2.7 | 6.6 | 12.4 |
| Natural Gas – Associated (trillion cubic feet) |
(0.1) | (0.4) | (0.8) | (<0.1) | (0.2) | (0.4) |
| Natural Gas – Solution billion m³ |
0.7 | 1.9 | 3.8 | 0.4 | 1.1 | 2.4 |
| Natural Gas – Solution (trillion cubic feet) |
(<0.1) | (<0.1) | (0.1) | (<0.1) | (<0.1) | (<0.1) |
| Oil – million m³ | 19.3 | 51.4 | 101.1 | 1.9 | 4.9 | 10.4 |
| Oil – (million barrels) | (121.6) | (323.3) | (636.5) | (11.7) | (31.0) | (65.6) |
Beaufort Sea
The discovered marketable resources for conventional oil and gas in the Beaufort Sea (Table 7) are currently estimated to be 178.0 109m³ (6.3 Tcf) for marketable gas, 0.2 106m³ (1.2 million barrels) of NGLs and 106.1 106m³ (667.4 million barrels) of crude oil. There are currently no authorizations to drill exploratory wells or produce from discovered fields in the Beaufort Sea.
| Hydrocarbon Type | In-Place | Marketable | ||||
|---|---|---|---|---|---|---|
| Low | Expected | High | Low | Expected | High | |
| Natural Gas – Non-associated billion m³ |
39.0 | 115.8 | 271.0 | 28.5 | 85.7 | 201.5 |
| Natural Gas – Non-associated (trillion cubic feet) |
(1.4) | (4.1) | (9.6) | (1.0) | (3.0) | (7.1) |
| Natural Gas – Associated billion m³ |
16.4 | 47.5 | 108.7 | 11.8 | 34.0 | 77.6 |
| Natural Gas – Associated (trillion cubic feet) |
(0.6) | (1.7) | (3.8) | (0.4) | (1.2) | (2.7) |
| Natural Gas – Solution billion m³ |
37.1 | 95.2 | 193.3 | 22.6 | 58.3 | 119.4 |
| Natural Gas – Solution (trillion cubic feet) |
(1.3) | (3.4) | (6.8) | (0.8) | (2.0) | (4.2) |
| NGLs – million m³ | <0.1 | 0.2 | 0.4 | |||
| NGLs – (million barrels) | (0.4) | (1.2) | (2.8) | |||
| Oil – million m³ | 309.1 | 781.9 | 1519.4 | 33.8 | 106.1 | 217.0 |
| Oil – (million barrels) | (1944.1) | (4917.9) | (9556.8) | (212.5) | (667.4) | (1364.6) |
Appendix A
Methodology
The methodology for the analysis of the NWT and Beaufort Sea areas is based on the application of @Risk statistical simulations of reservoir data through volumetric equations to derive in-place, recoverable and marketable hydrocarbon estimates.
In this report, only conventional discoveries were examined. @Risk simulations were based on triangular distributions assigned to all reservoir parameters[5] with the expected parameter values estimated from well log and core analysis. The Board then used a “Latin Hypercube” sampling technique, which arrives at a stabilized result faster than Monte Carlo sampling. A five thousand sample iteration run was standard for pool volume estimates. Stabilized results were observed to occur around the four thousand iteration count. The final results are displayed as outputs in the form of statistics (Table 1) and curve distributions (Figure 2) for hydrocarbon volumes. This report provides the P10, P50, mean and P90 values for the various categories of hydrocarbon estimates.
Key Assumptions
- No study was undertaken to determine individual field economics for marketable resources.
- Since production data is very limited, recovery efficiency and surface loss factors are based on the Board’s general understanding of best practices for primary recovery. Recovery factors may be different in the future as technology advances. Should oil and gas fields be developed with advances in technology, the Board’s assigned recovery factors may change.
Petroleum Resource Equations
Petroleum resource estimates relied on modified equations to calculate in-place, recoverable and marketable volumes. The equations used are:
IMG = PO × A × H × ρeffective × (1-Swater) × (Pinitial × Tsurface)/ (Z × Tinitial) × Psurface) × RE × (1-SL)
for initial marketable gas estimates.
Condensate volume (CV) was estimated using:
CV = PO × A × H × ρeffective × (1-Swater) × (Pinitial × Tsurface)/ (Z × Tinitial) × Psurface) × RE × CR
Recoverable oil (RO) estimates used:
RO = PO × A ×H × ρeffective × (1-Swater) × (1/Boi) × RE
Solution gas (SG) marketable estimates used:
SG = PO × A × H × ρeffectivee × (1-Swater) × (1/Boi) × GOR × RF × SL
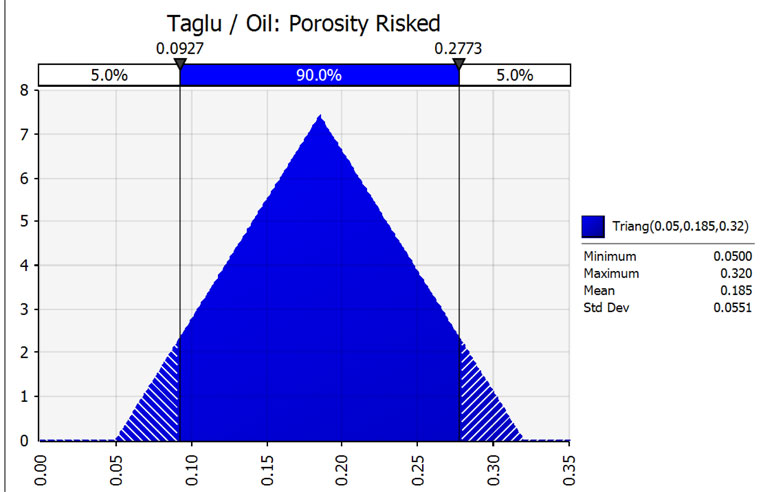
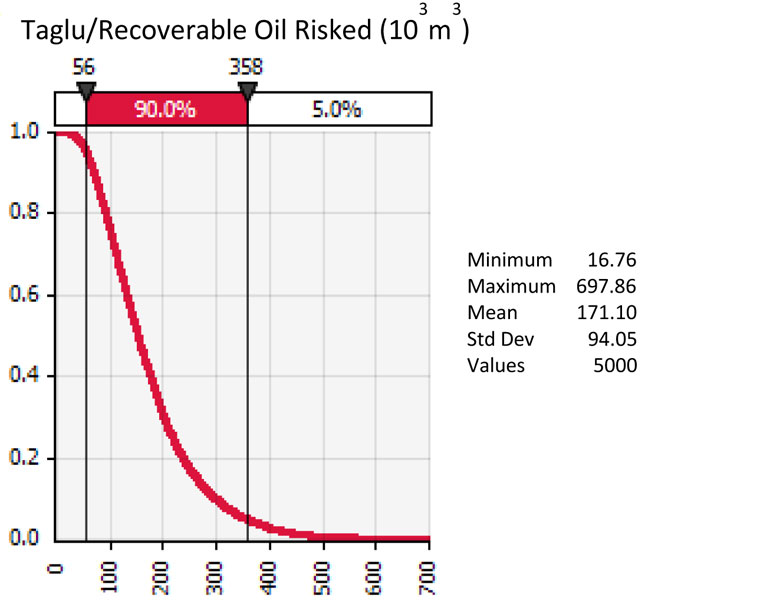
For each variable in the equations, a range is determined for triangular distribution in the simulation (Figure 1). Table 1 provides the results of a simulation run with highlighted key estimates that are found in Appendix B. Figure 2 is the summary graph based on the values from Table 1. All reservoir parameters used in the simulation are available in Appendix B.
Figure 1 Example of Output Distribution Curve
| Summary Statistics for Taglu / Recoverable Oil Risked (10³m³) | |||
| Statistics | Percentile | ||
|---|---|---|---|
| Minimum | 16.763 | 5% | 55.548 |
| Maximum | 697.861 | 10% | 70.271 |
| Mean | 171.101 | 15% | 81.279 |
| Std Dev | 94.052 | 20% | 92.391 |
| Variance | 8845.759146 | 25% | 102.289 |
| Skewness | 1.229546809 | 30% | 111.890 |
| Kurtosis | 5.089644775 | 35% | 122.366 |
| Median | 152.642 | 40% | 131.835 |
| Mode | 114.426 | 45% | 142.119 |
| Left X | 55.548 | 50% | 152.642 |
| Left P | 5% | 55% | 163.713 |
| Right X | 358.056 | 60% | 176.870 |
| Right P | 95% | 65% | 189.000 |
| Diff X | 302.508 | 70% | 201.963 |
| Diff P | 90% | 75% | 218.070 |
| #Errors | 0 | 80% | 237.226 |
| Filter Min | Off | 85% | 262.870 |
| Filter Max | Off | 90% | 297.007 |
| #Filtered | 0 | 95% | 358.056 |
Figure 2 Example of Output Distribution Curve
Stratigraphic Intervals
Table 2 shows general information regarding each region and its discovered play stratigraphy with rock lithology. More specific play and rock descriptions can be found in other studies such as the Geological Survey of Canada Open File 6757 report in the Geological Survey of Canada library.
| Geographical Region | Discovered Plays by Formation | Reservoir Lithology |
|---|---|---|
| South Great Slave Plain | Chinkeh, Mattson, Slave Point, Sulphur Point, Keg River, Arnica, Manetoe, Nahanni | sandstone, sandstone, limestone, dolostone, dolostone, limestone, dolostone, dolostone |
| North Great Slave Plain | Slave Point | limestone |
| Liard Plateau | Manetoe, Nahanni | dolostone, dolostone |
| South Great Bear Plain | no discoveries | |
| North Great Bear Plain | no discoveries | |
| Mackenzie Plain | Little Bear, Martin House, Bear Rock, Franklin Mountain | sandstone, sandstone, limestone, dolostone |
| Mackenzie Delta | Atkinson Point, Aklak, Arctic Red, Kugmallit, Kamik, Taglu, Richards, Martin Creek, Landry | all are sandstone except Landry (limestone) |
| Colville Hills | Mount Cap, Mount Clark | siltstone, sandstone |
| Peel Plain | Landry | limestone |
| NWT – Arctic Islands | King Christian | sandstone |
| Beaufort Sea | Aklak, Akpak, Kugmallit, Mackenzie Bay, Taglu | all are sandstone |
| Beaufort Sea | Arnica | limestone |
Appendix B
Resource Estimates and Reservoir Parameters
Resource estimates and accompanying data can be downloaded from the attached spreadsheet [EXCEL 1008 KB]. Detailed reservoir data from producing fields is not included.
Endnotes
[1] The term “marketable” implies a sense of economic recovery. However, for the purposes of this report, “marketable” only refers to a technical volume with removal of byproducts and impurities needed to make recovered volumes fit for sale. No economic assessment was performed for this study.
[2] Gas conversion factor: 1 cubic metre = 35.30096 cubic feet
[3] Oil and NGL conversion factor: 1 cubic metre = 6.2897 barrels
[4] Shrinkage accounts for removal of impurities such as carbon dioxide (CO2) or hydrogen sulfide (H2S) in order to meet pipeline specifications.
[5] Parameters included area (A), net pay (H), porosity (ρ), fluid saturation (S), pressure (P), temperature (T), formation volume (Boi), gas compressibility factor (Z), condensate-gas ratio (CR), gas-to-oil ratio (GOR), probability of occurrence (PO), recovery efficiency (RE) and surface loss (SL) factors
- Date modified: