Offshore Physical Environmental Guidelines
Appendix A – Forecast Verification
A.1 Overview
A.2 Recommended Parameters for Verification
A.3 Observations
A.4 Forecasts
A.5 Time Series Plots
A.6 Verification Statistics
A.6.1 Error
A.6.2 Bias
A.6.3 Mean Absolute Error
A.6.4 Root Mean Square Error
A.6.5 Skill Score
A.7 Threshold Analysis
A.7.1 Percent Correct
A.7.2 Probability of Detection
A.7.3 False Alarm Rate
A.4.4 Missed Event Rate
A.1 - Overview
Forecast verification is performed to enable offshore operators to assess the skill and reliability of the forecast program. Confidence in the forecast will enable the operator to use the forecast as guidance for making operational decisions.
In order to provide reliable forecasts and verification statistics it is incumbent on the operator to provide the forecasting contractor with access to accurate and timely observations.
Verification statistics are a measure of the agreement between forecasts and observations. Hence, they are an indication of the joint effectiveness of the observing and forecasting programs. Verification information should be updated and presented to forecast-users in as near real-time as possible.
The principal objectives of forecast verification are:
- evaluation of the accuracy of the forecasts;
- evaluation of the accuracy and representativeness of observations;
- investigation of trends in the forecasts, and thereby improvement of their quality; and,
- improved knowledge of the impact of weather and weather information on offshore operations, as a means of risk assessment.
It is recommended that a forecast verification analysis, as presented in this Appendix, be an integral component of the forecast program.
A.2 Recommended Parameters for Verification
The key parameters that impact on an offshore marine operation are wind speed, wind direction and wave height. It is recommended that these parameters, as a minimum, be verified for all forecast programs. Where tactical ice forecasts are required, predictions of ice or iceberg positions should be verified as well. Other parameters, such as air temperature and visibility may be worthy of consideration depending upon their importance to the operation.
The Operator is responsible for determining which forecast parameters are verified.
A.3 Observations
An observation value used for verification purposes should correspond as closely as possible with the corresponding forecast parameter definition (see next section). This correspondence may be difficult to achieve because of observation limitations due to imperfect siting of instruments, and other factors. Obstructions from the Installation superstructure and thermal effects, for example, can prevent instruments from recording ambient conditions.
For example, it may be necessary to:
- Remove any known bias from the observations. In the case of wind observations there may be both speed- and direction-dependent observational errors that should be removed before observations are used in a verification analysis.
- Apply any spatial and/or temporal averaging to match observation definitions with those of the corresponding forecast parameters.
- Apply any necessary adjustments to make observations and forecast reference the same height above sea level.
- Apply any necessary physical derivations. An example would be to verify humidity forecasts using dry-bulb and wet-bulb temperature measurements.
Further, observations used in the verification system must correspond in definition to the forecast parameters to be verified (see the next section). For example, the following formula may be used to process observations used in a verification system:
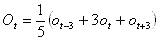 Equation 1
where the ot are observed winds for the valid time t, 3 hours prior to the valid time, and 3 hours after the valid time. Marine wind observations (i.e. MANMAR [5] winds) may be processed using Equation 1, for example. Different expressions would be used if aviation observations or "sensor values" were used in the verification system.
A.4 Forecasts
Precise definitions of the forecast parameters being verified are required. That is, the following must be defined for each forecast parameter:
- the applicable horizontal and vertical spatial area;
- the vertical reference height;
- the temporal representativeness; and,
- the (sampling) averaging interval.
For example, 10-minute averaged forecast winds valid at an anemometer height of 60 metres, may be verified. The forecast winds may represent a 6-hour time period centred on the forecast valid time, according to the averaging formula:
 Equation 2
where the ft are forecast 10-minute-average winds for the valid times t, 3 hours prior to, and 3 hours after the valid time. The definitions of forecast parameters should be well known to all users of the forecast.
A.5 Time Series Plots
A set of monthly time-series plots of forecast and observed parameters is a recommended component of the verification. As discussed in Section A.3 any calculations required to make observations and forecasts correspond shall be performed prior to plotting. Plots for the 12, 24, 36 and 48 hour forecast lead times may be plotted. For the purposes of verification, lead times shall be based on the date/time of the latest completed synoptic analysis upon which the forecast is based. For example, a forecast issued at 240700 UTC, based upon a 240000 UTC synoptic analysis, shall have a 36 hour validation time at 251200 UTC. Consistent vertical and time axes should be used. It is useful to plot any operational threshold values on the time-series plots.
A.6 Verification Statistics
A set of verification statistics is recommended. The following statistics are described in the following sub-sections:
- Error
- Bias
- Mean Absolute Error
- Root Mean Square Error
- Skill Score
A.6.1 Error
The difference between the forecast and the observation, at a given time t, is given by:
 Equation 3
The forecast error is given by:
 Equation 4
and the observing error is:
 Equation 5
where Tt is the "true value," that is, the value that would be measured by an unbiased (i.e. perfect) instrument. The above definitions for error show that:
 Equation 6
That is, both the forecast and the observation have error components. Observation errors should be removed, if possible, before observations are used in a verification system. Otherwise the verification statistics unduly reflect errors in both the observation and forecast programs. Observation error assessment is an observing program quality assurance procedure.
A.6.2 Bias
The bias is given by:
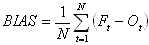 Equation 7
The bias indicates the average of the deviation of the forecast from the observations. The bias can be either negative or positive. Bias is a measure of the "direction" (i.e. positive or negative) but not the magnitude of the errors, and should be near zero.
A.6.3 Mean Absolute Error
The mean absolute error (MAE) is given by:
 Equation 8
This statistic gives a measure of the average magnitude of errors, but does not indicate the direction of the errors. The MAE is always positive and less than or equal to the root mean square error.
A.6.4 Root Mean Square Error
The root mean square error (RMSE) is given by:
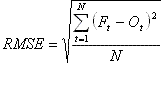 Equation 9
This statistic also gives a measure of the average magnitude of errors, and does not indicate the direction of errors. Compared to the MAE, the RMSE gives greater weight to large errors than to small errors in the average. That is, if RMSE is much greater than MAE then a high frequency of large errors is indicated. It is therefore an appropriate statistic to use when large errors are particularly undesirable. This statistic encourages "hedging," as a forecaster can reduce the RMSE by forecasting in the mid-range of possible outcomes (i.e. not predicting extreme values).
A.6.5 Skill Score
The skill score is given by:
 Equation 10
where:
| R | is the number of correct forecasts |
| T | is the total number of forecasts |
| E | is the number expected to be correct based on climatological values for the given area derived from hindcast marine wind and wave data (for example AES40 hindcast data [13]) for the local area. |
Note that:
| SS | = 1 when all forecasts are correct; |
| = 0 when number correct is equal to expected; and, | |
| = a negative value when the forecast has negative skill with reference to knowledge of the local climate. |
The skill score thus defined, expresses as a decimal fraction the percentage of forecasts which are correct after those forecasts have been eliminated from consideration which would have been correct on the basis of the knowledge of local climate.
Characteristics of the Skill Score are:
- The range of the skill score is from +1 to -minus infinity, where minus infinity is mathematically possible with a perfect standard forecast (E=T and E>R) and is independent of how accurate the actual forecast has been (only limitation E>R).
- The better the climatological data standard, the smaller the skill score for a set number of forecasts. Also the smaller the set of forecasts, the more likely the standard will, by accident, be very good and hard to beat.
- Where two different skilled forecast techniques are applied to a representative set of data, the one yielding the larger positive score will be the more useful.
- The skill score is a good parameter for comparing forecasts from different climate regions.
- The skill score is primarily a summary score.
In summary, the skill score is sensitive to the climatological figure used in the calculation. However, it is an important indicator in the assessment of forecasting accuracy. A score between zero and one indicates that forecasts are skillful relative to climatology.
A.7 Threshold Analysis
Threshold values are defined to establish operational requirements. The Operator generally wants to know the accuracy of forecasts against agreed operational thresholds. The selection of the threshold for wind speed and wave height should be related to the area of operation, type of facility, and the nature of critical operations. The Operator, in conjunction with the contractor, should select the thresholds for which the forecast verifications will be undertaken.
To obtain meaningful results, a threshold analysis should be calculated on the basis of a reasonable time frame that will provide a sufficient number of threshold-exceeded events. For longer drilling or production programs the statistics should be calculated on a seasonal basis, while for shorter (1 to 4 months) drilling programs the duration of the drilling or production program may be a more reasonable time frame for the calculations.
In the threshold analysis, forecast and observed values are allocated to one of four contingencies:
- Forecast correctly predicts that the threshold value is exceeded.
- Forecast correctly predicts that the threshold value is not exceeded.
- Forecast incorrectly predicts that the threshold value is exceeded (false alarm).
- Forecast incorrectly predicts that the threshold value is not exceeded (missed event).
The probability of detection, false alarm rate and missed event rate are obtained from a contingency table (Table A-1). The aim is to achieve as high a probability of detection as possible while keeping the missed event and false alarm rates as low as possible. The false alarm rate equates to unnecessary cost, while the missed event rate has both cost and safety implications.
The threshold contingency table is given by Table A-1.
Table A-1 - Threshold Analysis Contingency Table
| Forecast (f) | ||||
|---|---|---|---|---|
| Threshold exceeded | Threshold not exceeded | Totals | ||
| Observed (o) |
Threshold exceeded |
 |
 |
No>=t |
| Threshold not exceeded |
 |
 |
No<t | |
| Totals | Nf>=t | Nf<t | Ntotal | |
where:
| o | = Observed value. |
| f | = Forecast value. |
| t | = Threshold value. |
|
|
= Number of times observed value exceeds threshold, and forecast value exceeds threshold. |
|
= Number of times observed value exceeds threshold, and forecast value does not exceed threshold. |
|
|
= Number of times observed value does not exceed threshold value, and forecast value exceeds threshold. |
|
|
= Number of times observed value does not exceed threshold, and forecast value does not exceed threshold. |
| Nf>=t | = Number of times forecast exceeds threshold (and similarly for the other totals) |
The following subsections describe useful threshold verification statistics.
A.7.1 Percent Correct
The percent correct (PC) is given by:
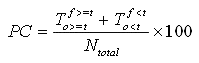 Equation 11
The range of this statistic is zero to 100.
A.7.2 Probability of Detection
The probability of detection (POD) is a measure of the ability of the forecast program to successfully predict the “threshold exceeded” event.
The POD is given by:
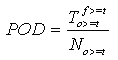 Equation 12
The range of this statistic is zero to 1.
A.7.3 False Alarm Rate
The false alarm rate (FAR) is a measure of the incorrect prediction of the "threshold exceeded" event.
The FAR is given by:
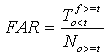 Equation 13
The range of this statistic is zero to 1.
A.7.4 Missed Event Rate
The missed event rate (MER) is a measure of the incorrect prediction of the "threshold not exceeded" event.
The MER is given by:
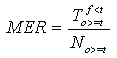 Equation 14
The range of this statistic is zero to 1.
- Date modified: