Pipeline Profiles: Cochin Pipeline
Pipeline system and key points
Section updated December 2021
The Cochin Pipeline receives condensate from the Explorer, TEPPCO and Wabash pipelines at its Kankakee, Illinois, terminal and delivers it to Fort Saskatchewan, Alberta. At Fort Saskatchewan, the Cochin Pipeline connects with several terminals and pipelines that are used to store and deliver condensate to oil sands production sites in Alberta.
The Cochin Pipeline commenced operations in 1979. CER-regulated assets include approximately 1 000 km of operating pipeline and various auxiliary infrastructure. Cochin originally moved products (solely propane in recent years) eastward from Fort Saskatchewan to Windsor, Ontario. In March 2014, the direction of flow on the segment of the Cochin Pipeline from Kankakee, Illinois, to Fort Saskatchewan was reversed to transport condensate westbound. The reversed pipeline started operations in July 2014.
In May 2016, the Board granted leave for Kinder Morgan Cochin ULC to sell to Kinder Morgan Utopia ULC the Eastern Portion of the Cochin Pipeline in Canada from the international border near Detroit, Michigan, to Windsor, Ontario. In November 2017 the Governor in Council amended the authorization for the Cochin Pipeline reflecting removal of the Canadian Eastern Portion of the Cochin Pipeline.
The Eastern Portion of the Cochin Pipeline in Canada now operates as the Canadian portion of the Utopia Pipeline. The pipeline went into service in January 2018 delivering ethane from Harrison County, Ohio to Windsor, Ontario. The U.S. portion of the Utopia project consists of a new pipeline from a point in Harrison County, Ohio to a connection with existing Kinder Morgan pipeline and facilities near Riga, Michigan. The initial capacity of the Utopia Pipeline is 50 000 barrels per day (b/d), which is expandable to more than 75 000 b/d.
Pipeline map
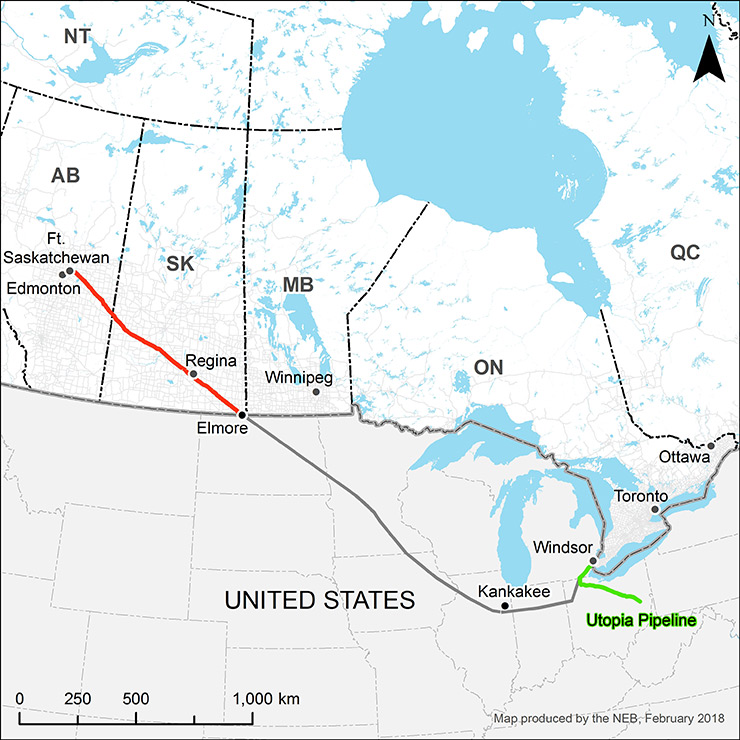
Source: CER
Text version of this map
This map provides an overview of the Cochin Pipeline.
In December 2019 Kinder Morgan Cochin ULC, the owner of the pipeline, changed its name to PKM Cochin ULC (PKM). PKM is a wholly owned subsidiary of Pembina Pipeline Corporation.
Official CER documents related to the construction, operation and maintenance of the Cochin Pipeline can be found here: Cochin pipeline regulatory documents [Folder 457425] and [Folder 3890927].
You can see Cochin Pipeline and all CER-regulated pipelines on the CER’s Interactive Pipeline Map. The map shows more detailed location information, the products carried by each pipeline, the operating status and more.
Throughput and capacity
Section updated quarterly (early March, mid-May, mid-August and mid-November)
Select key point:
Select units:
Key Point Map
Key Point Trends
Key Point Description
Note: The physical capacity of a pipeline is based on many factors such as the products being carried, direction of flow, pipeline pumping capacity, and maintenance work or other pressure restrictions. The actual physical capacity of the pipeline may, at times, be higher than the assumed operational capacity stated here.
Dashboard instructions
- Click on a key point button above the chart & map to view traffic at a different location. The map shows approximate locations on the pipeline where throughputs & capacity are recorded by the pipeline operator.
- Click and drag your mouse on the area chart to zoom into the desired date range. Click on the Reset Zoom button to reset the full date range.
- Click on the chart legend items below the chart to remove & add sections of data as required.
- The key point trends are calculated using quarterly average traffic at the key point. Natural gas throughput trends are displayed year over year (last full quarter of data compared to the same quarter last year). Crude oil and liquids key point trends are displayed quarter over quarter (last full quarter of data compared to the previous quarter).
Note: The five-year average is calculated for natural gas key points using the total throughput across all trade types and direction of flows. For bi-directional key points (both export and import) the throughput is displayed for both directions, instead of the five-year average.
Source and description
Data Source: Open Government
Description: The above dashboard displays pipeline throughput and capacity at key point(s) along the system. Where possible, the five-year average and five-year range for throughput is shown with the current year throughput to better highlight the trends. For pipeline key points with a defined location, a map is displayed next to the graph showing the approximate key point location where pipeline throughput and capacity are recorded.
Apportionment
Section updated quarterly (early March, mid-May, mid-August and mid-November)
A shipper must submit nominations each month it wishes to move its oil on a pipeline. Shippers must submit nominations for both committed (or contracted) transportation service, if available, as well as uncommitted transportation service. If the total volume of nominations for uncommitted capacity is more than what is available, the pipeline company must “apportion” the nominations.
Apportionment is the percentage by which each shipper’s nominated volume is reduced in order to match the pipeline’s uncommitted capacity. Generally, apportionment is applied equally across all shippers seeking to use that capacity: for example, if shipper A nominates 100 barrels and shipper B nominates 1 000 barrels, then, under 10% apportionment, shipper A will be able to ship 90 barrels, and shipper B will ship 900 barrels.
The interactive graph below shows data for nominations and apportionment on the pipeline system.
Select units:
Source and description
Data Source: Open Government
Description: The above chart displays pipeline nomination data for the pipeline system. Original nominations are shown as a blue area on the chart, with available pipeline capacity shown as a yellow line. If available, the apportionment percent can be toggled onto the chart as a green line by clicking on “Apportionment Percent” directly below the chart.
Tolls
Section updated December 2021
A toll is the price charged by a pipeline company for transportation and other services. Tolls allow pipeline companies to safely operate and maintain pipelines. Tolls also provide funds for companies to recover capital (the money used to build the pipeline), pay debts, and provide a return to investors. The interactive graph below shows tolls on key paths on the pipeline since 2014.
Open data can be freely used and shared by anyone for any purpose. The data for these graphs are available.
Cochin has been regulated on a complaint basis since 1986. Cochin provides condensate service to committed shippers from Kankakee County, Illinois; Clinton, Iowa; and Masback, North Dakota based on international joint tolls. Cochin reserves 10% of its capacity for uncommitted service with an uncommitted toll for local Canadian shipments and an international joint toll for shipments originating in the United States. Committed tolls vary according to the volume of condensate that a shipper commits to the Pipeline. Official CER documents related to the traffic, tolls and tariffs for the Cochin Pipeline can be found here: PKM Cochin toll filings [Folder 3901918]
Previous filings are available here:
- Kinder Morgan Cochin ULC toll filings [Folder 472901]
- Cochin Pipe Lines Ltd. toll filings [Folder 155665]
Abandonment funding
Section updated January 2024
The CER requires all pipelines to set aside funds to safely cease operation of a pipeline at the end of its useful life. In 2016, the owner of the pipeline estimated it would cost approximately $28 million to do this. These funds will be collected from shippers over a period of 19.5 years and are being set aside in a trust.
| 2018 | 2019 | 2020 | 2021 | 2022 | |
|---|---|---|---|---|---|
| Trust fund balance ($) | 6,860,000 | 8,809,000 | 11,537,000 | 12,837,000 | 12,265,000 |
Official CER documents related to abandonment funding can be found here, sorted by year and by company: abandonment funding documents [Folder 3300366].
Pipeline financial information
Financial resource requirements
Section updated December 2021
The Canadian Energy Regulator Act requires oil pipeline companies to set aside funds to pay for the costs of any incident that occurs, such as a spill. See sections 136 to 142 of the Act for more information. Kinder Morgan Cochin has demonstrated that it has financial resources in excess of $300 million dollars. Official CER documents related to Cochin’s financial resources can be found here: Kinder Morgan Cochin ULC/PKM financial resource requirements documents [Folder 2985182]
Cochin Pipeline financial information
Section updated January 2024
Pipeline companies report important financial information to the CER quarterly or annually. A strong financial position enables companies to maintain their pipeline systems, attract capital to build new infrastructure, and meet the market’s evolving needs. The data in this table comes from CER’s quarterly filings with the CER [Folder 472902].
| 2014 | 2015 | 2016 | 2017 | 2018 | 2019 | 2020 | 2021 | 2022 | |
|---|---|---|---|---|---|---|---|---|---|
| Revenues (million $) | 30 | 50 | 54 | 53 | 55 | 62 | 65 | 64 | 78 |
| Rate base (million $) | 107 | 146 | 155 | 161 | 157 | 147 | 139 | 131 | 126 |
| Return on rate base (%) | 5.75 | 8.25 | 8.25 | 8.25 | 8.25 | 8.25 | 8.25 | 8.25 | 8.25 |
Cochin is allowed to earn a return of 5.75% to 8.25% on its rate base. It earned the minimum return from 2010 to 2014. Since 2015 (the first full year of condensate service) it realized the maximum allowable return each year.
Corporate financial information
Section updated January 2024
The Cochin Pipeline is owned and operated PKM. PKM is a wholly owned subsidiary of Pembina Pipeline Corporation. Prior to 2019, the Cochin pipeline was owned by Kinder Morgan Cochin ULC, a subsidiary of Kinder Morgan Canada Limited.
Credit ratings provide an indication of the financial strength of a company, including its ability to attract capital to build new infrastructure and meet financial obligations. The credit ratings below are expert opinions of how likely the debt issuer is to live up to its obligations.
| 2016 | 2017 | 2018 | 2019 | 2020 | 2021 | 2022 | 2023 | ||
|---|---|---|---|---|---|---|---|---|---|
| DBRS | Kinder Morgan | BBB (low) | BBB (low) | BBB (low) | BBB | - | - | - | - |
| S&P | Kinder Morgan | BBB- | BBB- | BBB- | BBB | - | - | - | - |
| DBRS | Pembina | - | - | - | BBB | BBB | BBB | BBB (high) | BBB (high) |
| S&P | Pembina | - | - | - | BBB | BBB | BBB | BBB | - |
Financial regulatory audits
Section updated January 2022
The CER audits pipeline companies to confirm compliance with the Canadian Energy Regulator Act, regulations, CER orders and CER decisions. Financial regulatory audits focus on toll and tariff matters such as detecting cross-subsidies. Cochin’s last audit was completed on 24 July 2019. Official CER documents related to Cochin’s financial regulatory audits can be found here: [Folder 558655]
Safety and Environment
Conditions Compliance
Conditions Compliance
Section updated September 2024
Every pipeline company in Canada must meet federal, provincial or territorial, and local requirements. This includes Acts, Regulations, rules, bylaws, and zoning restrictions. Pipelines are also bound by technical, safety, and environmental standards along with company rules, protocols and management systems. In addition to these requirements, the Commission may add conditions to regulatory instruments that each company must meet. Conditions are project-specific and are designed to protect public and the environment by reducing possible risks identified during the application process.
Condition compliance is part of the CER's oversight and enforcement action is taken when required.
Conditions can be related to a specific region, or apply to the pipeline project as a whole. The map below displays the number of in progress and closed conditions mapped to economic regions as defined by Statistics Canada.
Conditions can typically be either in-progress or closed. The CER follows up on in-progress conditions.
In-Progress
This status refers to conditions that continue to be monitored by the CER. This happens when:
- condition filings have not yet been received by the CER; or,
- filings have been received but are under review or do not yet meet requirements; or,
- a project is not completed and it has conditions, which have not been met; or,
- a project has a post-construction condition, but a requirement has not yet been completed; or,
- some conditions may be active indefinitely or refer to the continued operation of a pipeline.
Closed
This status refers to:
- condition requirements that have been satisfied, and no further submissions from the company are required; or
- conditions whose filings or actions apply to a specific phase that have been fulfilled as the phase is completed (i.e. a specific filing during construction phase). Note: comments on the required actions can still be received.
Dashboard instructions
- Click on a region to view conditions info
- Click map area outside of regions to hide info
Note: Some conditions apply to multiple regions. Conditions may be double counted across regions, resulting in a higher number of conditions than the totals seen in the buttons above.
Source and description
Data Source: Open Government
Description: The above map displays the number of CER conditions associated with projects approved by the Commission. The map is split into two tabs which show in-progress and closed conditions separately, mapped to an economic region. If a company has no in-progress conditions specific to an economic region, the dashboard will default to show the closed conditions by region. An additional view is available which contains the number of in-progress and closed conditions that don't have a corresponding economic region in the dataset. The map regions are shaded based on the number of conditions, with lighter coloured regions containing fewer conditions compared to darker colors. Conditions that apply to more than one region are double counted in the map, and these conditions will appear in the map region total and map region breakdown for each applicable region. The condition counts contained in the map navigation buttons represent total conditions without region double counting.
Open data can be freely used and shared by anyone for any purpose. The data for these graphs are available [CSV].
Have you checked out the CER's interactive conditions data visualization? This tool offers a deep dive into the CER's conditions compliance data and process, exploring conditions across all CER regulated companies by keyword, project, and location.
Reported Incidents
Reported Incidents
Section updated September 2024
The information presented here is based on CER data (2008 to current) for incidents reported under the Onshore Pipeline Regulations and the Processing Plant Regulations. New data is added quarterly. Learn more on how incident data collection has evolved since the NEB (now the CER) was established in 1959.
Companies must report events, such as incidents, to the CER in accordance with the CER Event Reporting Guidelines. Knowing what happened, and why, helps us find ways to prevent them from happening again.
What is an incident? (Onshore Pipeline Regulations (OPR))
As defined in the OPR, “incident” means an occurrence that results in:
- the death or serious injury to a person;
- a significant adverse effect on the environment;
- an unintended fire or explosion;
- an unintended or uncontained release of low vapour pressure (LVP) hydrocarbons in excess of 1.5 m³
- an unintended or uncontrolled release of gas or high vapour pressure (HVP) hydrocarbons;
- the operation of a pipeline beyond its design limits as determined under CSA Z662 or CSA Z276 or any operating limits imposed by the CER.
What is an incident? (Processing Plant Regulations (PPR))
As defined in the PPR, “incident” is defined as an occurrence that results or could result in a significant adverse effect on property, the environment, or the safety of persons. For the purposes of incident reporting in the PPR, events that fall under this definition include, but are not limited to:
- the death or serious injury to a person;
- a significant adverse effect on the environment;
- an unintended fire or explosion that results in or has the potential to result in damage to company, public/crown or personal property;
- an unintended or uncontained release of low vapour pressure (LVP) hydrocarbons in excess of 1.5 m³
- an unintended or uncontrolled release of gas, HVP hydrocarbons, hydrogen sulfide or other poisonous gas; or
- the operation of a plant beyond its design limits or any limits imposed by the CER.
Incidents and the CER
Companies self-report incidents and are expected to take a precautionary approach in doing so. This means that even when there is doubt as to whether an incident should be reported, the company must report it. The approach is, “When in doubt, report.” This is consistent with CER-regulated companies’ responsibility for anticipating, preventing, mitigating and managing incidents of any size or duration.
The CER reviews all reported incidents to assess whether companies have taken the appropriate corrective actions and to identify potential trends in incidents. Each incident is given a status indicating the current stage of the CER's incident review.
CER Status
- Initially Submitted: The company has notified the CER that an incident has occurred and provided preliminary information. A review has been initiated.
- Submitted: The company has submitted all of the required information and the CER is reviewing the incident.
- Closed: The CER’s incident review has been completed and the file is closed.
Incident type definitions: one incident can have multiple types
- Release of Substance (featured in the dashboard) - Any time a product is unintentionally released. (Releases of non-gas low pressure products in volumes of less than 1.5 m³ are exempt from reporting.)
- Adverse Environmental Effects - When any chemical substance is released at a concentration or volume that has the potential to change the ambient environment in a manner that would cause harm to human life, wildlife or vegetation (e.g., glycol, potassium carbonate, methanol, methanol mix from hydrostatic testing, etc.).
- Explosion - An unintended explosion
- Fatality - Any death involving employees, contractors or members of the public related to the construction, operation, maintenance or abandonment of pipelines
- Fire - An unintended fire
-
Operation Beyond Design Limits Includes situations, such as:
- over-pressures - i.e., pressures that are higher than the maximum the equipment was designed to safely handle;
- vibration beyond design limits;
- slope movements causing movement in the pipeline beyond design limits;
- pipe exposures in rivers or streams; and
- introduction of an inappropriate product (e.g., sour gas in excess of CSA limits)
Operation beyond design limit is typically linked to an over-pressure of the product in the pipe; however, if a pipe was exposed to excessive vibration and was not designed for this, this could be considered operation beyond design limits. Operation beyond design limits does not include equipment contacting the pipe, or corrosion pits, etc.
- Serious Injury (CER or Transportation Safety Board) - Any serious injury involving employees, contractors or members of the public related to the construction, operation or maintenance of pipelines.
Are there any incidents near me?
Source and description
Data Source: Open Government
Description: The above map displays the location of product release incidents that have occurred on the pipeline system since 2008. The map defaults to show incidents as bubbles which are coloured based on the substance released. Incidents on the map can be re-categorized based on the most recently available status of the CER's incident review, the year in which the incident was reported, and the province/territory where the incident occurred. The incident map bubble can be switched to show the estimated volume of product released, with larger map bubbles showing larger release volumes relative to other product releases on the system. The incident data can also be toggled to display a stacked bar chart of incidents over time by clicking on the incident trends button above the map. The stacked bars display the number of product release incidents by year, with bar colour segments corresponding to the various products released. Similar to the map, incidents can be re-categorized by clicking on the side buttons to view a breakdown of incidents by status, what happened, why it happened, and province/territory.
Open data can be freely used and shared by anyone for any purpose. The data for these graphs are available [CSV].
Have you checked out the CER's interactive incident data visualization? This tool offers a deep dive into the CER's incident data trends, exploring incidents across all CER regulated companies.
Operations and Maintenance Activities
Operations and Maintenance Activities
Section updated September 2024
Oil and gas pipeline companies regularly conduct routine operations and maintenance (O&M) activities on CER regulated pipelines. These activities include things such as pipeline repairs, investigative and integrity digs, and many other activities while promoting safety, security, environmental protection, economic efficiency, and respect for the rights of those that may be affected.
Companies are required to adhere to Canadian Energy Regulator Act’s Onshore Pipeline Regulations and operate their facilities in a manner that is safe and protects the environment. Authorizations for pipelines typically allow companies to construct and operate a facility, and companies are not required to apply for additional approval to undertake most O&M activities. In certain circumstances, companies are required to notify the CER in advance with sufficient information to make a determination as to whether to inspect O&M activities that could result in safety consequences to landowners or the public, environmental consequences, or a negative impact on normal third-party use of the right-of-way (ROW) or adjacent property.
What activities are O&M activities (eligible activities)?
Operations and maintenance activities include:
- All activities necessary to safely operate an existing pipeline;
- Maintenance activities, upgrades or repairs to an existing pipeline or part of a pipeline that do not increase the approved maximum operating pressure (MOP), the stress level or diameter of the pipeline; or
- Physically removing an existing section of pipe up to 5 km in length, and putting a new section of pipe in its place, as long as this replacement does not increase the approved MOP, stress level or diameter of the pipeline.
What O&M Activities require CER approval (restrictions on eligible activities)?
Where any of the following restrictions exist, the company must apply to the Commission in accordance with the CER Act and the related regulations and may not carry out the proposed activity until approval from the Commission has been obtained. The restrictions apply where:
- The work includes welding on an in-service pipeline by a pipeline company that has not previously performed in-service welding in accordance with the requirements of CSA Z662-15, Clause 7.17, ‘Welding on In-Service Piping’, or the equivalent clause in the most recent edition of CSA Z662; or
- The work involves the construction of an aerial crossing, excluding work on company owned or leased land relating to facilities (e.g., terminal stations, processing plants, compressor/pump stations).
What kinds of activities are not O&M activities (ineligible activities)?
O&M activities do not include:
- Upgrades that result in increases above previously approved and specified levels to:
- the MOP,
- stress levels,
- the diameter of the pipeline, and/or
- airborne emissions or noise levels.
- "Looping" (i.e., adding pipe parallel or adjacent to, and interconnected with, an existing pipeline for the general purpose of increasing capacity);
- Construction of a new pipeline; or
- Deactivation (for longer than 12 months), reactivation (where a pipeline has been deactivated for more than 12 months), decommissioning, or abandonment.
Source and description
Data Source: Open Government
Description: The above bar chart displays the number of O&M activities from 2015 to current, arranged based on the starting year of the activity. Each bar is stacked based on several parameters, with the default view showing the province/territory where the O&M activity occurred. Navigation buttons to the right of the bar chart provide the option to view the number of O&M activities by province/territory, if the activity includes an integrity dig, if in-stream work is required, if there are fish present, and if there are species at risk present.
Open data can be freely used and shared by anyone for any purpose. The data for these graphs are available [CSV].
View the requirements and guidance notes (O&M Guidelines) for more information on how these events are regulated while promoting safety, security, environmental protection, economic efficiency, and respect for the rights of those that may be affected.
Contaminated Sites and Remediation
Contaminated Sites and Remediation
Section updated September 2024
As part of the CER’s environmental protection activities, we require companies to manage and remediate contamination throughout the lifecycle of the facilities. As a first step, regulated companies are required to report contamination to the CER through the online submission of the Notification of Contamination (NOC).
After the NOC is submitted, companies must demonstrate they are actively managing the contamination according to the Remediation Process Guide. The progress and current status of remediation at the contaminated site are captured in the annual update submitted by a company each year for a contaminated site.
Third party contamination is on-site contamination that is shown to not be emanating or migrating from the company’s facilities or company-owned or leased lands or Right-of-Way. While third-party contamination is not the result of company activities, the CER still requires that this contamination is reported to the CER through the submission of the NOC.
The dashboard below contains information that is contained in the NOC's and annual updates found in REGDOCS. The CER publishes NOCs that have been submitted to the CER since August 2018, when the CER started collecting this information electronically and annual updates that have been submitted since 2021. For information on contaminated sites for which NOCs were submitted prior to August 2018, email remediation@cer-rec.gc.ca.
There are many different methods and approaches to remediate contamination. Thus, when a company submits a plan for remediation (i.e., remedial action plan) for CER review, they are required to include an options analysis to support the remedial method chosen, select appropriate remediation criteria and demonstrate engagement with potentially affected persons, among other requirements. CER analysts also review closure reports submitted by the company once the remediation is completed to ensure remediation has been completed appropriately.
Are there any contaminated sites near me?
Source and description
Data Source: Open Government
Description: The above map displays the approximate location of contaminated sites that have been reported since August 2018. The map defaults to show contaminated sites as bubbles which are coloured based on the year the Notice of Contamination was submitted. Contaminated sites on the map can be re-categorized based on the province/territory, if the site is within 30 metres of a water body, and the applicable land use at the site. The contaminated sites can also be toggled to display a stacked bar chart of events over time by clicking on the contaminated sites trends button above the map. The stacked bars display the number of contaminated sites reported by year. Like the map, contaminated sites can be re-categorized by clicking on the side buttons to view a breakdown of contaminated sites by site status, activity at time of discovery, pipeline or facility, and contaminant type.
Open data can be freely used and shared by anyone for any purpose. The data for these graphs are available [CSV].
Damage Prevention Regulations Contravention Reports
Damage Prevention Regulations Contravention Reports
Section updated September 2024
Damage prevention is where people and pipelines meet; it is the proactive process that keeps people, the environment, and pipelines safe.
The CER takes action to protect Canadians and the environment. Some of these actions include having safety requirements for activities near the pipelines that we regulate. Unauthorized activities on or around pipelines are unsafe and illegal. If pipelines are contacted or damaged, the result could be very serious.
The CER Damage Prevention Regulations (DPRs) outline the obligations of the pipeline companies to have robust damage prevention and public awareness programs that provide people living and working near pipelines the information to ensure those activities near their pipelines are done safely with respect to the pipeline. The DPRs also outline the requirements for people living and working near pipelines to communicate with pipeline companies when they are planning any construction activity (digging, building, driving on the right-of-way) and to follow the instructions that the pipeline company gives them.
Damage prevention is a shared responsibility, and we all play a part in making sure that everyone stays safe when working near a pipeline.
Pipeline companies must immediately report to the CER any activity near their pipelines that does not follow the rules and specifications set out in the DPRs. These violations are called contravention reports. The CER provides an Open Government dataset containing information on each reported contravention. Some summary statistics and a dashboard displaying this data is available below.
Source and description
Data Source: Open Government
Description: The above map displays the location of DPR contravention reports that have been reported for the pipeline system over the past five plus years. The map defaults to show DPR contravention reports as bubbles which are coloured based on whether the pipe was damaged. DPR contravention reports on the map can be re-categorized based on whether there was a ground disturbance, the year, and who discovered the event. The DPR contravention reports data can also be toggled to display a stacked bar chart of events over time by clicking on the DPR Contravention Reports Trends button above the map. The stacked bars display the number of DPR contravention reports by year, with bar colour segments corresponding to the event type. Similar to the map, DPR contravention reports can be re-categorized by clicking on the side buttons to view a breakdown of events by whether pipe was damaged, who discovered the event, and method of discovery.
Open data can be freely used and shared by anyone for any purpose. The data for these graphs are available [CSV].
Emergency management
Section updated January 2022
The CER checks to make sure companies are keeping pipelines safe by doing inspections, in-depth safety audits, and other activities. Yet, even with these precautions, an emergency could still happen. Sound emergency management practices improve public safety and environmental protection outcomes, and provide for more effective emergency response.
The CER holds its regulated companies responsible for anticipating, preventing, mitigating, and managing incidents of any size or duration. Each company must have an emergency management program that includes detailed emergency procedures manuals to guide its response in an emergency situation. We oversee the emergency management program of a regulated company’s projects as long as they operate.
The CER requires companies to publish information on their emergency management program and their emergency procedures manuals on their websites so Canadians can access emergency management information. To view Cochin’s emergency response information, see the company’s Spill Response Plan.
- Date modified: