ARCHIVED - Attitude and Behaviour: Shaping Energy Use - Energy Briefing Note
This page has been archived on the Web
Information identified as archived is provided for reference, research or recordkeeping purposes. It is not subject to the Government of Canada Web Standards and has not been altered or updated since it was archived. Please contact us to request a format other than those available.
ISSN 1917-506X
Attitude and Behaviour: Shaping Energy Use - Energy Briefing Note [PDF 1985 KB]
Energy Briefing Note
Attitude and Behaviour
Shaping Energy Use
December 2009
Copyright/Permission to Reproduce
Table of Contents
- Foreword
- Introduction
- Behaviour within Energy Demand Analysis
- Behaviour Factor by Sector
- Motivation and Methodology for Behaviour Change
- Application of Behavioural Factors in NEB Demand Forecasting
- Observations
- Appendix 1 - B.C. Residential Energy Behaviour Survey Study
- Appendix 2 - Energy Behaviour Participation by Household (2007-2008)
- Appendix 3 - Changes in Transportation Choices
- Appendix 4 - "Most Important Problem Facing Canada Today"
Foreword
The National Energy Board (NEB or the Board) is an independent federal agency that regulates several aspects of Canada's energy industry. Its purpose is to promote safety and security, environmental protection and efficient energy infrastructure and markets in the Canadian public interest[*] within the mandate set by Parliament in the regulation of pipelines, energy development and trade. The Board's main responsibilities include regulating the construction and operation of interprovincial and international oil and gas pipelines as well as international and designated interprovincial power lines. The Board regulates pipeline tolls and tariffs for pipelines under its jurisdiction. In terms of specific energy commodities, the Board regulates the exports and imports of natural gas as well as exports of oil, natural gas liquids (NGLs) and electricity. Additionally, the Board regulates oil and gas exploration, development and production in Frontier lands and offshore areas not covered by provincial or federal management agreements. The Board's advisory function requires keeping under review matters over which Parliament has jurisdiction relating to all aspects of energy supply, transmission and disposal of energy in and outside Canada.
The NEB monitors energy markets to objectively analyze energy commodities and inform Canadians about trends, events, and issues. The Board releases numerous research reports. This report is a briefing note - a brief report covering one aspect of energy commodities. More specifically, this is the fourth in a series of energy demand briefing notes and considers the influence of attitude and behaviour on energy demand.
If a party wishes to rely on material from this report in any regulatory proceeding before the NEB, it may submit the material, just as it may submit any public document. Under these circumstances, the submitting party in effect adopts the material and that party could be required to answer questions pertaining to the material.
Introduction
Changing patterns of energy use can be attributed to many factors. The influence of technology, energy prices, general economic conditions, and, as this briefing note examines - attitude and behaviour towards energy use, are all major factors in shaping Canadian energy demand. Although both attitude and behaviour are considered in energy demand outlooks, the focus is on behaviour. Attitude shapes behaviour, but it is ultimately behaviour that affects energy use.
Behaviour analysis looks at the economic, social, and cultural framework behind energy decision-making. These elements are behind energy consumption, conservation, and investment. Estimating the extent and direction that behaviour may change, and how to include this in forecasts is very difficult. There seems to be a general sense that attitudes about energy use are changing. Growing concern over environmental sustainability is a big part of this. However there is limited quantitative research to support clear behavioural trends. At the same time, to not include behaviour change would limit the accuracy of forecasts.
This briefing note examines some elements of this challenge. Specifically, the main sections of this note review:
- examples of national and provincial energy demand analysis with a behaviour component;
- how behaviour is identified within sectors (residential, commercial, industrial, and transportation);
- the methodology for applying behaviour within forecasts;
- concluding observations about present and future trends in behaviour in energy use.
Behaviour within Energy Demand Analysis
Reports that identify and quantify energy saving opportunities are published on a regular basis. These studies are useful for power system planning, and to guide environmental policies. The question is which of these opportunities are acted on and how quickly. Some of these reports have attempted to include a behavioural component. Energy conservation, efficiency, and changing energy sources all affect the demand for energy. Energy conservation is generally seen as a reduction in level of output or service by deliberately using less energy. Often this means simply modifying usage to reduce waste. Energy conservation, therefore, is clearly associated with behaviour. Turning off the lights as you leave the room is a good example of energy conservation. Energy efficiency generally applies to the application of new or better technology, essentially getting the same output or level of service for less input energy. Energy efficiency, although technology focused, also has a behavioural element. This is most evident in the wide range of levels of acceptance and uptake of new technology. Replacing an incandescent light bulb with a fluorescent light bulb is energy efficiency. Changing energy sources or generating on-site renewable energy does not change either the energy input or output but replaces one form of energy with another. Installing a solar panel on your home for water heating replaces natural gas or other fuels which would have been used to heat the water.
Establishing Criteria for Energy Saving Opportunities
Two key criteria considered in demand analysis are technical and economic feasibility. A technical analysis for energy savings examines the substitution of the dominant existing stock (e.g., device, appliance, equipment, building, and vehicle) with the best available technology on the market, and the subsequent energy savings. The difference between the best available technology and the existing stock is large; savings of 50 per cent or more are common. Economic and behaviour barriers to the uptake of this technology may only be considered to a limited extent. Purely technical studies can provide a very optimistic view of the opportunity.
The economic analysis considers the cost-effective options. It assumes that consumers make rational, informed purchasing decisions based on a life-cycle cost analysis. It assumes the knowledge and financial means to access the opportunity are in place. However, many consumers do not take the most economic option for a variety of reasons.
Some recent energy analyses have attempted to move beyond the purely technical-economical analysis to consider the influence of behaviour. The behavioural element becomes a defining factor between what is possible and what is plausible. Adding the behavioural element to the analysis gives a more achievable target. This level considers how consumers actually respond to many perceived and real barriers to new technology. These barriers range from financing and information deficiencies, to apathy and cynicism. It also reflects the fact that consumers make choices for non-economic reasons. As an example, larger cars offer a perception of greater safety or status. The achievable targets can be swayed by market intervention such as using subsidies and advertising that would increase the uptake of a new technology. Financial incentives can increase the economic attractiveness of an option and advertizing can increase the awareness of the economics. Figure 1 indicates a theoretical level of energy saving based on evaluation criteria (Figure 1).
Figure 1: Levels of Energy Saving Opportunity
A conclusion of the American Council for an Energy Efficient Economy was "programs are often short-changed because programs frequently overemphasize the savings that are attributable to the installation of new technologies but often underemphasize the ways in which behaviour enables technology based savings"[1]. As an example, compact fluorescent light (CFL) bulbs have been promoted for over twenty-five years. It is only in the last few years that the majority of homes can claim more than one installed CFL.
[1] Behavior, Energy, and Climate Change: Policy Directions, Program Innovations, and Research Paths, Ehrhardt- Martinex, Karen; November 2008, Report #E87, American Council for Energy Efficiency Economy.
Quantifying Energy Saving - National Level
Energy saving opportunities have been identified through various demand-side management (DSM) studies. DSM includes all the energy efficiency, conservation, and renewable energy options available to energy suppliers and distributors. These actions result in a change in short-term (i.e., "peak" times) and/or long-term energy use. A Canadian Gas Association DSM potential study suggested that adoption of improved existing technologies across Canada could result in a range of energy savings of between 182 and 918 petajoules per year[2] . The lower end of this range reflects savings based on existing polices. The upper end represents the full economic potential.
[2] Behavior, Energy, and Climate Change: Policy Directions, Program Innovations, and Research Paths, Ehrhardt-Martinex, Karen; November 2008, Report # E87, American Council for Energy Efficiency Economy.
Accessing the generally large gap between the technical, economic, and achievable savings has been the focus of policy makers and DSM program designers for decades. There are some distinctly Canadian characteristics to energy demand trends that have added challenges to DSM programs. These challenges include a history of relatively low regional energy prices, a geography and climate that support high consumption, relatively high levels of personal income, energy-intensive infrastructure and equipment, relatively abundant resources, and a consumer culture.
Quantifying Energy Saving - Provincial Level
In the last few years, several provinces have conducted energy-savings potential studies. In Ontario, the Ontario Power Authority has identified four tracks related to its long-term conservation strategy. These include demand management/energy conservation, energy efficiency, fuel switching, and on-site (power) self-generation. The Ontario approach features extensive public information to ensure that every individual, institution, and company is aware of the value, purpose, and goals of energy efficiency. This is part of the Ontario goal of creating a "culture of conservation". Programs extend from industrial manufacturing process audits to conservation curriculum development in schools. The Integrated Power System Plan (IPSP) for long-term electricity supply and demand has a near term target of saving 1350 megawatts (MW) of peak load reduction by 2010 and 6300 MW of peak load by 2025 based on the programs (Figure 2). This is the equivalent of removing one in five houses from the electricity load base.
Figure 2: Ontario Conservation Strategy

Source: Ontario Power Authority
It would be difficult to estimate a purely behavioural component to the IPSP since there are behaviour aspects to all four tracks. The most evident behavioural component of the IPSP may be the "Reduced Use" contribution. This accounts for only about three per cent of the total net savings[3]. To some extent, behaviour is embodied within all of the more than 100 energy conservation programs in Ontario. Generic marketing programs such as the Ontario Conservation Bureau's "Every Kilowatt Counts" program contain a cross-cutting behaviour message that supports conservation by all available means.
[3] Energy Efficiency is the largest share (63 per cent) and most of this is due to new codes and standards. Ontario Power Authority IPSP 2007 analysis.
British Columbia's 2007 Energy Plan sets a target of 50 per cent of BC Hydro's incremental resource needs through 2020 to be met by conservation[4]. The plan also sees an increased share of renewables and clean energy technology. The report recommends electricity utilities pursue all cost-effective DSM opportunities.[5] The amount of achievable energy saving (depending on incentives) varied from 14 to 28 per cent compared to the reference case (Table 1).
[4] The BC Energy Plan: A Vision for Clean Energy Leadership, Energy, Mines, and Petroleum Resources, 2007.
[5] BC Hydro 2007 Conservation Potential Review: The Potential for Electricity Savings, 2006-2026, Residential Commercial and Industrial Sectors in British Columbia. Marbek Resource Consultants Ltd. November 2007.
Table 1: British Columbia Conservation Potential Review
| Year | Consumption (GWhr/year) Reference Case |
Achievable Savings (GWhr/year) Lower |
Achievable Savings (GWhr/year) Upper |
Savings compared to Reference Case Lower / Upper |
|
|---|---|---|---|---|---|
| 2026 | 68,665 | 8 659 | 15 072 | 14% | 28% |
| Note: 10,000 gigawatt hours (GWhr)/year is equivalent to the annual consumption of approximately 1 million homes. | |||||
Behaviour Factor by Sector
Residential Sector
The BC Hydro Conservation Potential report includes separate “Lifestyle” and “Housing” components. The lifestyle model is an attempt to isolate low-cost, simple behaviour-based actions for energy use in buildings. For the most part these behaviours could be put into practice immediately or with minimal investment. Actions includes turning down the thermostat, unplugging unused appliances, turning off lights, switching to compact fluorescent bulbs, washing in cold water, and avoiding air conditioning as much as comfortably possible. A BC Hydro survey indicated fairly high levels of engagement for these everyday behaviours. For example, over 90 per cent of respondents “always or usually” turned off lights when leaving a room (Appendix 1).
Further to the lifestyle review, the separate housing analysis was based on assumptions about urbanization trends. This included a consumer preference for smaller-sized households, and higher density housing where shared walls and energy systems offer efficiency advantages and the potential for electricity demand reduction. The housing and lifestyle components were shown to be significant contributors to electricity savings: 786 GWh/yr and 2,545 GWh/yr, respectively, by 2026.
All provinces have programs dedicated to energy efficiency awareness and consumer action. These policies are difficult to quantify in terms of outcomes; however, evidence suggests that programs are having an impact. Appendix 2 shows household participation rates for several common environment behaviour practices by province. This survey shows participation rates of over 50 per cent for most actions including employing low-flow showerheads and compact fluorescent light bulbs, recycling, and lowering thermostats. These participation rates indicate an approaching limit to some well-known energy conservation opportunities. The remaining per cent are the most difficult, and 100 per cent participation is probably not possible. This limit needs to be considered within demand analysis.
Industrial and Commercial Sectors
Consumer behaviour has the greatest effect on energy use in the residential sector. It is here individuals have the best ability to control their energy consumption habits based on personal preferences and priorities. This is far less likely in the industrial and commercial sector. In these sectors, there are many competing priorities at the management or owner level. However, behaviour can still play a significant role in these environments. It is easy for individuals within these sectors to not see the benefits of their actions. This disconnect works against wider participation in energy saving behaviours. For example, a tenant in a large commercial building may leave their window open in the winter if it has no effect on their rent.
There are several successful programs in Canada aimed at empowering individuals within commercial and industrial facilities to champion energy savings[6]. General characteristics of these programs include:
- identification of dedicated energy management staff;
- baseline reporting and record keeping to identify opportunities and track progress;
- endorsement of program goals and actions from top levels of owners, management and finance;
- supplementary information campaigns that foster a conservation ethic within all areas of organization.
[6] The most well known commercial and industrial sector programs include the Building Operators and Managers Association "Building Environmental Standards" (BOMA BESt) and the Canadian Industry Program for Industrial Conservation (CIPEC).
Commercial Sector
Most decisions regarding energy use in buildings are evaluated in a standard technical-economic framework. In this context, decisions which focus on cost savings and many side benefits such as improved productivity, reduced absenteeism, marketing advantages, and employee retention are often overlooked. In commercial buildings, a behaviour component - specifically productivity, could be a larger economic variable than construction or equipment costs. A good example is commercial lighting. High efficiency lighting is a fairly attractive upgrade in terms of energy savings. In a consulting report for commercial building efficiency options, an analysis of high efficiency lighting upgrade showed a payback in energy savings of 4.1 years with a return on investment of 24 per cent. However, when productivity and reduced absenteeism were considered, the payback was significantly better[7].
[7] Green Buildings, Green Value, Growing Assets. Royal Institution of Chartered Surveyors, 2008. This includes surveys of attributes of green buildings and clients/employees level of satisfaction factors contributing to productivity gain and reduced absenteeism.
A lack of information is still a major barrier for implementing more energy and environmentally-sustainable building practices. As the benefits of constructing more efficient buildings become more widely known by developers and buyers, the market share of green buildings should continue to increase.
Sector
Two examples from the industrial sector illustrate the extent of "behaviour" in energy analysis. At a grassroots level, there is the growing popularity of training courses for optimizing industrial equipment. The Federal government offers several energy conservation and efficiency programs for industrial engineers and operators.
At the other end of spectrum, the emergence of Corporate Social Responsibility (CSR) sees the entire corporate entity assuming the attitudes normally associated with an individual. CSR places a high priority on sustainability and social responsibility. It acts as a guideline of corporate governance, risk management, branding, stakeholder engagement, climate change mitigation, supply chain standards, and labour practices. According to Environment Canada, 35 per cent of companies listed on the Toronto Stock Exchange Composite Index reported sustainability information within public reports (i.e., annual reports) in 2001. By 2007, this had increased to 80 per cent. The number of corporations producing separate sustainability reports increased from 10 per cent in 2001 to 18 per cent in 2007[8].
[8] Sustainable business: Corporate Environmental Innovation. Environment Canada, 2004.
There is no strong link between sustainability and energy use within the broad definition of CSR. However, energy savings, increasing shares of renewable energy, and reduced emissions are certainly encouraged. Recently, there have been several high-profile public relations announcements related to CSR and enervgy use. One of the most visible was Google Inc. with its plan to be carbon-neutral beginning in 2007. Its plan includes efficiency improvements, buying wind power, and purchasing offsets. Other examples of high- profile corporate sustainability include large multi-national companies like IBM and Wal-Mart Stores, Inc. incorporating full life-cycle energy costing into product evaluation. Life-cycle costing considers how each product is made, transported, used, and end-of-life disposal or recycling.
There are several rankings in the public domain for monitoring corporate performance. These include the Dow Jones Sustainability Index, Excellence in Corporate Environmental Leadership (EXCEL), Corporate Knights' Top 50 and The Global 100. The summaries include some of the most well-known names in the Canadian corporate landscape.
On its own, CSR is not likely to be a major factor in industrial energy demand. But, it has already generated enough momentum within corporate circles to be a contributing factor towards future change.
Transportation
With over 80 per cent of Canadian households having at least one vehicle and over 18 million passenger vehicles registered in Canada, driving habits can create a significant shift in energy demand[9] . Within the passenger sector, behaviour has a major influence on demand trends. Driver decisions include activity (how far, how often), and purchasing preferences (weight, horsepower). Trends in urbanization have also boosted demand. Growth on the outer perimeter of cities requires greater reliance of personal vehicles.
[9] This section provides a summary of behaviour concepts related to transportation. For a more in-depth analysis of passenger transportation see the Energy Briefing Note, Canadian Energy Demand: Passenger Transportation.
Vehicle efficiency will continue to make incremental improvements for the foreseeable future. Promising technologies that are being more widely applied include cylinder deactivation, turbo charging, continuously variable transmission, and variable valve timing. Each of these technologies has the potential to improve fuel economy by five to ten per cent. However, with low vehicle retirement and replacement rates, it will take years for these technologies to significantly impact fuel usage. By contrast, driver behaviour measures could immediately exceed the new car technology improvements[10]. These measures and their associated rate of energy efficiency improvement include:
- Drive sensibly (avoid aggressive acceleration and stops; observe the speed limit): 5 to 33 per cent improvement;
- Maintain correct tire pressure: 3 per cent improvement;
- Vehicle maintenance including regular tune-ups/filter changes: 14 per cent.
[10] For further information,voir Gas Mileage Tips, U.S. Department of Energy.
These energy savings suggest behaviour is as influential as technology upgrades. This comparison can be applied not just to transportation, but to all sectors.
Motivation and Methodology for Behaviour Change
Data indicates that energy demand basically moves lock-step with the economy. Improving energy efficiency in the last few decades has resulted in less energy use for each level of service (i.e., heating per unit of floor space, gasoline per kilometre of travel). However, economic growth and an increase in personal spending have erased these savings. In growth times, consumers purchase and use more energy-using devices. As a result, net energy demand increases. To an extent, this suggests energy demand is actually fairly predictable: that demand is basically an outcome of the economic climate.
However, correlating actual human behaviour to a purely economic framework reveals more complex and contradictory elements at work. With energy using products and services, purchasing decisions could just as likely be based on lowest first purchase price, convenience, accessibility, social acceptability, and aesthetics. Both economic and social variables introduce large levels of uncertainty into energy forecasts.
It would be expected that economic self-interest - the desire to make money or save money - would be a strong motivator for accessing efficiency actions and technology. This would suggest that the most likely factor in predicting behaviour change would be energy prices. Historical evidence in energy demand downplays the argument for price response. Energy demand is considered to be relatively inelastic to price: very large shifts in energy price produce small (opposing) shifts in consumption. This is noticeable in recent gasoline sales trends. Between 2002 and 2007 as the price of motor gasoline in central Canada increased 45 per cent, fuel sales actually increased 7.4 per cent[11]. This could be explained by the fixed stock of energy using devices, a robust economy, and entrenched lifestyles.
[11] Energy Statistics Handbook. Statistics Canada, Second Quarter 2008.
The recent spike in oil prices (peaking in July 2008 at US$147/ barrel) provided evidence of a trigger point for consumer response. After decades of ever-increasing annual total distances travelled, the U.S. recently saw an abrupt reversal in the driving trend (Figure 3)[12] . Since where people live and the types of vehicles they choose to drive cannot be altered in a short time, the response could be considered primarily behavioural. Actions could include driving less, finding alternative modes of transport, carpooling, telecommuting or other activities.This downward trend could be continued into 2009, even though fuel prices have dropped considerably. In 2009, slower economic growth and personal spending would suggest decreasing demand.
[12] Traffic Volume Trends. Federal Highway Administration, 2008.
Figure 3: Total Distance Travelled 1983-2008
Source: Federal Highway Administration (U.S.)
Although not necessarily indicative of long-term trends, recent statistical data in Canada indicated very significant changes in purchasing behaviour as well. Statistics Canada reported motor gasoline sales dropped in May, June, and July 2008 compared to the same months in 2007[13] . Gasoline fuel sales in spring 2008 were down approximately five per cent from 2007. In addition, new vehicle sales saw a definite shift to small, fuel efficient vehicles. Spring 2008 saw fairly decisive shifts in buying trends. Statistics Canada data for June 2008 showed a decrease in SUV/light truck sales of 6.6 per cent between June 2007 and June 2008, while small import cars sales increased 12.2 per cent between June and June 2008.
[13] The Supply and Disposition of Refined Petroleum Products in Canada, Statistics Canada, May, June, July 2008.
In a 2008 survey by the Federation of Canadian Municipalities, the two most likely responses to high gas prices were to "drive less" and "take public transit" (Appendix 3). Both of these survey responses are supported by recent data[14,15]. It is too soon to know how high energy costs or the economic slowdown will be reflected in long-term demand trends.
[14] Survey Shows Gas Prices Pushing Canadians to Transit But Capacity Missing, Canadian Urban Transit Authority Press Release, September 2008.
[15] Increasing Fuel Costs Pushing Up Transit Ridership, Reported in Energy Evolution, October 20, 2008.
Social and Cultural Context for Behaviour Motivation
Besides energy price and economic growth, social and cultural influences are also considered to be fundamental drivers of consumption trends. This includes consumer priorities and expectations, societal attitudes, beliefs, world views, conventional wisdom, and social norms. Making demand forecasts requires assumptions about what Canadians care about and how this might be expressed.
Environmental Consideration
The economy has recently been identified as the issue of most concern for Canadians. However for the past several years two personal and policy priority areas identified in surveys have been health care and the environment (Appendix 4). In the last quarter of 2008, the state of the economy jumped to the top spot, suggesting environmental concern is contingent on the security of other basic needs. Large numbers of Canadians have expressed interest in lessening their environmental impact. This includes improving home energy efficiency (91 per cent)[16] and considering the environmental costs associated with their purchasing decisions (80 per cent)[17].
[16] Survey Finds Energy Efficiency Features as Main Incentive for Home Buyers. Angus Reid Strategies, (July 2008). Reported in Energy Evolution, September 29, 2008.
[17] Consumers Cite Cost as Major Barrier to More Environmentally Friendly Practices. Gandalf Group Marketing, June-July 2008. Reported in Energy Evolution July 28, 2008.
Opinions and expressions of interest do not translate directly into measurable and sustained changes in energy use habits. A change in behaviour usually involves trade-offs: time, convenience, cost, or other. In a survey on climate change in 2007, four in 10 (42 per cent) participants indicated they would pay a premium of 10 per cent or more for products that are environmentally friendly[18]. Without including these shifts in attitude, purely technical/economic based energy forecasts would yield different results. At the same time, it would be easy to overestimate the impact if targets were based purely on expressions of interest.
[18] Direct Energy Marketing Limited survey 2007. Reported in Energy Evolution “Survey For Direct Energy Finds Climate Change Concern”, June 22, 2007.
Embracing New Technology
New products offering better service and lower energy use are constantly appearing on market. However a "good idea", is unlikely to translate into rapid uptake. The penetration of ideas and technology over time occurs in predictable patterns. The pattern recognizes that consumers can be identified by their reactions to new technology (Figure 4).
Figure 4: Innovation Adopter Categories
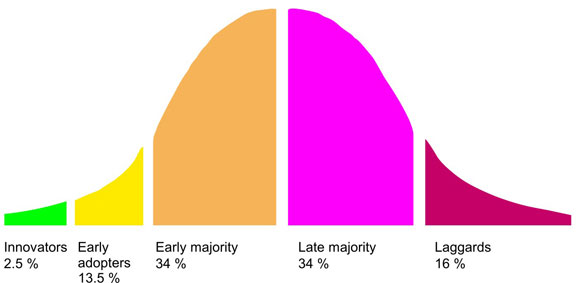
Source: based on Diffusion of Innovations, Rogers, E.
Recognizing the diversity of audiences, and their anticipated reactions to new technology, has helped optimize energy DSM programs for specific markets. In particular, a great amount of effort is focused on the early stages of adoption in order to create a vital "take off" point (also referred to as "critical mass" or "tipping point" in marketing). This pattern of adoption was seen in many technology and social trends in the last two decades. Examples include recycling, cell phone use, organic food purchases, and even stop-smoking campaigns.
New and creative means of capturing consumers' attention is a necessity for effective DSM program delivery. This is particularly so in an age where consumers are suffering from information overload. Present day DSM programs are most likely a combination of proven and innovative methods of social marketing. For example, utility companies are using the persuasive powers of peer pressure to create a "band-wagon" effect for energy conservation. The cost-benefits are promoted, but there is also a strong message about being part of larger social movement. Along with this message, there is a corresponding implicit suggestion of being outside what is socially acceptable. An interesting example is a pilot project which uses household utility statements to compare customers' energy consumption with that of comparable houses in the neighbourhood.
Application of Behavioural Factors in NEB Demand Forecasting
No universal methodology exists for incorporating behaviour into energy demand modeling. Since the behaviour factor is so highly speculative, the NEB forecasts use two basic formats. For a reference case, behaviour is based primarily on an historic pattern, essentially using the established trend. A movement away from this trend could be explained by energy prices or social values. In either case, the change is based on observable evidence. For example, an increase in energy conservation outreach and education programs could be contributing to changing social values. Speculation about what might, or could, happen, is kept to a minimum.
In scenario development, more pronounced changes in technology, energy costs and social values allow for a wider range of behavioural responses[19]. As examples, in a scenario of high energy prices and a slow economy, it would be expected that corporations and individuals would look for low-cost energy conservation measures. Short-term “belt tightening” would win out over long-term capital investment in energy-saving technology.
[19] Canada's Energy Future: Reference Case and Scenarios 2005-2030, National Energy Board, November 2007.
In Canada's Energy Future, the Triple E scenario considered a significant demand shift, essentially slowing decades of year-to-year demand growth to near zero. This scenario includes the application of a full suite of measures that include significantly tightened codes and standards, designated investment in education, awareness and energy research, a carbon based price premium on fuels which induces a small price response, and a pervasive environmental ethic. Demand essentially flattens, and in some sub-sectors such as building space heating and water heating, net demand actually decreases between 2005 and 2030. This is notable since it occurs in the context of economic growth. However, this decrease would not occur without the combination of measures.
Observations
Historical data shows the primary factor in shaping behaviour and its influence on energy demand is simply the state of the economy. However, this does not rule out envisioning a future energy scenario where demand trends unfold independently of economic shifts. Recent price shocks and reviews of new technology both provide indications that energy demand trends can be more dynamic. In the near-term, there are firm reasons for only moderate adjustments in energy demand forecasts. Practical realities include the generally slow turnover rates of energy using equipment and prebuilt infrastructure. Entrenched habits of lifestyle and energy use have, historically, been slow to change. This is even more pronounced in Canada where factors such as geography and climate significantly influence energy use. Lastly, it could be argued that a reason for change happening so slowly is simply that the alternatives have not been convincing enough to generate interest. This would indicate sustained and significant demand change is a long-term proposition.
Over the longer term there are significant opportunities for change. Considering existing technologies, there is a large gap between the many technical/economic opportunities, and current behaviours. Many new technologies are emerging that could lessen energy supply and environmental concerns and are attracting a lot of attention. The challenges in developing and implementing these technologies in a reasonable timeframe encourage a hard look at the role of behaviour in energy use. This means considering fundamental attitudes about energy use and new supplies of energy. There is some recent evidence to suggest that consumer attitudes are changing. How this attitude change melds with broader economic concerns remains to be seen. This reinforces the need for ongoing energy use analysis and energy education.
Appendix 1 - B.C. Residential Energy Behaviour Survey Study
Space and Water Heating
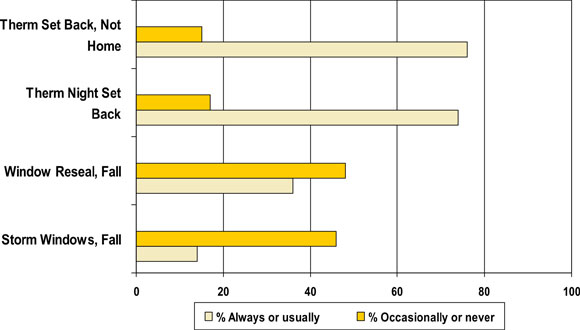
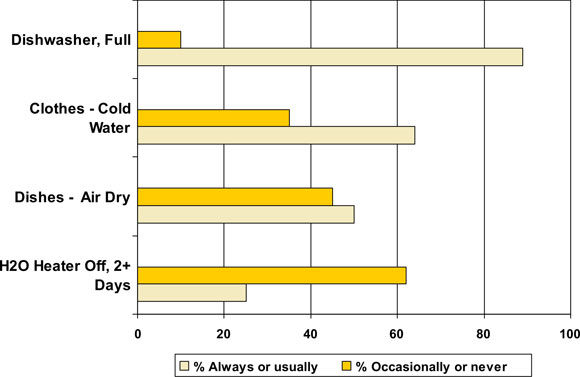
Air Conditioning and Lighting

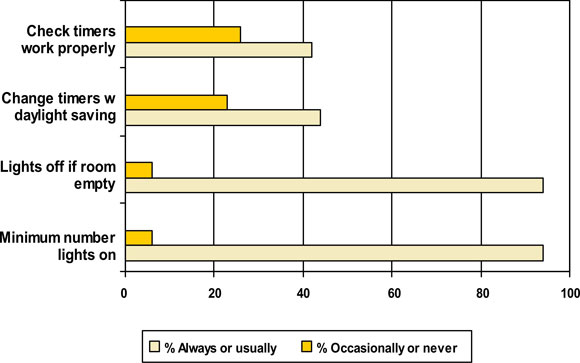
Source: BC Hydro
For more information see Using Behavioral Research at BC Hydro.
Appendix 2 - Energy Behaviour Participation by Household (2007-2008)
Table 1: Thermostat use by households during the winter, Canada and provinces
| Programmable thermostat | Not programmed or non-programmable | |||||
|---|---|---|---|---|---|---|
| Households reporting at least one thermostat | Winter temperature lowered when asleep1 | Main thermostat, programmable1 | Programmed thermostat2 | Winter temperature lowered when asleep3 | Winter temperature lowered when asleep4 | |
| percent | ||||||
| Canada | 92 | 55 | 42 | 84 | 70 | 47 |
| Newfoundland and Labrador | 95 | 60 | 16 | 71 | 79 | 58 |
| Prince Edward Island | 97 | 63 | 27 | 81 | 77 | 59 |
| Nova Scotia | 96 | 60 | 25 | 74 | 75 | 57 |
| New Brunswick | 94 | 54 | 22 | 79 | 69 | 50 |
| Quebec | 93 | 56 | 37 | 82 | 66 | 51 |
| Ontario | 88 | 53 | 53 | 86 | 68 | 40 |
| Manitoba | 97 | 49 | 39 | 78 | 71 | 41 |
| Saskatchewan | 97 | 59 | 38 | 84 | 78 | 49 |
| Alberta | 99 | 58 | 41 | 90 | 77 | 46 |
| British Columbia | 93 | 58 | 35 | 82 | 74 | 52 |
1 As a percentage of all households that had a thermostat.
2 As a percentage of all households that had a programmable thermostat.
3 As a percentage of all households that had a programmable thermostat that was programmed.
4 As a percentage of all households that had an unprogrammed or non-programmable thermostat.
Source(s): Statistics Canada, Environment Accounts and Statistics Division, Households and the Environment Survey, 2007, CANSIM Table 153-0060.
Table 2: Energy-saving light bulbs, Canada and provinces
| At least one type of energy-saving light | Compact fluorescent lights | Fluorescent tubes | Halogen lights | |
|---|---|---|---|---|
| percent | ||||
| Canada | 84 | 69 | 46 | 35 |
| Newfoundland and Labrador | 72 | 65 | 31 | 20 |
| Prince Edward Island | 82 | 73 | 43 | 16 |
| Nova Scotia | 85 | 77 | 43 | 21 |
| New Brunswick | 81 | 70 | 39 | 23 |
| Quebec | 81 | 63 | 36 | 42 |
| Ontario | 87 | 76 | 50 | 33 |
| Manitoba | 78 | 62 | 53 | 29 |
| Saskatchewan | 84 | 64 | 55 | 26 |
| Alberta | 80 | 64 | 46 | 34 |
| British Columbia | 87 | 71 | 53 | 36 |
Note(s): As a percentage of all households.
Source(s): Statistics Canada, Environment Accounts and Statistics Division, Households and the Environment Survey, 2007, CANSIM Table 153-0059.
Table 3: Household participation rates for environmental behaviours, by province, 2006
| Low-flow showerhead | Reduced volume toilet | Compact fluorescent light bulbs | Composting | Recycling | Lowering temperatures | |
|---|---|---|---|---|---|---|
| percent1 | ||||||
| Newfoundland and Labrador | 58 | 27 | 53 | 23 | 94 | 62 |
| Prince Edward Island | 55 | 27 | 59 | 92 | 99 | 59 |
| Nova Scotia | 54 | 30 | 60 | 71 | 99 | 58 |
| New Brunswick | 55 | 31 | 61 | 79 | 96 | 48 |
| Quebec | 59 | 29 | 48 | 14 | 95 | 55 |
| Ontario | 60 | 43 | 65 | 38 | 98 | 51 |
| Manitoba | 46 | 35 | 50 | 23 | 98 | 50 |
| Saskatchewan | 37 | 34 | 53 | 29 | 96 | 63 |
| Alberta | 49 | 41 | 59 | 24 | 96 | 59 |
| British Columbia | 53 | 35 | 65 | 31 | 99 | 56 |
| Canada | 56 | 37 | 59 | 30 | 97 | 54 |
1. As a percentage of all households have a thermostat and that have access to at least one recycling program.
Source: Statistics Canada, Households and the Environment Survey, 2006, Special tabulation.
For more information see EnviroStats, Winter 2008 and Statistical tables, Statistics Canada.
Appendix 3 - Changes in Trans portation Choices
Source: Canadian Urban Transit Authority
Appendix 4 - "Most Important Problem Facing Canada Today"
| Per cent saying: | September 20081 | November 20072 |
|---|---|---|
| Economy | 30 | 6 |
| Health care/health care system | 20 | 17 |
| Environment/pollution/global warming | 15 | 16 |
| Poverty/homelessness/hunger | 9 | 5 |
| Crime | 5 | 4 |
| Taxes | 4 | 4 |
| Education | 3 | 2 |
| Leadership/ethics/accountability | 3 | n/a |
| Energy | 3 | n/a |
| Unemployment | 2 | 4 |
| Afghanistan | 1 | 4 |
| Terrorism/international issues | 1 | 2 |
| Other (including no opinion) | 4 | 34 |
1 Source: Angus Reid Strategies. For more information see Economy is Clearly the Most Pressing Concern for Canadians.
2. Source: Human Resources and Social Development Canada. For more information see Public Opinion Research Reports - Custom research commissioned by HRSDC on Skills and Employment.
- Date modified: