ARCHIVED - Canadian Energy Demand: Passenger Transportation - Energy Briefing Note
This page has been archived on the Web
Information identified as archived is provided for reference, research or recordkeeping purposes. It is not subject to the Government of Canada Web Standards and has not been altered or updated since it was archived. Please contact us to request a format other than those available.
ISSN 1917-506X
Canadian Energy Demand: Passenger Transportation - Energy Briefing Note [PDF 375 KB]
Energy Briefing Note
Canadian Energy Demand
Passenger Transportation
January 2009
Copyright/Permission to Reproduce
Table of Contents
- Foreword
- Introduction
- Passenger Transportation Energy Demand Trends
- Emerging Passenger Transportation Energy Demand Trends
- Observations
Foreword
The National Energy Board (NEB or the Board) is an independent federal agency that regulates several aspects of Canada's energy industry. Its purpose is to promote safety and security, environmental protection and efficient energy infrastructure and markets in the Canadian public interest within the mandate set by Parliament in the regulation of pipelines, energy development and trade. The Board's main responsibilities include regulating the construction and operation of interprovincial and international oil and gas pipelines as well as international and designated interprovincial power lines. The Board regulates pipeline tolls and tariffs for pipelines under its jurisdiction. In terms of specific energy commodities, the Board regulates the exports and imports of natural gas as well as exports of oil, natural gas liquids (NGLs) and electricity. Additionally, the Board regulates oil and gas exploration, development and production in Frontier lands and offshore areas not covered by provincial or federal management agreements. The Board's advisory function requires keeping under review matters over which Parliament has jurisdiction relating to all aspects of energy supply, transmission and disposal of energy in and outside Canada.
The NEB monitors energy markets to objectively analyze energy commodities and inform Canadians about trends, events, and issues. The Board releases numerous research reports. This report is a briefing note - a brief report covering one aspect of energy commodities. Specifically, this report examines trends in Canadian passenger transportation energy demand.
If a party wishes to rely on material from this report in any regulatory proceeding before the NEB, it may submit the material, just as it may submit any public document. Under these circumstances, the submitting party in effect adopts the material and that party could be required to answer questions pertaining to the material.
Introduction
With our huge land mass, widely dispersed population centres and the importance of the goods producing sector, transportation is critical to the Canadian economy. In 2006, 2 492 petajoules (PJ) of energy were consumed to fuel this important service, which is roughly a third of all Canadian end-use energy consumption[1]. The transportation sector is unique. A little over half of this energy is used to transport people and the remainder is related to the transport of goods. Unlike other end-use sectors this sector relies heavily on a single source of energy - oil - to meet demand requirements. In 2006, over 99 per cent of all transportation energy consumption was from oil products, such as motor gasoline, diesel fuel, heavy fuel oil and aviation fuel.
[1] End-use consumption is energy used by consumers in the residential, commercial, industrial and transportation sectors. For the purposes of this note, the transportation sector is made up of on-road as well as air, rail and marine transportation but excludes pipeline transportation energy demand.
Since 2002, global crude oil prices have risen dramatically. The first six months of this year saw a very rapid escalation in average monthly crude oil prices, increasing almost 45 per cent between January and July of 2008, culminating in a West Texas Intermediate (WTI) intraday high of slightly more than US$147 dollars per barrel on 11 July 2008. Prices fell through the remainder of the summer and into the fall. The decline in price was driven by a combination of factors including a deepening financial crisis and falling global crude oil demand due to high consumer prices and a worsening U.S. and global economic outlook.
Higher global crude oil prices contributed to higher transportation fuel prices in Canada. Between 2002 and 2007 total gasoline and diesel demand continued to increase despite these higher product prices. It was not until 2008 that evidence emerged to suggest prices were impacting transportation demand in Canada. Statistics showed a decrease in activity and in fuel sales starting in the first half of 2008. Global financial problems and the potential for an economic slowdown in Canada could further compound decreases in transportation activity and energy demand in the near-term. It is generally believed that transportation energy demand is more responsive in the short term to changes in income than changes in prices.
This briefing note focuses on key trends in Canadian passenger transportation energy demand. The first section defines passenger transportation and highlights major trends over the last decade or longer. The following section describes key energy demand changes that have emerged over the last year and highlights potential future trends. The briefing note concludes with observations surrounding passenger transportation energy demand trends.
Passenger Transportation Energy Demand Trends
Total Canadian transportation energy demand is the second largest end-use sector in Canada (Figure 1). To better understand transportation demand trends, the sector is frequently divided into passenger, freight and off-road transportation. Passenger transportation accounts for more than half of total transportation energy demand. Not surprisingly, the largest component of this demand is from on-road transportation.
Figure 1: Breakdown of Transportation Energy Demand in Canada, 2006
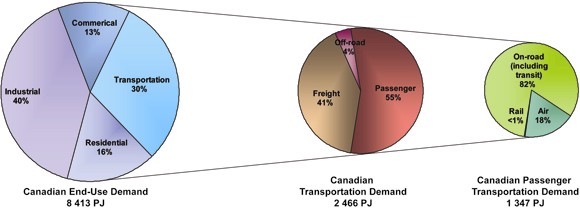
Source: Office of Energy Efficiency, Natural Resources Canada
On-Road Passenger Transportation
On-road transportation includes small and large cars, light passenger trucks (e.g., pickup trucks, minivans, sport utility vehicles (SUVs)), motorcycles, school buses, urban transit and inter-city buses. In 2006, Canadians consumed 1 123 PJ for on-road passenger transportation. This accounts for roughly 45 per cent of total transportation demand in Canada and about 13 per cent of total end-use energy consumption in the country. Currently, less than two per cent of on-road passenger vehicles are fueled by alternative sources of energy, such as electricity, natural gas, propane and renewable fuels[2].
[2] Alternative vehicle technologies are discussed in more detail in the Emerging Passenger Transportation Energy Demand Trends section.
The majority of energy consumed in this sector is by cars and light trucks. In 2006, less than five per cent of energy demand was used by buses. Buses are more likely to run on alternative fuels than cars and light trucks.
From 1990 to 2006 average passenger on-road transportation energy demand increased by 0.9 per cent per year. There are a number of factors that contribute to energy demand growth in this mode, including the number and length of trips taken, vehicle choice and technology, and government regulations.
Canadian transportation activity, measured as either passenger-kilometres traveled or vehicle- kilometres traveled, have generally increased. Passenger-kilometres, which describes the transportation of one passenger over a distance of one kilometre (km) and basically represents the total annual distance traveled by on-road passengers in Canada, has increased by 1.8 per cent per year between 1990 and 2006.
Since 2000, the first full year of available data, light vehicle[3] kilometres traveled have increased by an average of 0.9 per cent per year[4]. Canadian light vehicles are estimated to have traveled more than 300 billion kilometres in 2007[5]. Vehicle-kilometres traveled measures the total distance traveled by all vehicles in a given year.
[3] Light vehicles are defined as those vehicles weighting up to 4.5 tonnes. These vehicles generally represent passenger vehicles in Canada. Medium and heavy vehicles weighting more that 4.5 tonnes generally refer to freight traffic.
[4] Canadian Vehicle Survey: Quarterly. Statistics Canada, 1997-2007. Catalogue No. 53F0004X
[5] Canadian Vehicle Survey: Annual. Statistics Canada, 2008. Catalogue No. 53F0004XWE.
Population density and income are two of the most important factors influencing passenger transportation demand in Canada[6]. Urban areas tend to have less per capita transportation demand than rural areas as residents generally live closer to work and to necessary services (e.g., health and educational institutions, retail stores, etc.). Increasing income leads to increases in transportation demand. As consumers become wealthier they are more likely to purchase additional vechilces, engage in more travel and take additional discretionary trips.
[6] Build It and Will They Drive? Modelling Light-Duty Vehicle Travel Demand. Conference Board of Canada.
In 2007, Alberta and Saskatchewan had the highest levels of per-capita travel, with estimates of passenger-kilometres per person greater than seventeen thousand kilometres per person[7]. Over the recent past, Alberta has had one of the highest, if not the highest, level of personal disposable income per capita in the country. This has likely contributed to high transportation demand in the province. On the other hand, Saskatchewan's high transportation demand is likely related to the combination of roughly average personal disposable income per capita in Canada and a lower population density than the Canadian average[8].
[7] Per capita passenger-kilometres are total passenger-kilometres per province divided by population. Estimates of passenger-kilometres are from Canadian Vehicle Survey: Annual. Statistics Canada, 2008. Catalogue No. 53F0004XWE. Population data is from Annual Demographic Estimates: Canada, Provinces and Territories. Statistics Canada, 2008. Catalogue No. 91-215-X.
[8] 2006 Census - Population and dwelling counts. Statistics Canada.
Despite relatively high personal disposable income per capita numbers in British Columbia, residents traveled the least, with an estimate of less than thirteen thousand passenger-kilometres per person in 2007[9]. This could be related to the population density of the province measured as the share of residents living in urban areas. British Columbia has the highest population density in the country with over 85 percent of the population living in urban areas[10].
[9] Per capita passenger-kilometres are total passenger-kilometres per province divided by population. Estimates of passenger-kilometres are from Canadian Vehicle Survey: Annual. Statistics Canada, 2008. Catalogue No. 53F0004XWE. Population data is from Annual Demographic Estimates: Canada, Provinces and Territories. Statistics Canada, 2008. Catalogue No. 91-215-X.
[10] 2006 Census - Population and dwelling counts. Statistics Canada.
Increasing transportation activity has resulted in increased energy demand. Figure 2 demonstrates the relationship between increasing passenger-kilometres and increasing energy consumption for on-road passenger transportation. It is interesting to note that on-road energy demand has not grown as quickly as passenger-kilometres, providing evidence of improvements in energy intensity over time. Intensity could be improving as a result of improvements in vehicle fuel economy or increasing number of passengers in a vehicle.
Figure 2: On-road Passenger Activity and Energy Consumption
Source: Office of Energy Efficiency, Natural Resources Canada
Canada's growing population has contributed to increased activity in on-road transportation. Between 1990 and 2006, Canada's population aged 16 and over grew by 1.3 per cent per year. Further, the combination of relatively flat energy prices and growing personal disposable income throughout the 1990s helped make personal transportation more affordable. Up until the summer of 2008, the proportion of disposable income spent on gasoline was only around three per cent[11]. This has likely played a role in consumers' transportation decisions and influenced transportation demand and energy demand trends.
[11] Over a barrel? Canada and the rising cost of energy. Canadian Economic Observer, Statistics Canada, August 2008. Catalogue no. 11-010-XIB. Written by P. Cross and Z. Ghanem.
Transportation demand is affected by the types of neighbourhoods and municipalities in which people live. The 2006 census shows that Canadians are increasingly living in urban areas and that significant growth has occurred in the suburbs of large cities rather than in the city core. These "edge cities" have grown by 11 per cent between 2001 and 2006, which is twice the national average growth rate[12]. As the distance between the neighbourhood of residence and the city centre increases, people are increasingly likely to drive. The commuting distance from home to work continues to increase in Canada. Canadians traveled an estimated median of 7.6 kilometres to work in 2006, up from 7.0 kilometres in 1996[13].
[12] Sustainable Urban Transportation: A Winning Strategy for Canada.
Conference Board of Canada, 2007.
[13] Commuting Patterns and Place of Work of Canadians, 2006 Census. Statistics Canada, 2008.
Over time, Canadians have become more dependent on their automobiles. The number of Canadians aged 18 and over who travelled everywhere by car on the survey reference date rose from 68 per cent in 1992 to 74 per cent in 2005, and the number of people that made a trip under their own power by bicycle or on foot declined from 26 per cent in 1992 to 19 per cent in 2005[14].
[14] Dependence on cars in urban neighbourhoods. Canadian Social Trends No. 85, Statistics Canada, 2008001. Written by Martin Turcotte.
The density of the neighbourhood in which people live also has an influence on driving habits. Those that live in more densely-populated areas are almost half as likely to make a car trip during the day than those that live in neighbourhoods comprised almost exclusively of suburban-type dwellings[15]. This reflects the fact that higher-density neighbourhoods, in particular those that are characterized by a greater mix of residential, commercial and industrial uses, make it easier for people to walk, bike and/or use public transit.
[15] Dependence on cars in urban neighbourhoods. Canadian Social Trends No. 85, Statistics Canada, 2008001. Written by Martin Turcotte.
As mentioned above, the intensity of on-road passenger vehicle transportation, measured as joules of energy consumed per passenger-kilometre, has improved. Although not accounting for all trips made, part of the explanation for this trend could be related to marginal changes in the way people commute to work. Eleven per cent of Canadian workers used public transit to get to work in 2006, up from 10.1 per cent in 1996[16]. It is important to note that in some cases data is lagged and that these statistics could have changed in recent years with the changes in prices. A fuller description of recent trends, focusing on data currently available, is contained in the next section.
[16] Commuting Patterns and Place of Work of Canadians, 2006 Census. Statistics Canada, 2008.
Not only has transportation activity increased, but consumer preferences have also evolved, contributing to growing passenger transportation energy demand. Twenty years ago, passenger cars accounted for roughly 70 per cent of all new vehicle sales in Canada. However, light trucks, including minivans and SUVs, have increasingly gained market share. By 2007, light truck sales accounted for almost half of all Canadian vehicle sales (Figure 3). Saskatchewan and Alberta have the highest market shares for new light truck sales, with such vehicles accounting for over 60 per cent of new vehicle sales in the first two quarters of 2008[17]. Historically, these provinces have demonstrated a preference for light trucks versus passenger cars.
[17] New Vehicle Sales. Statistics Canada, 2008. Catalogue no. 63-007-X
Figure 3: Annual Sales of New Motor Vehicles in Canada, by Type
Source: Statistics Canada
Over time, both passenger cars and light trucks have experienced improvements in fuel economy due to advancements in vehicle technology (Figure 4). The average fuel efficiency for passenger cars sold in Canada has improved by 8.5 per cent from 1990 to 2006 and the average fuel efficiency for light trucks has improved by 6.1 per cent over the same period. However, the combined fuel economy of Canadian new vehicle sales worsened throughout the 1990s due to shifting preferences towards light trucks. In 1988, the combined fuel economy of passenger cars and light trucks was 8.9L/100km[18]. It trended upward throughout the 1990s, reaching over 9.5 litres (L)/100 km by 1999. In recent years, the value has started to decline once again. By 2006, it was almost the same level as it was two decades ago, reaching roughly 9.0 L/100 km.
[18] Company Average Fuel Consumption, Transport Canada.
Figure 4: On-road Average Fuel Consumption for New Vehicles
Source: Office of Energy Efficiency, Natural Resources Canada, Transport Canada and NEB
However, new vehicles only represent about 10 per cent of vehicles on the road in any given year It takes many years for the vehicle stock to turn over. In 2007, the average age of registered light vehicles in Canada was approximately 8.5 years and over a quarter of all the light vehicles on the road were at least 12 years old[19].
[19] Canadian Vehicle Survey: Annual. Statistics Canada, 2008. Catalogue No. 53F0004XWE.
Government programs and polices can have a significant influence on passenger transportation energy demand for new vehicles. In response to the oil embargo in the 1970s, both Canada and the United States adopted fuel efficiency standards. The United States enacted legislation that established the Corporate Average Fuel Economy (CAFE) standards for motor vehicles. The Act required improved sales-weighted fuel economy for both new passenger cars and light trucks sold in the U.S.
Canada adopted a similar program called Company Average Fuel Consumption (CAFC) targets. These targets were set on a voluntary basis with the motor vehicle industry. The targets were designed to coincide with U.S. CAFE standards because of the highly integrated nature of the Canadian and U.S. auto industries, with each automotive plant producing vehicles for the entire North American market.
Transport Canada concluded that after the introduction of the CAFE/CAFC standards there was a noticeable improvement in the fuel economy of the Canadian vehicle fleet[20]. Between 1978 and 2004, the total number of registered vehicles in Canada increased by more than 50 per cent; however, total gasoline consumption only increased by 10 per cent with the majority of this increase happening in the last several years[21]. It is also interesting to note that gasoline consumption did not exceed the 1980 level again until the end of the 1990s when the growth in the vehicle fleet and increased transportation activity offset the vehicle efficiency standards, which had effectively stabilized (Figure 4).
[20] Background Paper for the Development of Motor Vehicle Fuel Consumption Regulations. Transport Canada, 2008.
[21] ibid.
Over the last two decades, energy demand in the transportation sector has been increasing as a result of increasing population and income; relatively low energy prices; increasing transportation activity; and, consumer preferences with respect to where individuals live and the types of vehicles that they drive. Technological improvements that have translated into energy efficiency improvements, government standards and regulations and some changes to the intensity of personal transportation, have combined to temper energy demand growth. However, the overall trend has been increasing energy consumption for on-road passenger transportation.
Air Transportation
The next largest and fastest growing mode of passenger transportation energy consumption is air transportation. In 2006, Canadians consumed almost 250 PJ of energy for passenger air transportation. This accounts for roughly 18 per cent of passenger transportation energy demand, 10 per cent of total transportation energy demand, and three per cent of total end-use energy consumption in Canada. Average energy demand growth between 1990 and 2006 was two per cent per year. The key factors influencing passenger air transportation demand are the same as in on-road transportation. They include activity, transportation technology and government programs and policies.
With the exception of the period between 2001 and 2003, coinciding with the 9/11 terrorist attacks in the U.S. and the global SARS outbreak, activity for this mode of transportation has experienced rapid growth over the last decade or more. In fact, passenger-kilometres grew an average of 3.8 per cent per year between 1990 and 2006. More recently, the major Canadian air carriers reported a 6.4 per cent increase in passengers and a 5.7 per cent increase in passenger-kilometres in 2007 from 2006 levels[22]. Increasing passenger travel coincides with increases in air transportation energy consumption (Figure 5).
[22] Civil Aviation, Monthly Key Operating Statistics, Major Canadian Air Carriers. Statistics Canada, 2008. Catalogue no. 51-004-XWE.
Figure 5: Passenger Air Transportation Activity and Energy Demand
Source: Office of Energy Efficiency, Natural Resources Canada
Air activity has grown faster than air transportation energy demand resulting in an average energy intensity improvement in passenger air transportation of 0.5 per cent per year.
According to a study commissioned by the Air Transport Association of Canada (ATAC), the airline industry has a significant incentive to reduce fuel costs because it is the single largest aircraft operating expense[23]. Improvements in energy intensity can come from technological advancements. For example, modern aircraft achieve fuel efficiencies of 3.5 litres per 100 passenger-kilometres. New technologies, such as the Airbus A380 and the Boeing 787, are aiming for 3 litres per 100 passenger-kilometres. In addition, improvements in operational efficiency and air traffic management, such as making the fullest use of polar routes to save significant flight time, replacing older/less efficient aircraft, increasing load factors, optimizing aircraft speed, and reducing taxiing, could also result in improved fuel use[24].
[23] Canadian Aviation and Greenhouse Gases: Literature Review. Jacobs Consultancy Canada Inc., 2007.
[24] ibid.
Currently, air transportation em on refined petroleum products to meet energy requirements. Although alternative fuels are not currently available, research and development is underway to examine the feasibility of using synthetic fuel, bio-jet fuel and in the very long-term, low or zero carbon fuel[25]
[25] Canadian Aviation and Greenhouse Gases: Literature Review. Jacobs Consultancy Canada Inc, 2007.
Rail Transportation
The smallest consumer of passenger transportation energy is rail transportation accounting for less than one per cent of total passenger energy demand. In 2006, total energy demand for this mode was 2.5 PJ of diesel fuel.
Over the last decade, the average number of passengers using rail transportation has increased, but the journey length has fallen resulting in decreased passenger-kilometres (Figure 6). In 1996, the average journey length was 391 kilometres but by 2005 the average length had fallen by 12 per cent to 344 kilometres[26,27]. Similarly, rail transportation energy demand is also declining.
[26] Railway Trends 2006. Railway Association of Canada, 2006.
[27] Railway Trends 2007. Railway Association of Canada, 2007.
Figure 6: Passenger Rail Transportation Activity and Energy Demand
Source: Office of Energy Efficiency, Natural Resources Canada
VIA Rail represents the majority of Canada's intercity passenger transportation services, accounting for 95 per cent of all passengers in 2006[28]. Over the next few years, VIA Rail plans to rebuild their entire locomotive fleet, extending the service life of the current locomotives by 15 to 20 years, while at the same time improving fuel economy and saving up to five million litres of fuel annually. As well, they will also be renewing passenger cars in the Quebec City-Windsor corridor. These changes will contribute to improvements in the energy intensity of this mode of transportation[29].
[28] Railway Trends 2007. Railway Association of Canada, 2007.
[29] Annual Report: Year in Review. VIA Rail, 2007.
Emerging Passenger Transportation Energy Demand Trends
Behaviour Trends
Energy markets over the last few years have experienced significant changes. Crude oil saw volatile and steadily increasing prices between 2002 and the middle of 2008. Since the middle of 2008, energy prices have fallen in response to a deepening financial crisis and falling global crude oil demand due to high consumer prices and a worsening U.S. and global economic outlook. Over the same time, public opinion polls report that Canadians are increasingly concerned with environmental issues[30]. These changes are expected to have an impact on transportation demand and energy use.
[30] 35 percent of Canadian respondents thought the environment was the most important issue facing the country, followed by health care (19 percent), tax relief (10 percent), poverty (6 percent), crime (6 percent) and the economy (6 percent). Environment is Key Issue for Canadians, Angus Reid Global Monitor, 23 January, 2007.
Generally, it was expected that the higher transportation fuel prices between 2002 and the middle of 2008 would affect transportation energy demand. In the short-term, consumers were expected to respond to higher oil prices by changing the intensity of vehicle use, by taking fewer and shorter trips, for example. Consumers were also expected to reduce discretionary travel and to switch to public transit or increase biking and walking.
In the medium-term, if higher oil prices were to prevail, we would expect that the choice of vehicle purchased would be affected, in particular regarding vehicle fuel efficiency.
In the long-term, sustained high oil prices would affect the characteristics of the vehicle fleet, such as the fleet size and efficiency as well as the fuel mix (i.e., In the long-term, sustained high oil prices would affect the characteristics of the vehicle fleet, such as the fleet size and efficiency as well as the fuel mix (i.e., increased penetration of alternative fuel vehicles). It might also affect other infrastructure that determines transportation energy demand, such as urban design (e.g., locations of houses and businesses, public transit capacity).
Energy prices in the latter part of 2008 decreased significantly from the high levels reached in the summer. Reduced transportation fuel prices would be expected to result in increased demand for transportation fuels. However, these reduced prices are occurring at the same time as global and Canadian economic conditions are worsening. It is generally believed that transportation energy demand is more responsive in the short term to changes in income than changes in prices. Historically, the volume of gasoline purchased fell 12.1 per cent between 1980 and 1984 and 5.1 per cent between 1989 and 1991[31]. These periods were recessionary periods that impacted real Canadian incomes, as well as periods of higher fuel prices. Therefore, current slowing economic conditions could result in further reduced transportation energy demand and activity in Canada.
[31] Over a barrel? Canada and the rising cost of energy. Canadian Economic Observer, Statistics Canada, August 2008. Catalogue no. 11-010-XIB. Written by P. Cross and Z. Ghanem.
Turning to the data, between 2002 and 2007, there was little evidence of changes in passenger transportation activity or fuel demands despite rapid increases in crude oil and refined petroleum product prices. In fact, total passenger kilometres grew by 3.5 per cent[32], domestic sales of gasoline rose 7.4 per cent and domestic sales of diesel increased 22.7 per cent between 2002 and 2007[33]. At the same time, the average retail price of gasoline in central Canada increased by over 45 per cent and the average retail price of automotive diesel fuel increased by almost 70 per cent[34].
[32] Canadian Vehicle Survey: Quarterly. Statistics Canada, 2002-2007. Catalogue No. 53F0004X.
[33] Energy Statistics Handbook. Statistics Canada, Second quarter 2008
[34] ibid.
Data available for the first part of 2008 show reductions in personal transportation activity and transportation fuels. This coincides with a significant increase in crude oil and petroleum product prices. In the first quarter of 2008, the proportion of Canadians' disposable income spent on gasoline increased to 3.8 per cent, higher than the previous record of 3.3 per cent reached in 1983[35].
[35] Over a barrel? Canada and the rising cost of energy. Canadian Economic Observer, Statistics Canada, August 2008. Catalogue no. 11-010-XIB. Written by P. Cross and Z. Ghanem.
Canadians drove their light vehicles 3.4 per cent fewer kilometres in the first quarter of 2008 than over the same period in 2007[36]. This result can be partially attributed to severe weather conditions in much of the country during the first three months of the year. However, the use of light trucks (e.g., vans, SUVs, trucks) dropped 15 per cent from 2007 levels, whereas passenger cars were driven 8 per cent more. This could suggest that consumers responded to rapidly-increasing oil prices by switching from less fuel efficient vehicles to more fuel efficient vehicles.
[36] Canadian Vehicle Survey: Quarterly. Statistics Canada, 2008. Catalogue No. 53F0004XE.
Similarly, preliminary data show domestic sales of gasoline in the summer, typically the time of the year when gasoline sales are the highest, were lower this year than last year. Between April and August of 2008, monthly gasoline sales fell by up to 5.4 per cent from 2007 levels. However, despite this decrease, domestic gasoline sales were still within the range of sales over the last five years (Figure 7).
Figure 7: Domestic Motor Gasoline Sales, 2002-2008
Source: Statistics Canada
In addition, there has also been some indication that the preference for light trucks was waning in Canada. So far, preliminary data for new Canadian motor vehicle sales for 2008 show a trend away from light trucks and toward passenger cars. As of August 2008, light truck sales were down 5.4 per cent over last year and passenger cars were up 7.7 per cent[37]. The market share of new light trucks declined in all provinces relative to 2007 levels, even in Alberta and Saskatchewan where their market share is highest. Interestingly, this is a reversal of the trend observed in 2007, where the market share of light trucks increased in all provinces relative to 2006.
[37] New Vehicle Sales. Statistics Canada, 2008. Catalogue no. 63-007-X.
Finally, in 2008, the combined ridership on the ten major urban transit systems in Canada, which account for about 80 per cent of the country's urban transit, is higher than it has been over the last five years (Figure 8). In fact, ridership in 2008 is up to seven per cent higher than over the same period last year.
Figure 8: Ridership on Ten Major Urban Transit Systems in Canada, 2003-2008
Source: Statistics Canada
Transportation energy demand is more sensitive to changes in income than changes in prices. Although data is not yet available, anecdotal evidence suggests that changes are already being felt in other forms of passenger transportation. Despite falling crude oil prices, the outlook for the Canadian airline sector has deteriorated in the latter part of 2008 in response to current economic conditions. According to the International Air Transportation Association, North American carriers saw a 0.9 per cent decline in passenger traffic in September of this year, after five months of positive growth[38].
[38] Airlines Experience 'Alarming' Drop in Passengers. Financial Post, 24 October 2008. Written by Scott Deveau.
In addition, changing attitudes with respect to environmental issues could also influence personal transportation decisions. There is an increasing proportion of Canadian commuters carpooling and taking public transit. In 2006, 7.7 per cent of people traveled to work as a passenger in a car, which is notably higher than the 2001 proportion of 6.9 per cent[39]. A number of factors in addition to changing attitudes are likely influencing this statistic, including higher energy prices and an increased number of carpool lanes in major cities.
[39] Commuting Patterns and Place of Work of Canadians, 2006 Census. Statistics Canada, 2008.
Looking forward, uncertainty about near-term economic growth, future energy prices and behaviour changes with respect to changing consumer attitudes makes it challenging to determine future energy demand growth trends in personal transportation. Other factors that are expected to influence future transportation energy demand trends are changes to vehicle technology, consumer preferences and government regulations.
Technology Trends
Despite the fact that mass market produced vehicles have been around for 100 years and have already undergone significant technological advancements since the Ford Model T, there is still room to improve conventional vehicle technologies. According to the U.S. government[40], only about 15 per cent of the energy put into a typical gasoline vehicle is used to move the vehicle or to run useful accessories, such as air conditioning. The remainder of the energy is lost to waste heat, idling and other inefficiencies. Continued technological improvements, including aerodynamic and lightweight vehicle body materials, advancements in engine and transmission technologies and other developments, have the potential to significantly improve fuel efficiency. Examples of engine and transmission technologies available are described in Table 1.
[40] Advanced Technologies and Energy Efficiency. US Department of Energy, Energy Efficiency, and Renewable Energy and US Environment Protection Agency.
Table 1: Energy Efficiency Improvements Associated with Conventional Vehicles
| Technology | Average Efficiency Increase (%) |
|---|---|
| Engine Technologies | |
| Variable Valve Timing and Lift: improves engine efficiency by optimizing the flow of fuel and air into the engine for various engine speeds. | 5 |
| Cylinder Deactivation: saves fuel by deactivating cylinders when they are not needed. | 7.5 |
| Turbochargers and Superchargers: increase engine power, allowing manufacturers to downsize engines without sacrificing performance or to increase performance without lowering fuel economy. | 7.5 |
| Integrated Starter/Generator (ISG) Systems: automatically turn the engine on or off when the vehicle is stopped to reduce fuel consumed during idling. | 8 |
| Direct Fuel Injection: with turbocharging or supercharging, delivers higher performance with lower fuel consumption. | 11-13 |
| Transmission Technologies | |
| Continuously Variable Transmissions (CVTs): have an infinite number of gears, providing seamless acceleration and improved fuel economy. | 6 |
| Automated Manual Transmissions (AMTs): combine the efficiency of manual transmissions with the convenience of automatics (gears shift automatically). | 7 |
Source: U.S. Department of Energy, Energy Efficiency, and Renewable Energy and U.S. Environment Protection Agency
In addition to improving conventional internal combustion engine technologies, there are also other vehicle technologies available that have the potential to impact future energy demand trends. Examples of other vehicle technologies include hybrid electric vehicles, clean diesel vehicles, flex-fuel vehicles (vehicles designed to run on gasoline or a blend of up to 85 per cent ethanol), alternative fuel vehicles (e.g., ethanol, biodiesel, natural gas, propane, and hydrogen), plug-in hybrids, grid chargeable electric vehicles, and fuel cell vehicles.
Currently, the vast majority of passenger vehicles in Canada are conventional internal combustion engines. The potential for alternative vehicle technologies to make significant in-roads into the transportation sector depends largely on the economics of the vehicle technology and fuel, consumer preferences and rates of vehicle turnover. Although attitudes can change rapidly, it takes time for new technologies to permeate the market.
The most recent technology that has gained mass market appeal is hybrid-electric vehicles, which run on gasoline and an internal battery. These vehicles obtain much better fuel economy than conventional vehicles. The first commercial hybrid electric vehicle was the Toyota Prius, which was introduced in Japan in 1997 and globally in subsequent years. Over the last decade, these vehicles have proven to be popular and spurred the expansion of hybrid electric vehicles to other manufacturers and vehicle body types, such as SUVs[41]. In 2007, Toyota announced that it had sold over 1 million Prius vehicles worldwide. While this is a significant achievement, this represents only a small proportion of vehicles sold globally. In 2006, approximately 9 500 hybrids were sold in Canada accounting for about 0.5 per cent of total sales[42]. This number is expected to grow as hybrids are introduced across various vehicle types, which has improved consumer appeal.
[41] Hybrid Vehicle Timeline. Hybrid Center, Union of Concerned Scientists, 2007.
[42] Hybrid Vehicle Market Growing Every Year. CTV, 11 April 2007.
Lately there has been tremendous interest in grid chargeable electric vehicles (EV) and plug-in hybrid electric vehicles (PHEV). Although the data is not available for Canada, a recent study for the UK determined that the uptake of these vehicle technologies is unlikely to occur before 2014 due to vehicle development lead times, mass market production and volume availability[43]. The study concluded that by 2020 EV and PHEV vehicles could account for 2.5 per cent of the accumulated vehicle stock in the UK and 11.7 per cent by 2030 (mid-range scenario). The study also suggests that the further wide-spread adoption of EVs and PHEVs will require increased consumer confidence and education, improvements in battery performance and cost, charging infrastructure which keeps pace with demand, and market incentives that encourage vehicle adoption.
[43] Investigation into the Scope for the Transport Sector to Switch to Electric Vehicles and Plug-in Hybrid Vehicles. Department for Business Enterprise & Regulatory Reform, October 2008.
Regulation Trends
Increasing concerns about environmental issues has led to the development of new programs and polices for the transportation sector. In 2004, the California Air Resources Board approved regulations to manage greenhouse gas (GHG) emissions from light-duty vehicles, which would likely have an impact on vehicle fuel efficiency. The regulations were expected to reduce GHG emissions from California passenger vehicles by about 22 per cent by 2012 and about 30 per cent by 2016[44].
[44] California Air Resources Board (CARB), 2008.
Fifteen other states and some of Canada's provinces, including British Columbia, Manitoba, Prince Edward Island, Nova Scotia and Quebec, have expressed an interest in adopting California's proposed standards. However, there is some uncertainty surrounding the future of California's standards. In the U.S., individual states can not impose fuel economy and emission standards on vehicles. California has special status under the Clean Air Act. Using this special status, California applied to the U.S. Environmental Protection Agency (EPA) to develop GHG regulations for new passenger vehicles starting in 2009. The EPA denied the request at the end of 2007. Currently, California is petitioning the decision to the U.S. Court of Appeals[45].
[45] California Air Resources Board (CARB), 2008.
Recently, the U.S. federal government announced amendments to CAFE legislation in the Energy Independence and Security Act of 2007. The new legislation requires standards to be set from the model year 2011, such that by 2020 the average fuel economy among new vehicles sold reaches or 6.7 L/100 km. The Act also expands manufacturers' flexibility in meeting annual standards, which includes credit trading between both fleet classes (car and light trucks) between manufacturers, and also allows manufactures to receive credits for alternative and flex-fuelled vehicles[46].
[46] Background Paper for the Development of Motor Vehicle Fuel Consumption Regulations. Transport Canada, 2008.
On 5 April 2005, the Canadian federal government signed a voluntary Memorandum of Understanding (MOU) with the automotive industry respecting automobile greenhouse gas emissions. The voluntary agreement requires the industry to reduce annual GHG emissions from Canada's vehicle fleet by 5.3 million tonnes below business-as-usual projections in the year 2010.
In April 2007, the Canadian federal government announced its intent to regulate the fuel consumption of motor vehicles, upon the expiry of the voluntary GHG MOU, starting with the 2011 model year. Given the highly integrated nature of the North American automotive industry, the Canadian government has indicated that it will examine U.S. proposals in the development of a Canadian standard, including recent U.S. federal legislation and proposed California standards. Final Canadian regulations are expected in the near-term.
Other regulations that are expected to have an impact on Canadian transportation demand trends are carbon dioxide taxes and renewable fuel standards. These policies could influence future transportation energy demand trends by curbing demand growth and/or by encouraging substitution away from refined petroleum products.
In January 2007, California announced the intention to establish a Low-Carbon Fuel Standard (LCFS) for transportation fuels sold in California. The initial goal of the LCFS is to reduce the carbon intensity of California's passenger vehicle fuels by at least 10 percent by 2020[47]. The standard will be calculated on a lifecycle basis, which means that it will include emissions from the upstream production of the fuels. Fuel providers in the State can achieve the LCFS standard by blending low-carbon biofuels into gasoline products, purchasing credits from low-carbon electric utilities, diversifying into low-carbon hydrogen as a product, and other yet to be developed strategies. The California Environmental Protection Agency's Air Resources Board has announced that LCFS regulation will be adopted and implemented by 2010[48]. In Canada, both the Ontario and British Columbia governments have signed an MOU with California committing to the adoption of California's LCFS[49,50].
[47] White Paper: The Role of a Low Carbon Fuel Standard in Reducing Greenhouse Gas Emissions and Protecting our Economy. State of California, Office of the Governor.
[48] Low Carbon Fuel Standard Program. California Environmental Protection Agency Air Resources Board.
[49] Ontario to Adopt Low Carbon Fuel Standard. State of California, Office of the Governor.
[50] British Columbia Adopts California's Low Carbon Fuel Standard. State of California, Office of the Governor.
In October 2007, Quebec implemented the first carbon tax in Canada. The carbon tax will be collected directly from energy suppliers. Overall, Quebec plans to collect about $200 million annually, which translates into just under one cent a litre from petroleum companies in the province[51]. In July 2008, British Columbia introduced an escalating carbon tax, which will be levied at the end-use level. The tax starts at over two cents per litre and escalates at roughly one cent per litre until 2012[52].
[51] Quebec to collect nation’s 1st carbon tax. CBC news.ca, 7 June 2007.
[52] Carbon Tax Rates by Fuel Type. British Columbia Ministry of Small Business and Revenue, 2009.
The federal government and many provincial governments have proposed or enacted legislation to require ethanol and biodiesel content in gasoline and diesel fuel. Proposed regulations are detailed in the following table.
Table 2: Proposed or Enacted Legislation for Alternative Fuels
| Jurisdiction | Regulation details |
|---|---|
| Canada |
|
| Quebec |
|
| Ontario |
|
| Manitoba |
|
| Saskatchewan |
|
| Alberta |
|
| British Columbia |
|
[53] Notice of intent to develop a federal regulation requiring renewable fuels. Canada Gazette Part I, 30 December 2006. Available at gazette.gc.ca/archives/p1/2006/2006-12-30/html/notice-avis-eng.html#i3
[54] Using Energy to Build the Quebec of Tomorrow - Energy Strategy 2006-2015.
[55] Ontario Regulation 535/05 Ethanol in Gasoline. Ministry of the Environment.
[56] The mandate will start on January 1, 2008 with 5% ethanol content for the first quarter of 2008, ramping up to 8.5% for the remainder of 2008 and subsequent years.
[57] Energy Development Initiative - Biofuels Office. Manitoba Science, Technology, Energy and Mines.
[58] Ethanol Basics. Saskatchewan Ministry of Enterprise and Innovation.
[59] Provincial Energy Strategy.
[60] The B.C. Energy Plan: A Vision for Clean Energy Leadership. British Columbia, 2008. Available at www.energyplan.gov.bc.ca/
There are also various other government programs and polices that have been proposed or enacted that could influence on-road passenger transportation energy consumption in Canada. These programs can include:
- Urban planning and design (e.g., dedicated high occupancy vehicle lanes, timing street lights, improved public transit)
- Taxes and subsidies (e.g., emission price, "feebate" programs wherein a fee is charged on the most inefficient vehicles sold and a rebate is provided for the most efficient vehicles sold, vehicle scrappage programs)
- Regulations and standards (e.g., vehicle fuel efficiency requirements, emission standards, renewable fuel standards)
- Information and voluntary programs (e.g., labeling programs for vehicles, improved vehicle maintenance programs, social marketing, telecommuting and teleconferencing for work)
- Research, development and demonstration (e.g., improvements in internal combustion engine, development of advanced vehicle technologies).
As well, improvements in air and rail passenger transportation are also expected. In June 2005, ATAC and Transport Canada signed a voluntary MOU to improve fuel efficiency measured as litres of fuel per revenue tonne kilometre[61], and thus reduce GHG emissions on a per unit basis by an average of 1.1 per cent to the year 2012[62]. Similarly, an MOU between the Government of Canada and the Railway Association of Canada concerning the emissions of GHG and criteria air contaminants from locomotives operating in Canada was signed on 15 May 2007[63]. The action plan for reducing GHG emissions could include actions that will improve fuel efficiency, such as technology upgrades[64] and operational improvements (e.g., improved scheduling; adopt distributive power wherein locomotives are placed at different locations throughout a train, as opposed to placing all the locomotives at the front of the train improving fuel economy)[65].
[61] Revenue tonne kilometre is a measure of activity and refers to the passenger load measured in tonnes multiplied by the kilometres flown. Therefore, fuel per revenue tonne kilometre is an energy intensity measure.
[62] Canadian Aviation and Greenhouse Gases: Literature Review. Jacobs Consultancy Canada Inc., 2007.
[63] Locomotive Emissions Monitoring Program 2006. Transport Canada, 2008.
[64] Planned upgrades are discussed in the rail section above.
[65] Locomotive Emissions Monitoring Program 2006. Transport Canada, 2008.
Observations
In 2006, passenger transportation demand accounted for about 16 per cent of total end-use demand in the country. As a result, future changes in personal transportation have the potential to significantly impact the way Canadians consume energy.
Despite improvements in vehicle technology and energy efficiency standards, personal transportation energy demand has been growing over the last two decades. This was influenced by economic factors, such as relatively low oil prices throughout the 1990s, growing Canadian population, and increasing disposable income. It was also influenced by changing consumer preferences toward larger vehicles and engines and increased urbanization.
The average retail price of gasoline in central Canada increased by over 45 per cent between 2002 and 2007. In Canada, over the same time period, gasoline sales increased by 7.4 per cent and total passenger kilometres grew by 3.5 per cent. This demonstrated that consumers are relatively price inelastic when it comes to transportation energy demand, at least within a certain price range. Many factors affecting energy demand are difficult to change in a short period of time. For instance, the current stock of vehicles, urban design of Canadian cities and transportation infrastructure are fixed in the near-term.
Evidence of a consumer response to higher energy prices finally became apparent in Canada as transportation fuel prices soared to record highs in the summer of 2008. As a result, energy demand declined slightly from 2007 levels, vehicle kilometres traveled decreased and the proportion of new light truck sales was reduced.
More recently, crude oil and petroleum product prices have rapidly declined as a result of global financial problems and reductions in global petroleum demand. It is unlikely that Canadian personal transportation energy demand will rebound in the face of these decreased prices, at least in the near-term. Fears about a global economic slowdown have changed expectations regarding Canadian economic growth. The looming recession and economic uncertainty are expected to put downward pressure on Canadian personal transportation energy demand. Transportation energy demand has proven to be much more responsive to changes in income than changes in prices. Historically, a lowering of real incomes has led to reduced energy demand.
The long-term future of personal transportation energy demand is uncertain. This is due to uncertainty surrounding future crude oil and petroleum product prices, how the global financial situation will be resolved, how quickly new vehicle technologies can be introduced into the market, and how changing consumer attitudes will result in changes to behaviour. The National Energy Board will continue to monitor these important trends.
- Date modified: