ARCHIVED – Short-term Canadian Natural Gas Deliverability 2015-2017 - Energy Market Assessment
This page has been archived on the Web
Information identified as archived is provided for reference, research or recordkeeping purposes. It is not subject to the Government of Canada Web Standards and has not been altered or updated since it was archived. Please contact us to request a format other than those available.
Short-term Canadian Natural Gas Deliverability 2015-2017 - Energy Market Assessment [PDF 869 KB]
and Appendices [PDF 2070 KB]
June 2015
Copyright/Permission to Reproduce
ISSN 1910-7773
Table of Contents
List of Figures and Tables
Figures
Tables
List of Acronyms
| CBM | coalbed methane |
| EIA | Energy Information Administration |
| FID | Final Investment Decision |
| HH | Henry Hub (U.S. Natural Gas Reference Price) |
| LNG | liquefied natural gas |
| NEB | National Energy Board |
| NGLs | natural gas liquids |
| WCSB | Western Canada Sedimentary Basin |
List of Units and Conversion Factors
| Units | |
|---|---|
| m3 | = cubic metres |
| MMcf | = million cubic feet |
| Bcf | = billion cubic feet |
| m3/d | = cubic metres per day |
| 106m3/d | = million cubic metres per day |
| MMcf/d | = million cubic feet per day |
| Bcf/d | = billion cubic feet per day |
| GJ | = gigajoule |
| MMBtu | = million British Thermal Units |
Common Natural Gas Conversion Factors
1 million m3 (@ 101.325 kPaa and 15°C) = 35.3 MMcf (@ 14.73 psia and 60°F)
1 GJ (Gigajoule) = .95 Mcf (thousand cubic feet) = .95 MMBtu = .95 decatherms
Price Notation
North American natural gas prices are quoted at Henry Hub and given in $US/MMBtu.
Canadian natural gas prices are quoted as the Alberta Gas Reference Price and are listed in $C/GJ.
Foreword
The National Energy Board (NEB, or the Board) is an independent, federal, quasi-judicial regulator established to promote safety and security, environmental protection and economic efficiency within the mandate set by Parliament for the regulation of pipelines, energy development and trade. The Board's main responsibilities include regulating the construction, operation and abandonment of pipelines that cross international borders or provincial/territorial boundaries, as well as the associated pipeline tolls and tariffs, the construction and operation of international power lines, and designated interprovincial power lines and imports of natural gas and exports of crude oil, natural gas liquids (NGLs), natural gas, refined petroleum products and electricity.
For oil and natural gas exports, the Board’s role is to evaluate whether the oil and natural gas proposed to be exported is surplus to reasonably foreseeable Canadian requirements, having regard to the trends in the discovery of oil or gas in Canada. If a party wishes to rely on material from this report in any regulatory proceeding before the Board, it may submit the material, just as it may submit any public document. Under these circumstances, the submitting party in effect adopts the material and could be required to answer questions pertaining to its content. This report does not provide an indication about whether any application will be approved or not. The Board will decide on specific applications based on the material in evidence before it at that time.
While preparing this report, in addition to conducting its own quantitative analysis, the NEB held a series of informal meetings and discussions with various industry and government stakeholders. The NEB appreciates the information and comments provided and would like to thank all participants for their time and expertise.
Chapter 1: Overview and Summary
This report provides an outlook of Canadian natural gas deliverabilityFootnote 1 from the beginning of 2015 to the end of 2017. The outlook presents three distinct cases, a Higher Range Price Case, Mid-Range Price Case, and a Lower Range Price Case, each of which are based on a range of assumptions. In all three cases, the 2015 North American natural gas market will continue to be oversupplied, as deliverability outpaces demand growth.
The colder than average winter of 2013-2014 depleted volumes of natural gas in storage, causing gas prices to increase and remain elevated until mid-way through 2014, when it became clear that deliverability was sufficient to avoid significant storage shortages. Despite the declining prices in the second half of 2014, Canadian and U.S. natural gas deliverability continued to increase to refill the remaining storage deficit. This momentum appears unlikely to continue, as several factors impede sustained Canadian natural gas deliverability growth through 2017. Lower prices, ample supply, and increased competition in key markets will challenge the competitiveness of Canadian natural gas and gas exports.
The decline in oil prices since mid-2014 has impacted the North American natural gas market in the form of reduced revenues, constrained cash flows, and significantly less gas-targeted drilling. Decreased capital expenditures are expected to reduce total deliverability, but high-gradingFootnote 2 by producers in both Canada and the U.S. may improve per-well deliverability. Additional drilling could occur in Western Canada as some producers may attempt to establish natural gas reserves and assess deliverability potential to confirm supplies for future liquefied natural gas (LNG) export projects. A final investment decision (FID) to proceed with a Canadian LNG export project in 2015-2016 could accelerate this activity and result in increased Canadian deliverability over the projection period.
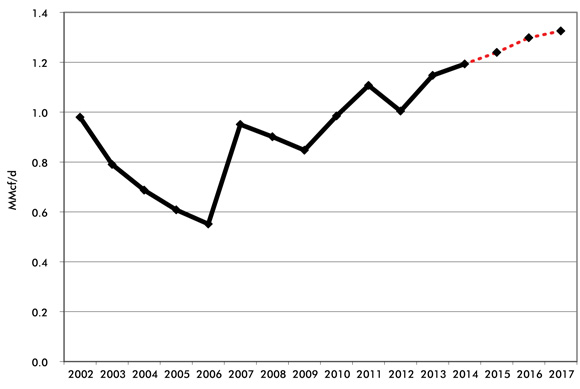
In a Mid-Range Price Case, prices would fall from $4.35/MMBtuFootnote 3 in 2014 to $3.55/MMBtu in 2017, while Canadian natural gas deliverability remains relatively flat from 416 106m3/d (14.7 Bcf/d) in 2014 to 417 106m3/d (14.7 Bcf/d) in 2017. A Higher Price Case would see natural gas prices at $3.70/MMBtu by 2017, resulting in more natural gas drilling and Canadian deliverability increasing to 441 106m3/d (15.6 Bcf/d) in 2017. In a Lower Price Case, growth in markets for Canadian natural gas would decrease, potentially due to mild weather conditions, weak investment, and reduced competitiveness relative to the U.S. The Lower Price Case would see prices remaining at or below $3.10/MMBtu and deliverability declining to 394 106m3/d (13.9 Bcf/d) by 2017. A comparison of the prices in each case can be found in Figure 1.1.
Figure 1.1 Historical and Projected Henry Hub Natural Gas Spot Price

Download Data for Figure 1.1 [SLK 4 KB]
The Analysis and Outlook section of this report contain key assumptions for each price case. The Appendices contain a detailed description of the input assumptions used in projecting deliverability.
Chapter 2: Background
The North American Natural Gas Market
Higher natural gas demand during the colder than average winter of 2013-2014 decreased volumes of natural gas in storage. Decreased gas storage and mounting uncertainty regarding the adequacy of storage to meet demand the following winter caused prices to increase over the first half of 2014. Both Canadian and U.S. deliverability increased in 2014 and prices remained elevated until it became clear that deliverability was sufficient to meet demand and avoid any significant storage shortages. Production in the U.S. continues to satisfy an increasing portion of U.S. domestic demand that was previously met by Canadian producers.
Canada
- Canada produced an average of 416 106m3/d (14.7 Bcf/d) of marketableFootnote 4 natural gas in 2014, up 4.8 per cent from 2013 but still below the 482 106m3/d (17 Bcf/d) peak in 2005.
- Western Canada is the primary natural gas producing region, contributing 98 per cent of total Canadian natural gas production in 2014. The remainder of Canadian natural gas production is supplied by Nova Scotia, Ontario, the Northwest Territories, New Brunswick and Yukon.
United States
- Natural gas production has increased steadily in the U.S.Footnote 5 since 2005. Marketable natural gas production in the U.S. averaged 2116 106m3/d (74.7 Bcf/d)Footnote 6 in 2014, representing an increase of six per cent on a year-over-year basis.
- Natural gas produced in the U.S. is derived from tight formations, shale formations, and as a byproduct from oil production. It is serving an increasing share of U.S. demand, which in turn reduces the need for Canadian natural gas imports.
Mexico
- Mexican natural gas production decreased slightly from 2006 to 2013 to about 127 106m3/d (4.5 Bcf/d)Footnote 7. Increasing demand for natural gas and improved integration of Mexican markets with U.S. pipeline infrastructure has resulted in increased Mexican natural gas imports from the southern U.S.
Current Trends in Supply and Demand
The North American natural gas market continues to be oversupplied. By April 2015, the remaining storage deficit from the winter of 2013-2014 was replenished and inventories returned to levels near the five-year average. As a consequence, gas storage can be expected to fill more rapidly during future injection seasons and deliverability is expected to outpace demand from 2015 to 2017. If storage reaches capacity and deliverability exceeds demand, there is a risk of production being shut in to reduce supply to balance markets.
- Cyclical imbalances of supply and demand are typical of the North American natural gas market. Demand often varies because of weather, changes to economic growth, and infrastructure constraints. Imbalances caused by these factors result in overshooting demand or undershooting supply.
- A typical cycle occurs as follows: during periods of increased demand, prices increase to ration supply and direct it toward the markets that value it most. Higher prices also provide incentives to develop and produce the next most costly natural gas resources which can cause deliverability to exceed demand, subsequently depressing prices. Lower prices discourage production of high cost supply sources but at the same time also foster demand. As demand grows, prices begin to rise again and the cycle repeats itself.
- Lower oil prices, and therefore revenues, have led to decreased capital expenditures, which has reduced drilling and service activity as companies work within available cash flows.
- When producers are cash-strapped however, development is focused on the most economical prospects while producers and service companies attempt to reduce costs. The possible outcome of these measures is not only lower costs, but improved operational efficiencies and higher levels of production per well.
- Modern drilling technologies, such as multi-stage hydraulic fracturing and multi-well pad drilling, are now used extensively, improving the economics of the Canadian and U.S. natural gas resource base and boosting deliverability.
- Boosting the recoverable resource base and production in North America has caused a surge in proposals for LNG export facilities in North America to reach overseas markets.
- It may take years for new major markets to develop for natural gas. The opportunity for natural gas to displace competing fuels in traditional space-heating markets in Canada and the U.S. has largely occurred already.
- Proposed LNG export facilities represent large new natural gas demands but involve long lead times to obtain approvals, establish overseas markets, and construct facilities. Currently, none of the proposed Canadian LNG projects with approved export licenses have announced a FID. In the U.S., construction has begun on several LNG facilities and the first facility is scheduled to come online in 2016Footnote 8.
- Other potential sources of major demand growth could require years or decades to develop to a meaningful scale. Examples include the domestic petrochemical industry taking an increased share of capacity from overseas locations and the widespread use of compressed natural gas or LNG to displace diesel and gasoline in transportation markets.
- Currently there is a growing inventory of wells being drilled but not completed in the U.S. By drilling wells and not completing them, producers avoid placing resources onto the market at lower prices, while still taking advantage of the lower drilling and service costs brought on by reduced activity. These wells have the potential to be completed later when prices start to rise, which would rapidly increase supply available in the market and supress movement toward higher prices.
Future Uncertainties
Trends in future Canadian and U.S. deliverability are likely to follow a pattern similar to previous cycles, but several factors make it difficult to anticipate the duration and extent of the current cycle.
- Lower prices for both crude oil and natural gas have impacted the credit ratings of small and mid-sized producers, making it more difficult to obtain debt financing. The lack of easy access to capital could make it difficult for some small and mid-sized producers to sustain their operations, creating the potential for bankruptcies or acquisitions of smaller producers by larger more financially stable companies.
- In lieu of debt financing, private equityFootnote 9 dollars have begun to flow to producers and service companies in the U.S. and Canada. Private equity investment may provide the capital needed for smaller and mid-sized producers to continue operations. Currently, private equity investment activity appears a more prominent feature in the U.S. than Canada which may result in greater increases in U.S. deliverability.
- Previously, the attractive price spread between natural gas and natural gas liquids (NGLsFootnote 10) promoted NGL-targeted drilling and the natural gas price was of lesser consequence. Rising NGL deliverability is creating a supply glut in Canada and the U.S. and the oversaturated market for key NGLs (ethane, propane, butane) is leading to lower NGL prices and reduced producer revenues. Additional revenues from NGLs have helped support natural gas deliverability, but this uplift to gas deliverability is expected to diminish as the NGL supply overhang grows and NGL prices decline.
- Heavier NGLs such as condensate have higher values in Western Canada because they can be used to dilute bitumen for pipeline transport. Therefore it is possible that select wet gas plays rich in condensate could see sustained drilling activity in Western Canada.
- Lower cost Marcellus gas is closer to markets in central Canada, the U.S. Northeast and U.S. Midwest, giving it cost advantages over Western Canadian gas. Growing production of Marcellus Shale gas will gain additional pipeline access to the U.S. Midwest beginning in 2015. An increasing amount of Marcellus gas is also expected to flow into central Canada displacing some demand that was previously satisfied by Western Canadian production. Marcellus Shale gas has significantly displaced Canadian exports from the U.S. Northeast market.
- Additional drilling could occur in Western Canada as producers confirm adequate deliverability for future LNG exports by assessing reserve and production potential. This activity was a significant contributor to the rise in 2014 Canadian gas deliverability. A FID to proceed with a Canadian LNG export project in 2015-2016 could accelerate this activity within the time period assessed in this report.
- The Deep Panuke project offshore of Nova Scotia was expected to help offset declining output from the Sable Offshore Energy Project. Currently, production from Deep Panuke is shut in due to issues with high levels of water being produced alongside gas production. Although Deep Panuke is expected to return to production by October 2015, incursion of water into the reservoir could adversely impact the amount of natural gas recoverable over the lifetime of the project.
- The lower price of natural gas alongside environmental policy initiatives is encouraging the switching from coal to gas for power generation in the U.S. Coal-to-gas switching for power generation would create additional demand for natural gas. The majority of coal plant retirements to date have been aging units that were not heavily utilized. Displacement of modern efficient coal plants equipped with emissions controls would require lower gas prices in order to be competitive with coal. The timing of further displacement of coal to gas in power generation will depend on costs to bring plants in compliance with environmental regulations, demand for power generation and relative prices of gas and coal.
Chapter 3: Analysis and Outlook
Natural gas drilling activity in Canada increased year-over-year in 2014 (Table 3.1) due to higher gas prices, but drilling is expected to decline significantly throughout 2015. Increased deliverability from the U.S. has reduced gas prices and made some Western Canadian natural gas prospects uneconomic to pursue.
Three price cases for Canadian natural gas deliverability are examined in this report. These cases differ primarily in terms of Canadian and U.S. natural gas prices and the corresponding levels of capital investment. The Appendices contain a detailed description of the assumptions used for projecting deliverability.
In all three price cases, drilling and investment in Canadian natural gas is projected to decrease significantly relative to 2014. Canadian deliverability from outside of Western Canada also declines in each of the three price cases. Moreover, all three price cases have incorporated a switch to seasonal production by the offshore Nova Scotia Deep Panuke project. The cases begin to differ in 2016 and 2017 based on assumptions of the degree of widening (Lower Price Case) or tightening (Mid-Range and Higher Price Cases) between the balance of supply and demand in Canada and the U.S.
A summary of the key assumptions used in the cases and the deliverability results are shown in Table 3.1.
Table 3.1 - Pricing Overview and Deliverability Results
| Mid-Range Price Case | Higher Price Case | Lower Price Case | ||||||||
|---|---|---|---|---|---|---|---|---|---|---|
| 2014 | 2015 | 2016 | 2014 | 2015 | 2016 | 2014 | 2015 | 2016 | 2017 | |
| Henry Hub (HH) Average Spot Price (US$/MMBtu) |
$4.35[a] | $2.90 | $3.20 | $3.55 | $3.05 | $3.30 | $3.70 | $2.70 | $3.00 | $3.10 |
| Alberta Gas Reference Price (C$/GJ) |
$4.25[b] | $2.85 | $3.15 | $3.35 | $3.00 | $3.25 | $3.50 | $2.65 | $2.95 | $3.05 |
| Natural Gas Drilling Expense ($ Millions) |
5 000 | 1 749 | 2 879 | 3 416 | 2 408 | 3 268 | 3 751 | 1 478 | 2 336 | 2 574 |
| Natural Gas Intent Drill Days |
39 923 | 15 518 | 26 858 | 31 239 | 21 364 | 30 485 | 34 302 | 13 111 | 21 788 | 23 538 |
| Natural Gas Intent Wells |
1 891 | 736 | 1 275 | 1 485 | 1 013 | 1 447 | 1 631 | 622 | 1 034 | 1 119 |
| Gas Share of Drill Days (per cent) |
20% | 16% | 22% | 24% | 21% | 25% | 27% | 13% | 18% | 18% |
| Canadian Deliverability (106m3/d) |
416[c] | 419 | 409 | 417 | 428 | 429 | 441 | 415 | 397 | 394 |
| Canadian Deliverability (Bcf/d) |
14.7 | 14.8 | 14.4 | 14.7 | 15.1 | 15.1 | 15.6 | 14.6 | 14.0 | 13.9 |
[a] GLJ Publications - average of daily market prices (rounded to the nearest $0.05)
[b] GLJ Publications - average of daily market prices (rounded to the nearest $0.05)
[c] Annual average of NEB reported provincial production, where available.
For this analysis, the Board divides natural gas production in Western Canada into conventional, coalbed methane (CBM), and shale gas, with tight gas included as a sub-category of conventional production. Due to large regional differences in geological and production characteristics the Board further subdivides these categories into smaller geographic areas, or regions, which have similar characteristics for production decline analysis. Within each region, grouping of the producing formations takes place on a geological basis. Details on the characterization of the resources are available in Appendix B. Canadian natural gas production outside of Western Canada includes:
- Onshore production from New Brunswick, Ontario, Yukon, and Northwest Territories which is declining as minimal future drilling activity is expected over the projection period.
- Nova Scotia production from the offshore Sable Island project is declining and the Deep Panuke project is temporarily shut in, but is expected to begin producing again in October 2015.
- Shale gas potential in Quebec, New Brunswick, and Nova Scotia; however, local policies currently prohibit the hydraulic fracturing required for shale gas development in these provinces. It is assumed these policies do not change over the forecast period.
Deliverability Outlooks
The three price cases cover a range, however in all three cases the North American natural gas market is expected to remain amply supplied.
- In the Mid-Range Price Case, the market remains oversupplied with deliverability relatively flat in 2015 and declining in 2016. By 2017, increasing demand pushes the market further towards a balanced position creating higher prices and providing an incentive for a slight increase in Western Canadian production.
- In the Higher Price Case, increased demand tightens the market earlier and higher prices encourage enough drilling that deliverability rises throughout the forecast. The Higher Price Case also sees increased drilling activity to confirm deliverability for a proposed LNG project on Canada’s West Coast.
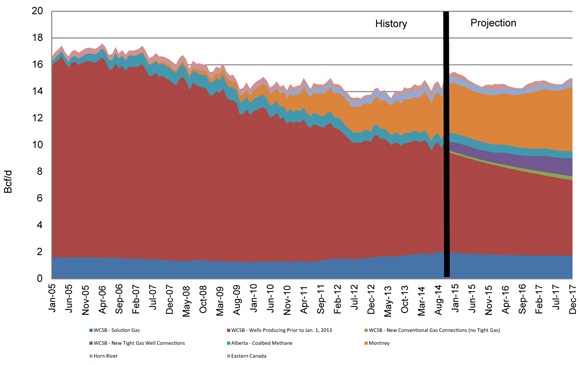
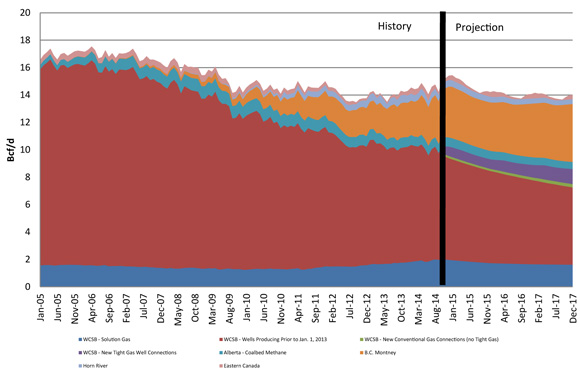
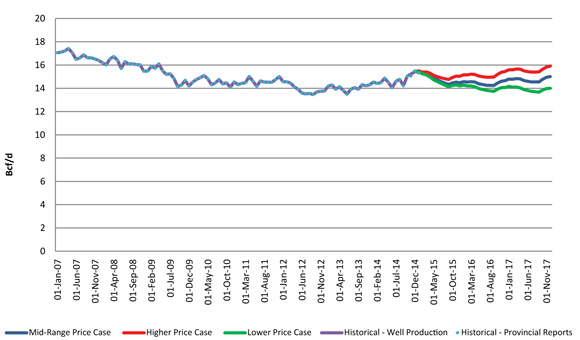
- In the Lower Price Case, Western Canadian natural gas faces greater competition from U.S. sources with more Canadian gas squeezed out of the Eastern U.S. and central Canadian markets. Lower prices and a reduced market opportunity decrease Canadian deliverability. A comparison of the three Canadian natural gas deliverability outlooks to 2017 is shown in Figure 3.1.
Figure 3.1 Historical and Projected Natural Gas Deliverability
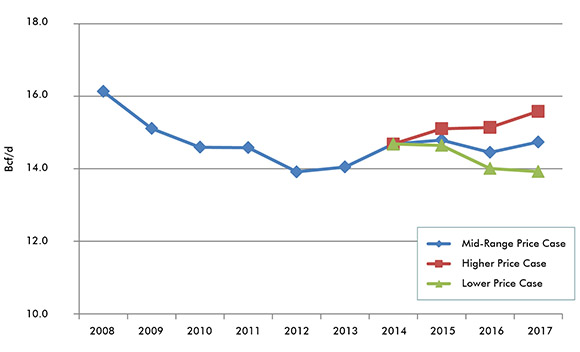
Download Data for Figure 3.1 [SLK 4 KB]
The levels of drilling activity that provides these deliverability outcomes are the result of capital investment assumptions and estimated drilling costs. Comparisons of natural gas drilling activity in the three cases in terms of drill days and gas-intent wells drilled are shown in Figure 3.2 and Figure 3.3, respectively.
Figure Figure 3.2 Natural Gas-Intent Drilling Days

Download Data for Figure 3.2 [SLK 3 KB]
Figure 3.3 Natural Gas-Intent Wells
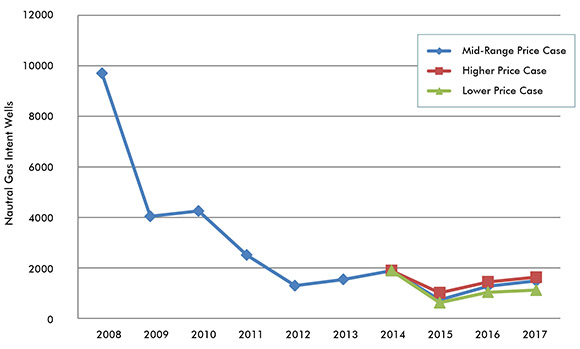
Download Data for Figure 3.3 [SLK 3 KB]
Mid-Range Price Case
The Mid-Range Price Case would see mild growth in Canadian and U.S. natural gas demand. The North American market would remain oversupplied in 2015 both in terms of NGLs and marketable natural gas, resulting in slimmer margins for producers, and lower revenues for drilling operations. Difficulties obtaining debt financing for Canadian producers would ease somewhat, however private equity investment would remain more prominent in the U.S. relative to Canada. The outlook for Canadian LNG would remain ambiguous with no FID’s made before 2016. By 2016 drilling activity begins to increase as market conditions begin to improve.
Deliverability Results
In the Mid-Range Price Case, Canadian natural gas deliverability will continue to be well above Canadian demandFootnote 11. Western Canada deliverability falls in 2016 before increasing in 2017 as gas-directed activity increases with a continued focus on higher productivity wells. Tight gas activity grows over the projection with 901 tight gas wells drilled in Western Canada in 2017 including 544 in the Montney tight gas play. The Duvernay Shale play continues to see most Canadian shale gas activity with 40 wells drilled in 2017, compared to five wells in the Horn River Basin; activity in this dry-gas resource could increase if additional markets emerge in Canada and the U.S., or if activity increases in preparation for LNG exports. A summary of the Mid-Range Price Case is available in Table 3.2.
Table 3.2 - Mid-Range Price Case Summary and Results
| Alberta Gas Reference Price |
Gas Intent Drill Days | Gas Intent Wells | Average Deliverability | ||
|---|---|---|---|---|---|
| C$/GJ | 106m3/d | Bcf/d | |||
| 2014 | $4.25[a] | 39 923 | 1 891 | 416[b] | 14.7 |
| 2015 | $2.85 | 15 518 | 736 | 419 | 14.8 |
| 2016 | $3.15 | 26 858 | 1 275 | 409 | 14.4 |
| 2017 | $3.35 | 31 239 | 1 485 | 417 | 14.7 |
[a] GLJ Publications - average of daily market prices (rounded to the nearest $0.05)
[b] Annual average of NEB reported provincial production, where available.
Implications
Canadian and U.S. gas markets have been well supplied at historically moderate prices for the past few years. Markets could tighten somewhat due to drilling reductions, rising natural gas demand from improved integration of the Mexican market, and growing LNG operations in the U.S.
Higher Price Case
The Higher Price Case includes a larger recovery for Canadian natural gas deliverability due to higher gas demand and less displacement of Canadian gas by U.S. supplies. Despite rising natural gas prices, power generators prefer natural gas over coal in specific markets, potentially to meet stricter environmental regulations or to better match variations in the electricity demand profile. Canadian producers are able to obtain capital more easily while continuing to focus drilling efforts on highly productive prospects. Moreover, a FID is assumed to be announced in 2016 for a LNG project on the West Coast of Canada, which adds additional drilling to prove reserves. Finally, harsher weather conditions could provide additional demand. This results in a closer balance between deliverability and demand before the end of the projection period.
Deliverability Results
Canadian natural gas deliverability grows continuously over the projection under the higher price case increasing from 416 106m3/d (14.7 Bcf/d) in 2014 to 441 106m3/d (15.6 Bcf/d) by 2017. Tight gas production is still the primary source of new production growing from 249 106m3/d (7.1 Bcf/d) in 2014 to 315 106m3/d (8.9 Bcf/d) in 2017. A summary of the Higher Price Case is available in Table 3.3.
Table 3.3 - Higher Price Case Summary and Results
| Alberta Gas Reference Price |
Gas Intent Drill Days | Gas Intent Wells | Average Deliverability | ||
|---|---|---|---|---|---|
| C$/GJ | 106m3/d | Bcf/d | |||
| 2014 | $4.25[a] | 39 923 | 1 891 | 416[b] | 14.7 |
| 2015 | $3.00 | 21 364 | 1 013 | 428 | 15.1 |
| 2016 | $3.25 | 30 485 | 1 447 | 429 | 15.1 |
| 2017 | $3.50 | 34 302 | 1 631 | 441 | 15.6 |
[a] GLJ Publications - average of daily market prices (rounded to the nearest $0.05)
[b] Annual average of NEB reported provincial production, where available.
Implications
Higher prices, increased demand, and improved competitiveness of Canadian gas relative to the U.S. keep deliverability increasing over the projection. The supply overhang experienced in the North American market over the past few years will continue, but conditions will begin to tighten as additional sources of demand become available and drilling takes place to meet it.
In the Lower Price Case, demand for Canadian natural gas is assumed to decrease due to mild weather, modest economic growth, and ongoing displacement by growing supplies of U.S. natural gas. Canadian producers would have difficulty obtaining debt financing while private equity investment would occur almost exclusively in the U.S. Canadian natural gas deliverability would continue to be more than adequate to meet domestic demand. The Lower Price case would also assume that a FID for Canadian LNG projects are delayed and resulting activities to confirm reserves and deliverability for LNG exports are scaled back.
Deliverability Results
Canadian natural gas deliverability decreases slightly in 2015 to 415 106m3/d (14.6 Bcf/d) before falling significantly in 2016 to 397 106m3/d (14.0 Bcf/d) and further in 2017 to 394 106m3/d (13.9 Bcf/d). Lower natural gas prices reduce investment in the sector. A summary of the Lower Price Case is available in Table 3.4
Table 3.4 - Lower Price Case Summary and Results
| Alberta Gas Reference Price |
Gas Intent Drill Days | Gas Intent Wells | Average Deliverability | ||
|---|---|---|---|---|---|
| C$/GJ | 106m3/d | Bcf/d | |||
| 2014 | $4.25[a] | 39 923 | 1 891 | 416[b] | 14.7 |
| 2015 | $2.65 | 13 111 | 622 | 415 | 14.6 |
| 2016 | $2.95 | 21 788 | 1 034 | 397 | 14.0 |
| 2017 | $3.05 | 23 538 | 1 119 | 394 | 13.9 |
[a] GLJ Publications - average of daily market prices (rounded to the nearest $0.05)
[b] Annual average of NEB reported provincial production, where available.
Implications
Canadian natural gas consumers would benefit from lower natural gas prices in the short term. This case shows the greatest decline in natural gas deliverability which would result in a significant reduction in drilling and other gas-related service activities. Even in the lower oil price environment, oil-related activity might be able to partially compensate for reduced natural gas operations to help support ongoing Canadian drilling and service activity.
Chapter 4: Key Differences from Previous Projection
The key difference from the previous deliverability projection Short-term Canadian Natural Gas Deliverability Outlook 2014-2016Footnote 12 is that the storage deficit following the unusually cold winter of 2013-2014 encouraged significantly higher deliverability than was projected. The higher deliverability was due to additional drilling undertaken to refill storage, higher well productivity than expected and additional production from activity to prove reserves for potential LNG export. With adequate storage and mild demand growth, the supply overhang in the North American natural gas market has intensified.
The biggest development in the market since the 2014 projection was the major decline in oil prices. The lower price environment has producers facing tighter capital constraints and has also made obtaining debt financing more difficult. Reduced revenues from a glut of NGLs in the market and lower NGL prices are expected to reduce the amount of drilling for liquids-rich natural gas. These combined factors have decreased drilling and service activities but have also lowered service costs and improved capital efficiency on a per-well basis.
The Alberta Reference Price in 2014 was $4.27/GJ, well above the $3.43/GJ projected in the Mid-range Price Case and even above the $4.05/GJ projected in the Higher Price Case. As a result, actual production averaged 416 106m3/d (14.7 Bcf/d) of marketable natural gas in 2014, nearer to the Board’s Higher Price Case projection of 414 106m3/d (14.6 Bcf/d). Actual production, higher than what was projected, can be attributed to prices and well productivity being higher than expected, along with additional production from activity directed at confirming reserves for potential LNG export.
Chapter 5: Recent Issues and Current Trends
Developments that will influence future Canadian natural gas deliverability include:
- The development of a Canadian LNG market remains an uncertainty in the years ahead. A FID could increase Canadian natural gas deliverability, though the construction of facilities would only occur beyond the projection period. It is likely that a significant portion of natural gas destined to be exported as LNG will be produced from supplies developed in direct response to the project. Prior to export, these sources of gas would need to be proven and their production would likely be sold into the North American market.
- The developing glut of NGLs and the subsequent decrease in NGL prices, along with lower oil prices, may reduce NGL and oil-targeted drilling which results in natural gas being produced as a byproduct. It is possible that reduced production would help balance markets.
- Acquisition and consolidation of smaller North American producers by major companies could result in more coordinated production efforts. Moreover, the economies of scale achieved by integrating into supply chains of major companies could significantly reduce costs.
- The rate at which Canadian natural gas is squeezed from markets in central Canada and the U.S. has major implications for future Canadian deliverability. The timing and utilization of additional pipeline capacity from the Marcellus and Utica to the U.S. Midwest will be a key factor affecting markets that have made extensive use of Canadian natural gas.
- NGL-rich gas from the Montney is some of the lowest cost gas in North America and can be competitive with Marcellus gas in certain markets depending on relative transportation costs and foreign exchange rates. There is potential for increased future deliverability from the Montney despite lower gas prices.
- Technological advancements, efficiency gains and improved data analytics in drilling and hydraulic fracturing operations have improved the economics of North American natural gas production. Inputs including labour and materials have seen cost rollbacks in response to lower activity levels. Depending on the economics of the individual producer, improvements in these economic factors may contribute to increased deliverability.
- Development of Canadian oil sands projects in 2016-2017 will impact the demand for Canadian natural gas. Natural gas is used as a major fuel source to provide energy for oil sands operations. Oil sands projects under construction and scheduled to begin production between 2015 and 2018 are generally considered sufficiently advanced to be completed despite lower oil prices. Projects in early stages of planning or development may be postponed until global oil markets become more supportive.
- The 2015 natural gas storage refill is ahead of schedule in producing areas, but remains depleted in central Canadian and north-central U.S. regions. The pace of storage refill over the summer and fall will be a telling indicator of the extent to which natural gas production is exceeding demand. Should the storage refill get too far ahead of schedule, natural gas prices may decline. This could increase coal-to-gas switching in power generation markets to help absorb the gas surplus. Conversely, a warmer than average summer may draw more natural gas into power generation to run air conditioners and slow the pace of storage injections, subsequently increasing natural gas prices and encouraging the growth of natural gas deliverability.
Appendices Figures and Data
For complete Appendices please download PDF version: Appendices [PDF 3146 KB]
Appendix A
A1 Methodology (Detailed Description)
Figure A1.1 WCSB Major Gas Supply Categories for Deliverability Assessment
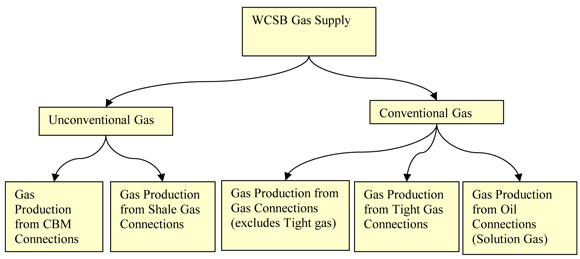
Figure A1.2 WCSB Area Map
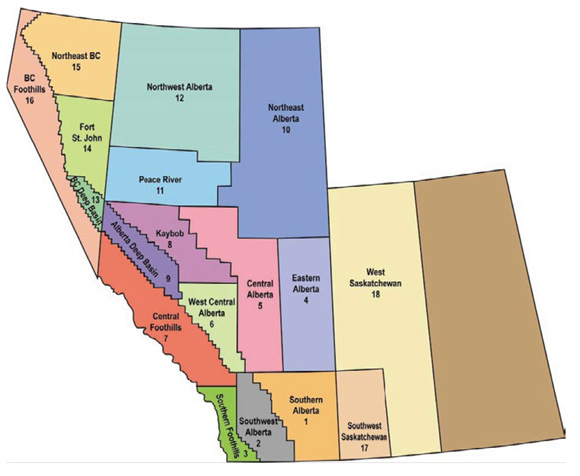
Figure A1.3 Example of Average Connection Production Decline Analysis Plot
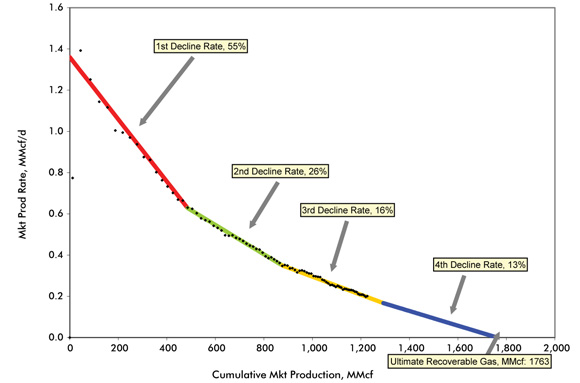
Source: NEB analysis of Divestco Geovista well production data
Download Data for Figure A1.3 [SLK 32 KB]
Figure A1.4 Example of Group Production Decline Analysis Plot
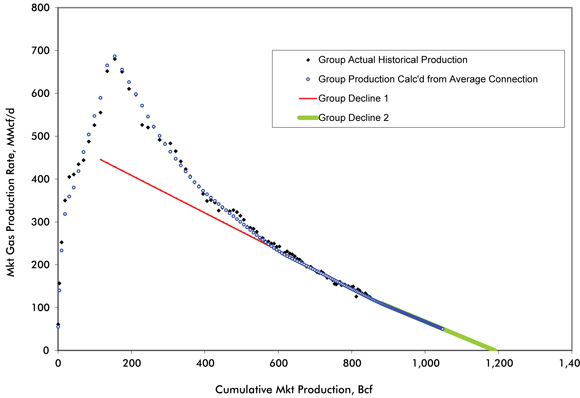
Source: NEB analysis of Divestco Geovista well production data
Download Data for Figure A1.4 [SLK 19 KB]
Figure A1.5 Example of Initial Productivity of Average Connections by Connection Year - West Central Alberta Mannville Tight Grouping

Source: NEB analysis of Divestco well production data
Download Data for Figure A1.5 [SLK 4 KB]
Figure A1.6 Example of Key Decline Parameters for Average Connections Over Time - Southwest Alberta, Tertiary, Upper Cretaceous, Upper Colorado Conventional Grouping
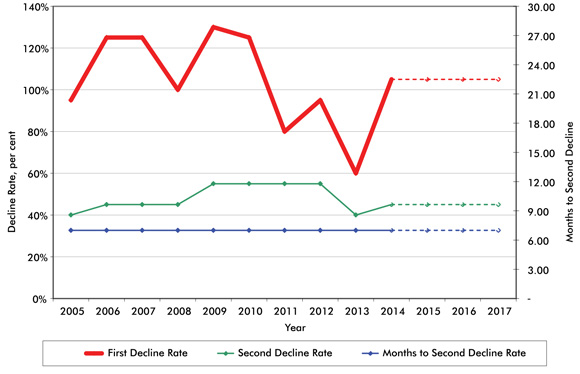
Download Data for Figure A1.6 [SLK 4 KB]
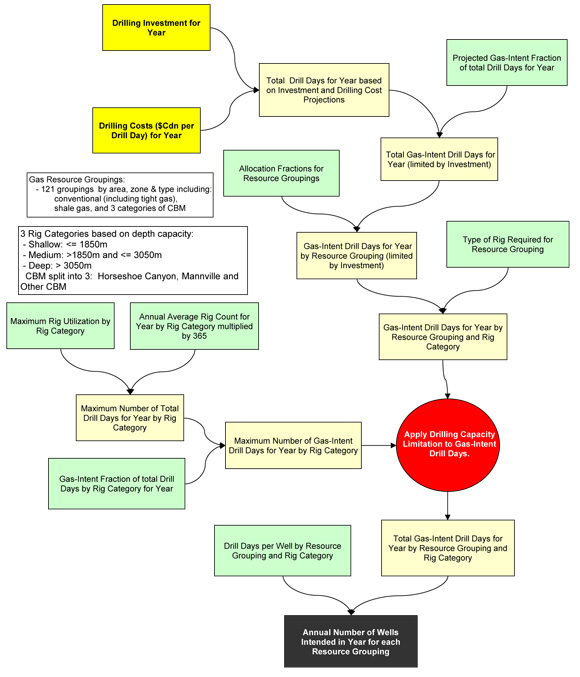
Figure A1.7 Flowchart of Drilling Projection Methodology
A2 Deliverability Parameters - Results
Figure A2.1 WCSB Initial Productivity of Average Gas Connections by Connection Year
Source: NEB Analysis of Divestco Well Production Data
Download Data for Figure A2.1 [SLK 4 KB]
Figure A2.2 WCSB Gas-Intent Well Drilling Cases

Download Data for Figure A2.2 [SLK 4 KB]
A3 Methodology (Detailed Description)
A4 Decline Parameters for Groupings of Future Gas Connections
Appendix B
B1 Factors for Allocation of Gas-Intent Drill Days to Areas
B2 Detailed Gas-Intent Drilling and Gas Connection Projections by Case
Appendix C
Deliverability Details by Case
Figure C.1 Outlook for Canadian Gas Deliverability - Mid-Range Price Case
Download Data for Figure C.1 [SLK 32 KB]
Figure C.2 Outlook for Canadian Gas Deliverability - Higher Price Case
Download Data for Figure C.2 [SLK 32 KB]
Figure C.3 Outlook for Canadian Gas Deliverability - Lower Price Case
Download Data for Figure C.3 [SLK 32 KB]
Appendix D
Total Total Canadian Deliverability Comparison by Case
Figure D.1 Total Canadian Deliverability Comparison by Case
Download Data for Figure D.1 [SLK 15 KB]
Appendix E
Average Annual Canadian Deliverability and Demand
- Date modified: