ARCHIVED – Economics of Solar Power in Canada – Results
This page has been archived on the Web
Information identified as archived is provided for reference, research or recordkeeping purposes. It is not subject to the Government of Canada Web Standards and has not been altered or updated since it was archived. Please contact us to request a format other than those available.
Electricity Generation

Electricity generation varies widely based on project location and size.
- Canada’s west coast and Newfoundland and Labrador tend to have the less potential to generate solar power in Canada. This is because these areas are cloudy and receive less sunlight. Meanwhile, the interior of the country tends to have the best potential to generate solar power, because the interior of the country is less cloudy and receives more sunlight.
- Capacity factors show the same trend. A capacity factor measures the actual, average output of a generator compared to its rated, maximum output. Because solar panels only generate electricity during the day and sit idle overnight, average outputs are low relative to their rated, maximum outputs. Therefore, their capacity factors are relatively low.
- Capacity factors tend to be 18% or below in Canada. Canada’s west coast and Newfoundland and Labrador, which are relatively cloudy, tend to have the lowest capacity factors in Canada. Conversely, capacity factors are higher in Canada’s interior, which is relatively sunny. Capacity factors can be above 20% for arrays with trackers because trackers help keep panels pointed at the sun as it moves in the sky. This increases the amount of direct sunlight a panel receives. Typical baseload generators, like hydro and nuclear, have capacity factors well above 50%.
- Importantly, generation potential ranges widely in each province and territory. This means that local generation can significantly differ from provincial averages.
Figure 2: Generation from arrays over the first year
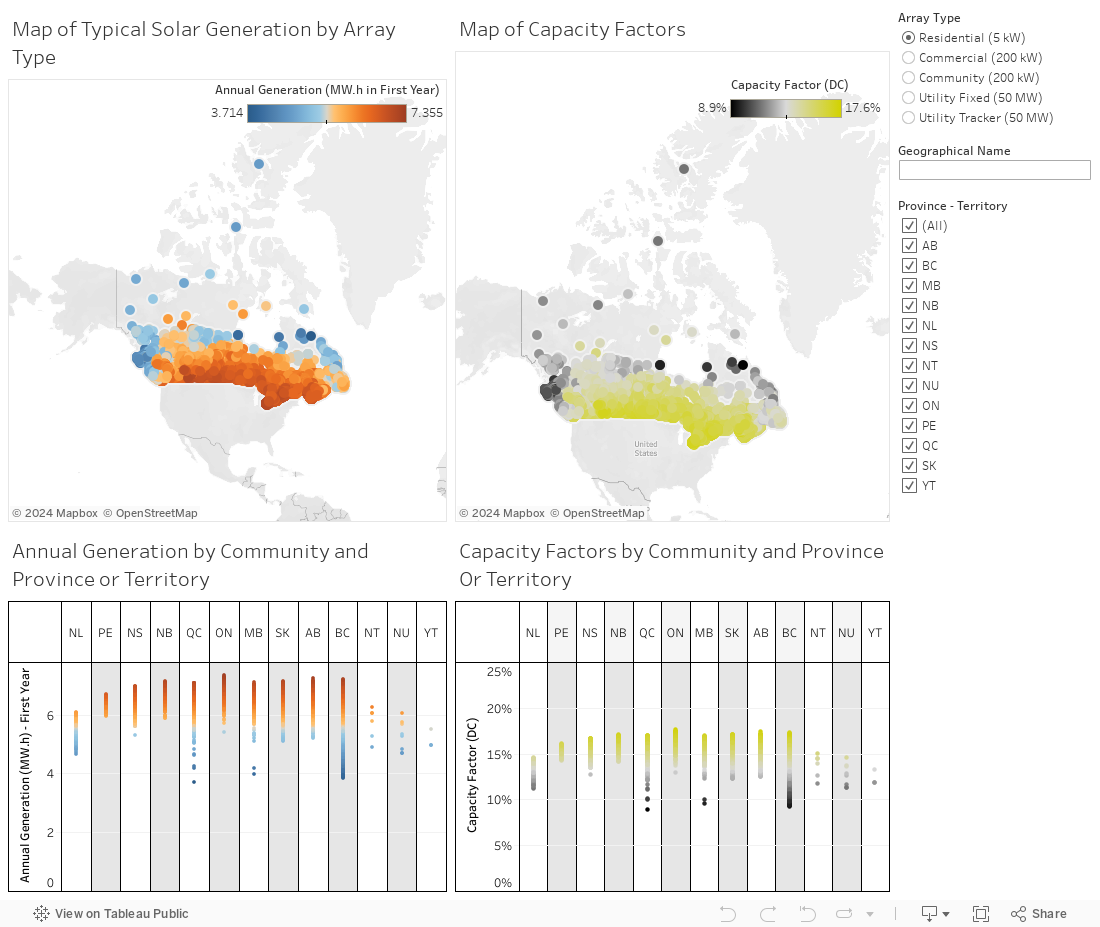
Description:
One map shows the amount of electricity a solar array can generate in each community in Canada by array type. This map shows that the highest amount of generation is nearly double the lowest. The second map shows the capacity factors of solar arrays in each community in Canada by array type. In the second map, the highest capacity factors are almost twice as much as the lowest. Communities close to Canada’s west coast and to Newfoundland and Labrador generate the least amount of energy and have the lowest capacity factors. Locations in the interior of Canada generate the most electricity and have the highest capacity factors.
The first chart plots the amount of electricity solar arrays can generate in each community. The second chart plots the capacity factors in each community. Every province and territory has a wide range of solar potential. In some provinces, the communities with the best solar potential generate 10% more electricity, or have capacity factors 10% higher, than the communities with the worst solar potential. In other provinces, the communities with the best solar potential generate almost twice as much electricity, or have almost double the capacity factors, of the communities with the worst solar potential.
Open data can be freely used and shared by anyone for any purpose. The data for these graphs are available.
General Solar Economics
Electricity generation varies widely based on project location and size. As a result, the economics of each project also vary widely. Whether solar power is competitive in a province often depends more on local electricity prices than the amount of sunlight received, even if local breakeven prices are amongst the lowest in Canada.
Figure 3: Solar breakevens in Canada
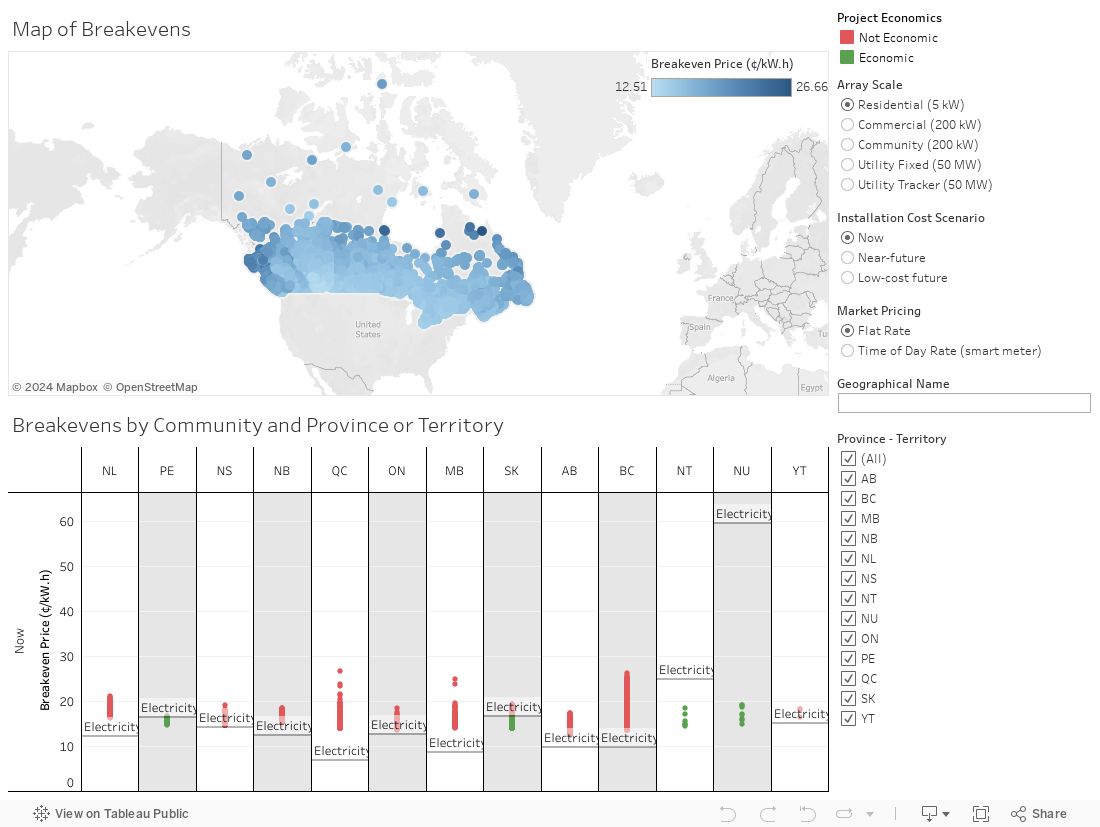
Description:
This map shows solar breakevens in Canada. Regardless of array type or installation cost, breakevens are highest on Canada’s west coast and in Newfoundland and Labrador, and are lower in the interior of the country.
This chart shows solar breakevens in Canada as compared to provincial and territorial electricity prices. Electricity prices vary significantly across the country and by array type. Each province also has a wide range of breakevens. Community solar is the most competitive versus electricity prices, followed by commercial solar and then residential solar, though the degree varies by province. Solar also becomes more competitive over time, with the highest breakevens when installing now, with breakevens growing lower in the near future, and becoming the least in a low-cost future.
Open data can be freely used and shared by anyone for any purpose. The data for these graphs are available.
- Canada’s west coast and Newfoundland and Labrador tend to have the highest break-even prices to generate electricity, while the interior of the country tends to have the lowest break-even prices. Differences in sales taxes between provinces, which are applied to the cost of installing solar, are also important.
- However, electricity prices vary widely across Canada. For example, residential energy charges range from a low of 6.8¢ per kilowatt hour (/kW.h) in Quebec to a high of 16.7¢/kW.h in Saskatchewan. This is because each province’s costs of producing or importing power, transmitting it across large areas, and then distributing it to residential customers are very different.
- For example, Alberta has some of the lowest residential solar breakevens in Canada, but electricity supplied by local distributors is still currently lower price. So, it makes more financial sense to buy electricity from a distributor than to install a solar project to generate it. Meanwhile, Prince Edward Island, which doesn’t receive as much sunlight as southern Alberta, has largely competitive solar break-even prices. This is because electricity prices in Prince Edward Island are relatively high.
- The Northwest Territory’s and Nunavut’s solar breakevens are competitive, versus local electricity prices which are relatively high, because it is expensive to generate electricity in remote areas that rely on diesel. However, installing solar in the territories could be more expensive than assumed in this study because they are remote.
- Some remote, provincial communities could be more competitive than indicated in this study, because of local, higher costs of diesel-powered generation.
- “Time of day” pricing significantly enhances the economics of solar. For residential, commercial, and community solar, this means the electricity generated replaces power otherwise bought from the grid during the day, when electricity demand is highest and it’s the most expensive. This means that consumers could increasingly adopt more residential, commercial, and community solar as provinces continue to roll out smart meters. For utility-scale solar, time-of-day pricing means the electricity is being sold to the grid when it has the highest value and most earning power, improving overall project economics.
Uncertainties
Because costs have been falling over the long term, ESPC looked at the costs to install each type of solar in three ways: the cost to install now, the cost to install in the near future, and the cost to install in a low cost future if costs keep rapidly falling.
- However, some parts of Canada (like southern Ontario) are more experienced at installing solar projects, which means current costs could be more like near-future costs or even lower in those places.
- Some provinces have rebate programs for residential, commercial, and community projects. Because these programs can always be expanded or reduced, and are not always permanent, they become a significant uncertainty in understanding Canada’s solar economics.
Future electricity prices are a major uncertainty.
- Because Canadian electricity prices have been rising faster than the rate of inflation, it was assumed the value of electricity generated would increase above inflation by an additional 1.91% per year (the annual average from 2010 to 2017). In other words, energy charges would be 19.1% higher than current prices in 10 years, while energy charges would be 47.75% higher than current prices in 25 years. This increases the value of electricity generated in the future and improves solar’s “present value” economics.
- The “Energy Price” reference lines on many of ESPC’s graphs are price benchmarks meant to help readers understand whether solar projects will make financial sense to build or not. However, these reference lines are kept at the same level for all three cost scenarios—current, near-future, and low-cost future. This is important because a project constructed in five or ten years from now, will compete with grid-purchased electricity prices at that time, which will likely be higher than today’s grid-purchased prices. Thus, solar projects installed in the future will likely be more competitive than indicated here.
Residential-scale results
| Type | Current Installation ($/W) | Near Future Installation ($/W) | Low Cost Future Installation ($/W) |
|---|---|---|---|
| Residential (5 kW) | $3.197 | $2.595 | $2.252 |
Currently, solar breakevens are less than residential electricity prices in most places in Prince Edward Island and Saskatchewan. This means that homeowners in most places there could expect to save money by installing solar. Homeowners could expect to save money with residential solar in many places in Ontario, where homes have smart meters capture “time of day” value. Rebate programs in Nova Scotia and in Alberta make current costs like those in a low-cost future. This means residential solar would be expected to save homeowners money almost everywhere in Nova Scotia as well as in many places in Alberta, though Alberta would require smart meters to be installed.
- This is because electricity prices charged by utilities in these provinces are high enough to make residential solar competitive.
- Residential solar breakevens are also lower than residential electricity prices in the Northwest Territories and Nunavut, meaning homeowners there could expect to save money by installing solar. However, it should be kept in mind that the cost to install solar in the territories is likely higher than assumed in this study because they are remote. Homeowners in Yukon might also be able to save money with residential solar if smart meters are deployed on homes.
- As it becomes less expensive to install residential solar, breakevens fall below residential electricity prices in many places in Newfoundland and Labrador, New Brunswick, Alberta, and British Columbia. Homeowners in those places could expect to save money, especially if homes they have smart meters installed.
- However, Manitoba and Quebec have relatively low prices for residential electricity which means residential solar would not be expected to save homeowners money in those provinces, even in a low-cost future.
Figure 4: Maps of residential solar breakevens by $/kW.h and as compared to provincial and territorial energy charges (plus other variable charges)
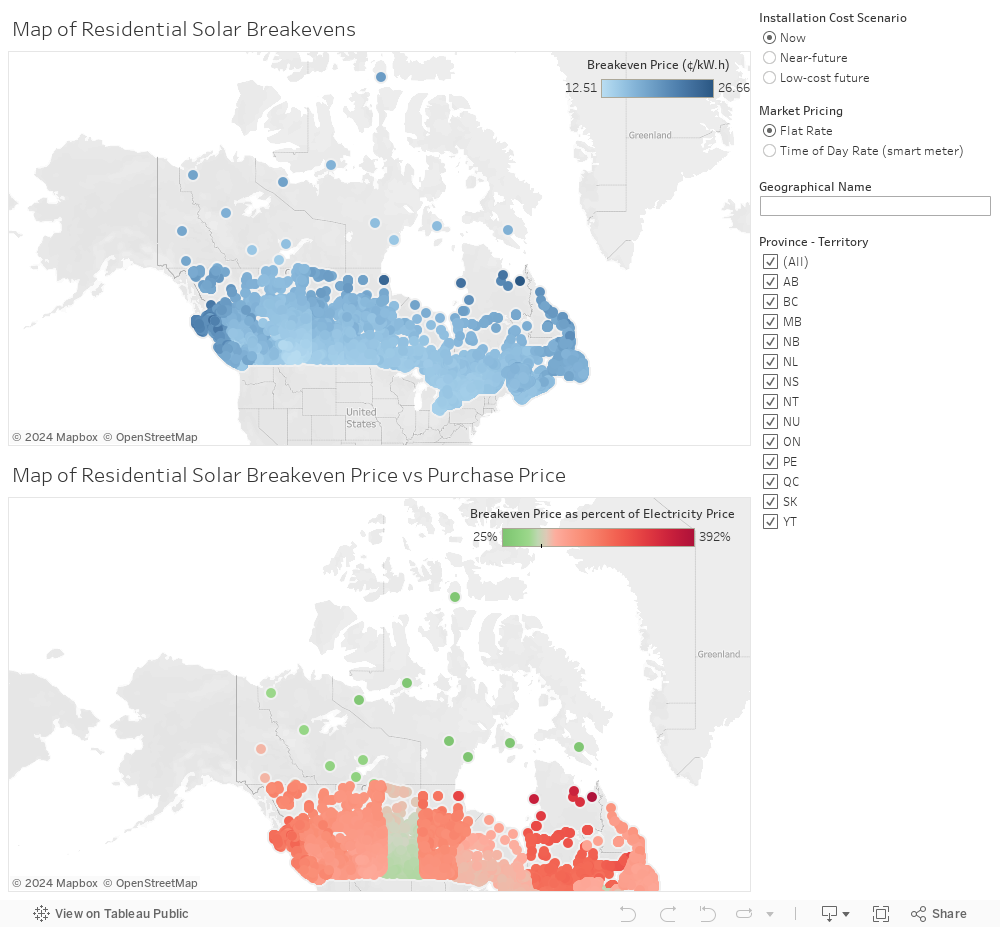
Description:
This map shows the residential solar breakevens in Canada, which currently range from 12.5¢/kW.h to 26.7¢/kW.h for flat prices, and 8.3¢/kW.h to 22.1¢/kW.h for time-of-day prices. In the near future, this ranges from 10.4¢/kW.h to 22.2¢/kW.h for flat prices and 6.0¢/kW.h to 18.4¢/kW.h for time-of-day prices. In a low-cost future, this ranges from 9.3¢/kW.h to 20.0¢/kW.h for flat prices and 4.7¢/kW.h to 16.3¢/kW.h for time-of-day prices.
The second map compares these residential breakeven prices to residential electricity prices across Canada. Currently, most places in Prince Edward Island and Saskatchewan have solar breakevens lower than residential electricity prices for both flat rates and time-of-day rates. Many places in Nova Scotia and Ontario have breakevens lower than electricity prices for time-of-day rates only. In the near future, many places in Ontario and Nova Scotia have lower solar breakevens for both flat rates and time-of-day rates, while almost all of Ontario, Nova Scotia, New Brunswick, and southern Alberta have solar breakevens lower than residential electricity prices. Most places in Canada have solar breakevens lower than residential electricity prices at time-of-day rates in a low cost future, except for Quebec, Manitoba, and British Columbia outside its southern interior.
Open data can be freely used and shared by anyone for any purpose. The data for these graphs are available.
Figure 5: Plot of residential solar breakevens by community and compared to provincial and territorial energy charges (plus other variable charges)
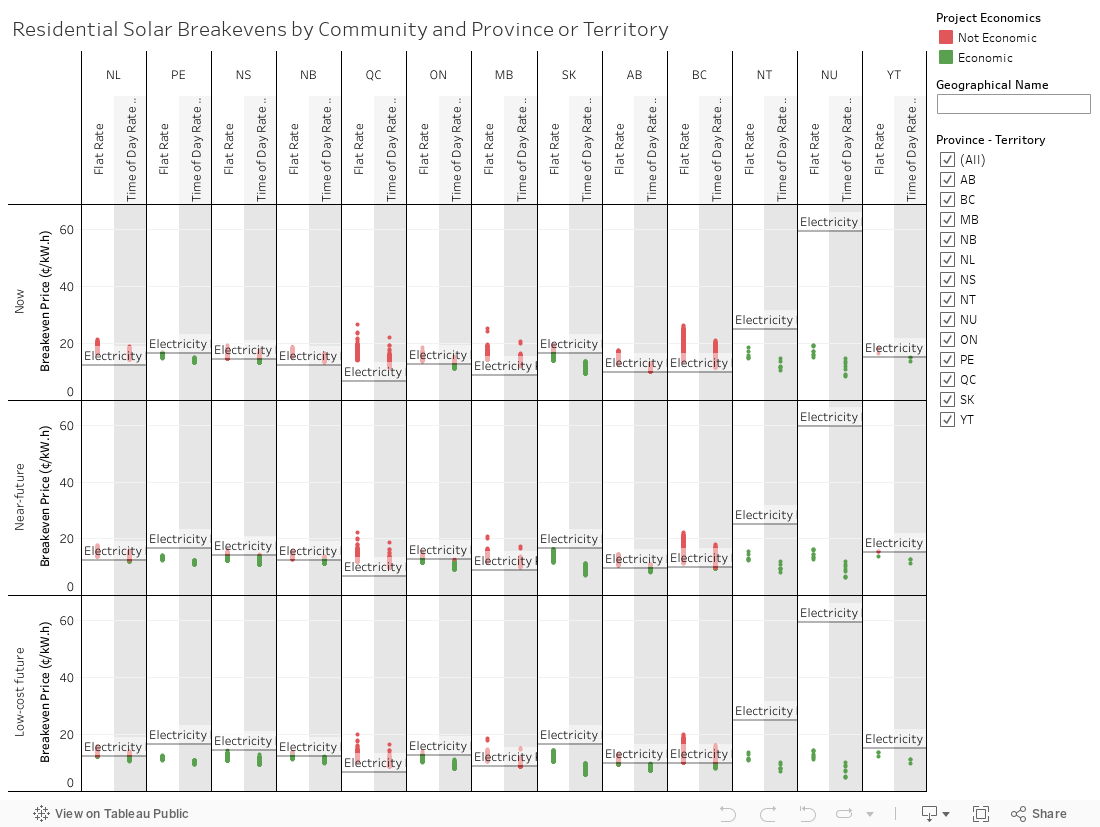
Description:
This chart plots residential solar breakevens in Canada, which currently range from 12.5¢/kW.h to 26.7¢/kW.h for flat prices, and 8.3¢/kW.h to 22.1¢/kW.h for time-of-day prices. In the near future, this ranges from 10.4¢/kW.h to 22.2¢/kW.h for flat prices and 6.0¢/kW.h to 18.4¢/kW.h for time-of-day prices. In a low-cost future, this ranges from 9.3¢/kW.h to 20.0¢/kW.h for flat prices and 4.7¢/kW.h to 16.3¢/kW.h for time-of-day prices.
This chart includes reference lines for each province and territory to show whether a plotted solar breakeven is higher or lower than residential electricity prices for that province or territory. Currently, most places in Prince Edward Island and Saskatchewan have solar breakevens lower than residential electricity prices for both flat rates and time-of-day rates. Many places in Nova Scotia and Ontario have breakevens lower than electricity prices for time-of-day rates only. In the near future, many places in Ontario and Nova Scotia have lower solar breakevens for both flat rates and time-of-day rates, while almost all of Ontario, Nova Scotia, New Brunswick, and some of Alberta have solar breakevens lower than residential electricity prices. Most places in Canada have solar breakevens lower than residential electricity prices at time-of-day rates in a low cost future, except for Quebec, Manitoba, and some of British Columbia.
Open data can be freely used and shared by anyone for any purpose. The data for these graphs are available.
Commercial-scale results
| Type | Current Installation ($/W) | Near Future Installation ($/W) | Low Cost Future Installation ($/W) |
|---|---|---|---|
Commercial (200 kW) |
$2.210 |
$1.772 |
$1.529 |
Currently, commercial solar breakevens are less than commercial electricity prices in most places in Prince Edward Island, Nova Scotia, and Ontario. This means that businesses in in those communities could expect to save money by installing commercial solar. Businesses could also expect to save money with commercial solar in most places in New Brunswick if smart meters are installed. Rebate programs in Saskatchewan make current costs like those in the near future, while rebate programs in Alberta make current costs like those in a low-cost future. This means businesses would be expected to save money with commercial solar in most places in Saskatchewan and Alberta.
- This is because average electricity bills from local utilities in these provinces are high enough to make commercial solar competitive.
- Commercial solar breakevens are also lower than commercial electricity prices in the Northwest Territories and Nunavut. This means businesses there could expect to save money by installing solar. However, the cost to install solar in the territories is likely higher than assumed in this study because they are remote. Businesses in Yukon could also expect to save money with commercial solar if smart meters are deployed.
- As it becomes less expensive to install commercial solar, breakevens fall below commercial electricity prices in many places in Quebec and British Columbia, and businesses in those communities would be expected to save money, especially if businesses in those places have smart meters.
- However, Manitoba and Newfoundland and Labrador have relatively low prices for electricity purchased from utilities, which means commercial solar would not be expected to save businesses money in those provinces, even in a low-cost future.
Figure 6: Maps of commercial solar breakevens by $/kW.h and as compared to the per kW.h cost of electricity of typical electricity bills
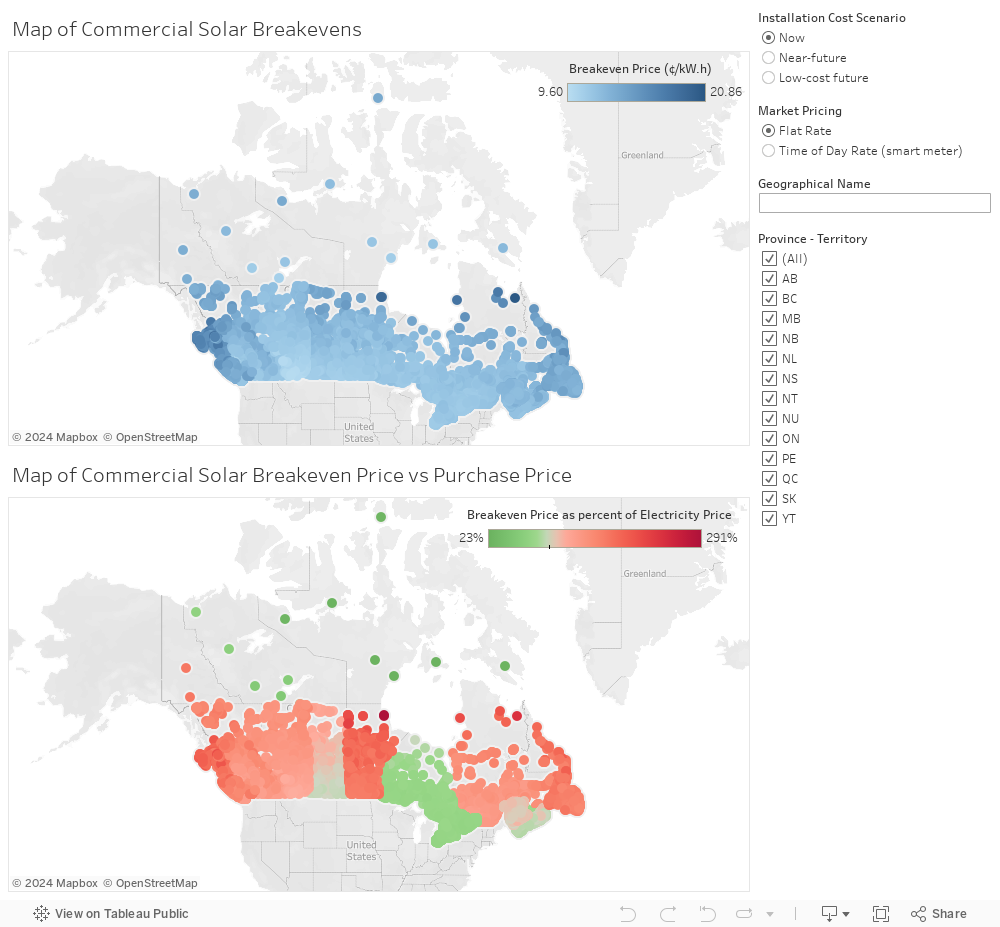
Description:
This map shows the commercial solar breakevens in Canada, which currently range from 9.6¢/kW.h to 20.9¢/kW.h for flat prices, and 7.1¢/kW.h to 16.9¢/kW.h for time-of-day prices. In the near future, this ranges from 8¢/kW.h to 17.7¢/kW.h for flat prices and 5.8¢/kW.h to 14.3¢/kW.h for time-of-day prices. In a low-cost future, this ranges from 7.0¢/kW.h to 15.9¢/kW.h for flat prices and 5.2¢/kW.h to 12.8¢/kW.h for time-of-day prices.
The second map that compares these commercial breakeven prices to commercial electricity prices across Canada. Currently, most places in Prince Edward Island, Nova Scotia, and Ontario have solar breakevens lower than commercial electricity prices for both flat rates and time-of-day rates. Most places in New Brunswick, Saskatchewan, and Alberta have breakevens lower than electricity prices for time-of-day rates only. In the near future, many places in New Brunswick, Ontario, and Saskatchewan have lower solar breakevens for both flat rates and time-of-day rates. Most places in Canada have solar breakevens lower than commercial electricity prices at time-of-day rates in a low cost future, except for Newfoundland and Labrador, Manitoba, and areas of British Columbia outside its southern interior.
Open data can be freely used and shared by anyone for any purpose. The data for these graphs are available.
Figure 7: Plot of commercial solar breakevens by community as compared to per kW.h cost of electricity on typical electricity bills
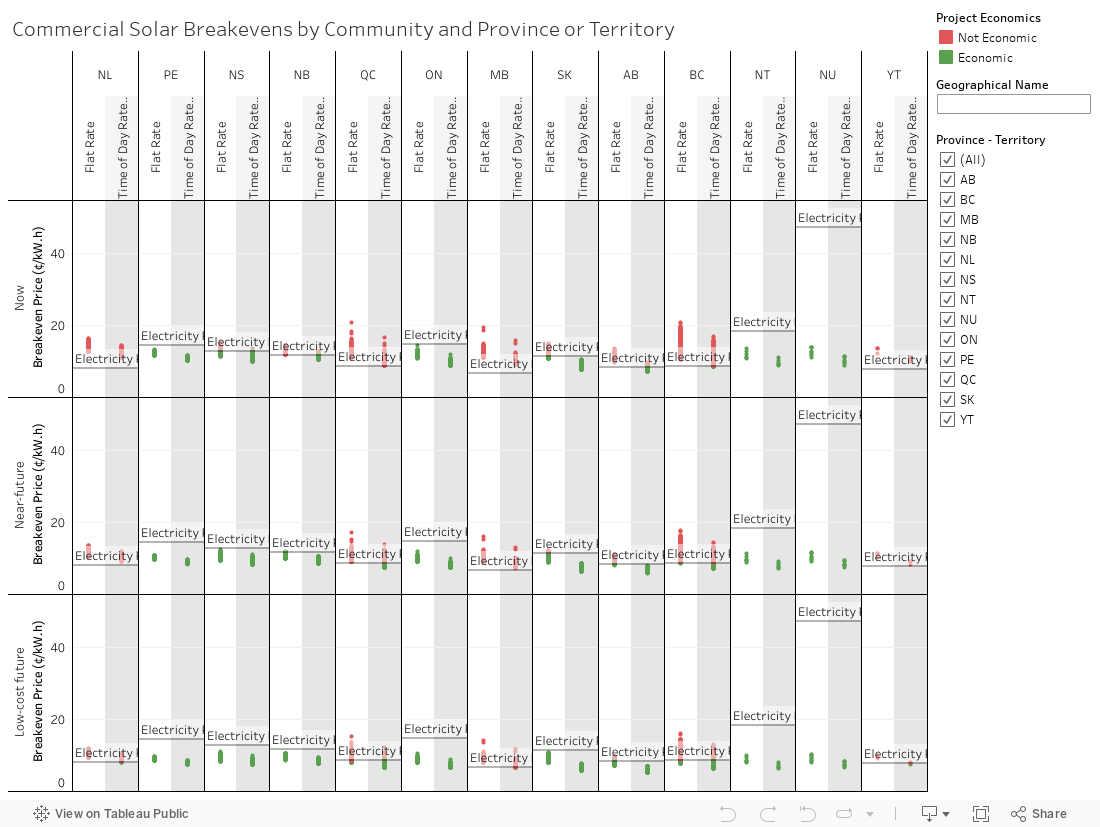
Description:
This chart shows the commercial solar breakevens in Canada, which currently range from 9.6¢/kW.h to 20.9¢/kW.h for flat prices, and 7.1¢/kW.h to 16.9¢/kW.h for time-of-day prices. In the near future, this ranges from 8¢/kW.h to 17.7¢/kW.h for flat prices and 5.8¢/kW.h to 14.3¢/kW.h for time-of-day prices. In a low-cost future, this ranges from 7.0¢/kW.h to 15.9¢/kW.h for flat prices and 5.2¢/kW.h to 12.8¢/kW.h for time-of-day prices.
This chart includes reference lines for each province and territory to show whether a plotted solar breakeven is higher or lower than commercial electricity prices for that province or territory. Currently, most places in Prince Edward Island, Nova Scotia, and Ontario have solar breakevens lower than commercial electricity prices for both flat rates and time-of-day rates. Most places in New Brunswick, Saskatchewan, and Alberta have breakevens lower than electricity prices for time-of-day rates only. In the near future, many places in New Brunswick, Ontario, and Saskatchewan have lower solar breakevens for both flat rates and time-of-day rates. Most places in Canada have solar breakevens lower than commercial electricity prices at time-of-day rates in a low cost future, except for Newfoundland and Labrador, Manitoba.
Open data can be freely used and shared by anyone for any purpose. The data for these graphs are available.
Community-scale results
| Type | Current Installation ($/W) | Near Future Installation ($/W) | Low Cost Future Installation ($/W) |
|---|---|---|---|
| Community (200 kW) | $2.210 | $1.772 | $1.529 |
Currently, community-solar breakevens are less than electricity prices in most places in Prince Edward Island, Nova Scotia, Ontario, and Saskatchewan, meaning those communities would be expected to save money by installing solar. Communities could also expect to save money with solar in many places in Quebec and Alberta if smart meters are installed. Rebate programs in Alberta make current costs like those in a low-cost future. This means communities could expect to save money with community-solar projects in most places in Alberta.
- This is because average electricity bills from local utilities in these provinces are high enough to make community solar competitive. Also, as non-profits, community projects have lower taxes than commercial projects.
- Solar breakevens for community projects are also lower than electricity prices in the Northwest Territories and Nunavut. This means that communities would be expected to save money by installing solar. However, the cost to install solar in the territories is likely higher than assumed in this study because they are remote. Communities in Yukon could also expect to save money with community-solar projects if smart meters are deployed.
- If it becomes less expensive to install community solar, many places in every province could expect to save money in a low-cost future, especially if they have smart meters.
Figure 8: Maps of community solar breakevens by $/kW.h and as compared to the per kW.h cost of electricity on typical energy bills

Description:
This first map shows the community solar breakevens in Canada, which currently range from 9.1¢/kW.h to 19.9¢/kW.h for flat prices, and 6.7¢/kW.h to 16.1¢/kW.h for time-of-day prices. In the near future, this ranges from 7.6¢/kW.h to 16.9¢/kW.h for flat prices and 5.6¢/kW.h to 13.7¢/kW.h for time-of-day prices. In a low-cost future, this ranges from 6.7¢/kW.h to 15.2¢/kW.h for flat prices and 4.9¢/kW.h to 12.3¢/kW.h for time-of-day prices.
This second map compares these community breakeven prices to community electricity prices across Canada. Currently, most places in Prince Edward Island, Nova Scotia, New Brunswick, Ontario, and Saskatchewan have solar breakevens lower than community electricity prices for both flat rates and time-of-day rates. Most places in Alberta have breakevens lower than electricity prices for time-of-day rates only. In the near future, most places in Quebec have lower solar breakevens for both flat rates and time-of-day rates. Most places in Canada have solar breakevens lower than community electricity prices at time-of-day rates in a low cost future, except for Newfoundland and Labrador, Manitoba, and areas of British Columbia outside its southern interior.
Open data can be freely used and shared by anyone for any purpose. The data for these graphs are available.
Figure 9: Plot of community solar breakevens by community as compared to per kW.h cost of electricity on typical electricity bills
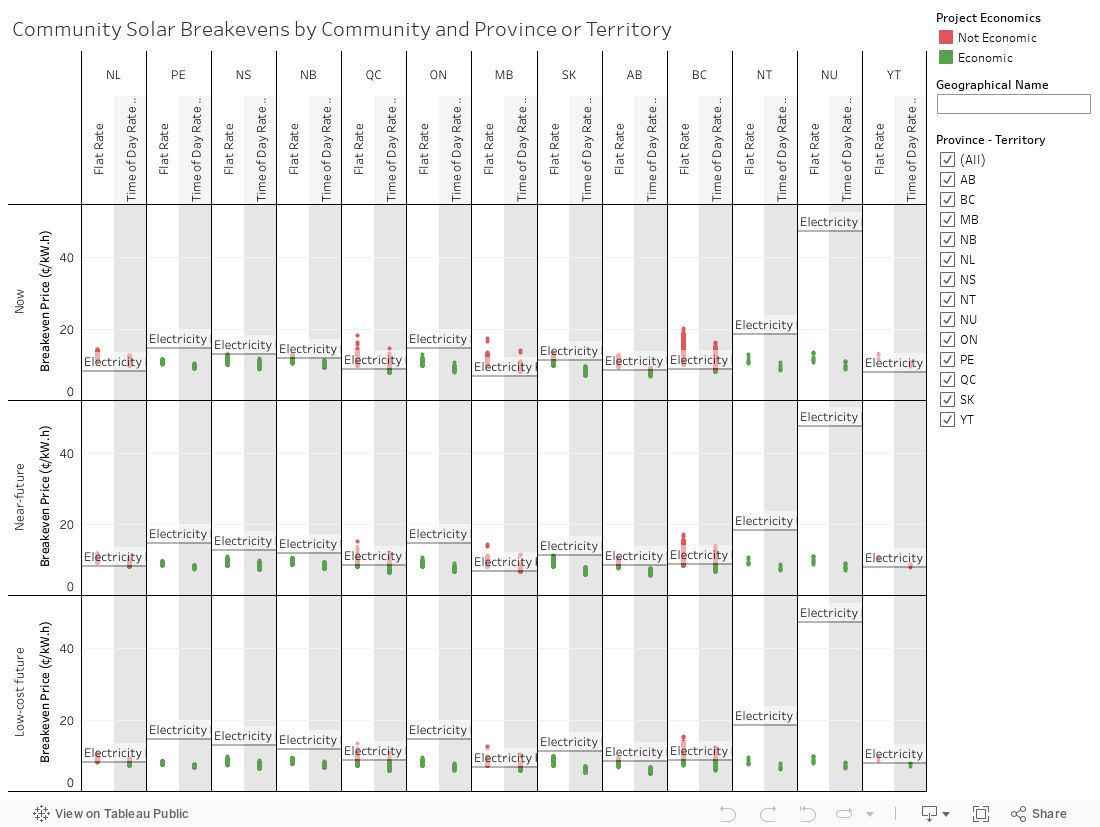
Description:
This chart shows the community solar breakevens in Canada, which currently range from 9.1¢/kW.h to 19.9¢/kW.h for flat prices, and 6.7¢/kW.h to 16.1¢/kW.h for time-of-day prices. In the near future, this ranges from 7.6¢/kW.h to 16.9¢/kW.h for flat prices and 5.6¢/kW.h to 13.7¢/kW.h for time-of-day prices. In a low-cost future, this ranges from 6.7¢/kW.h to 15.2¢/kW.h for flat prices and 4.9¢/kW.h to 12.3¢/kW.h for time-of-day prices.
This chart includes reference lines for each province and territory to show whether a plotted solar breakeven is higher or lower than community electricity prices for that province or territory. Currently, most places in Prince Edward Island, Nova Scotia, New Brunswick, Ontario, and Saskatchewan have solar breakevens lower than community electricity prices for both flat rates and time-of-day rates. Most places in Alberta have breakevens lower than electricity prices for time-of-day rates only. In the near future, most places in Quebec have lower solar breakevens for both flat rates and time-of-day rates. Most places in Canada have solar breakevens lower than community electricity prices at time-of-day rates in a low cost future, except for Newfoundland and Labrador, Manitoba, and areas of British Columbia outside its southern interior.
Open data can be freely used and shared by anyone for any purpose. The data for these graphs are available.
Utility-scale results
| Type | Current Installation ($/W) | Near Future Installation ($/W) | Low Cost Future Installation ($/W) |
|---|---|---|---|
| Utility – Fixed Mount (50 MW) | $1.458 | $1.001 | $0.753 |
| Utility – Tracker Mount (50 MW) | $1.557 | $1.067 | $0.803 |
The break-even prices of utility-scale projects are more complex than other types of projects. This is because utility-scale projects sometimes need to pay tariffs to connect to transmission systems. Also, utility-scale projects can use tracking mounts instead of fixed mounts. Tracking-mount systems are able to generate more electricity per kW of installed capacity, but are more expensive to install.
- Capacity factorsFootnote 5 for utility-scale projects with fixed mounts are significantly lower than for projects with tracker mounts (capacity factors are as high as 17% for fixed-mount projects and 22% for tracker-mount projects, for example). Overall, Canadian projects with tracker mounts will generate anywhere between a tenth to a third more electricity than a fixed-mount project will.
- Based on assumed installation costs, utility-scale projects with tracking mounts have lower break-even prices than utility-scale projects with fixed mounts in Canada (Figure 7). Thus, the extra cost to install tracking mounts is more than offset by the increased revenue from increased electricity generation.
Figure 10: Fixed-mount and tracker-mount utility-scale capacity factors and breakevens by province and community
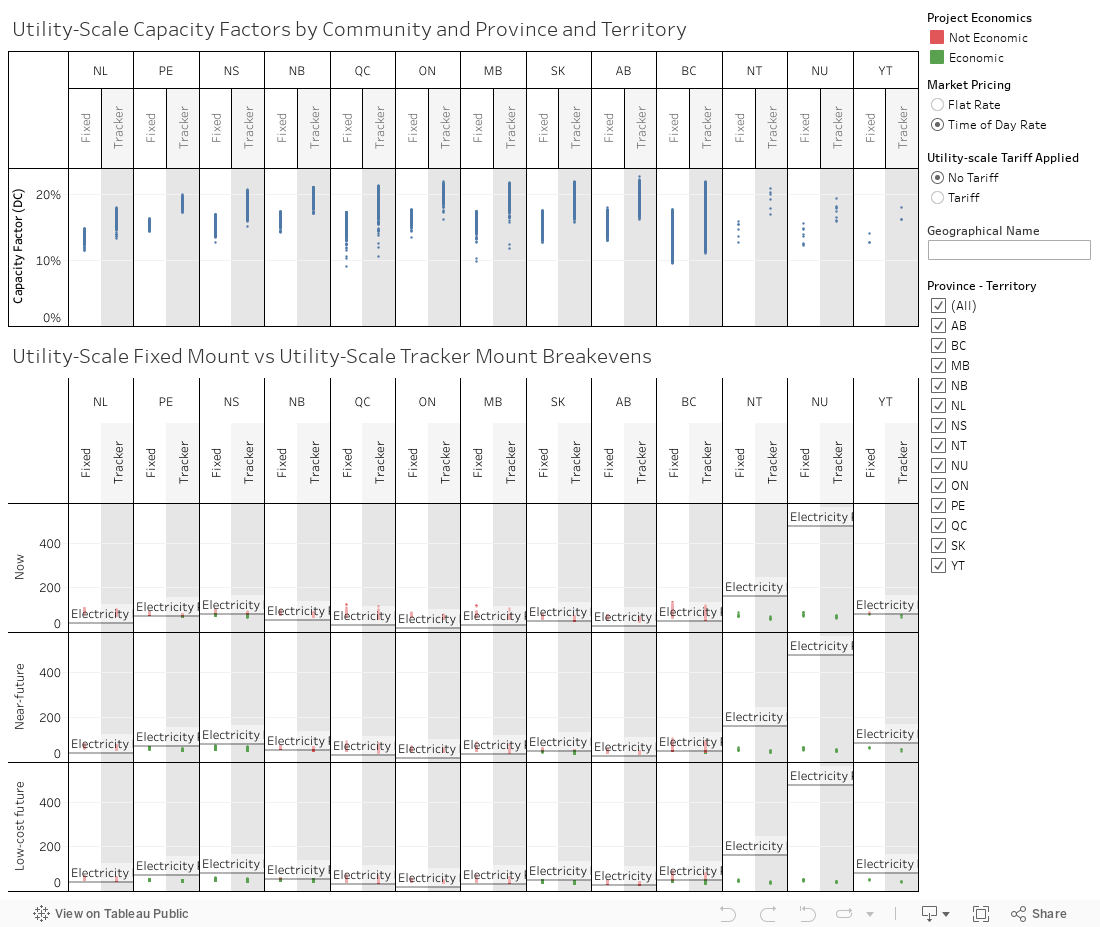
Description:
The first chart in this figure shows the capacity factors of utility-scale solar in Canada, which range from 10% to 18% for fixed mount projects and 12% to 28% for tracker mount projects. The capacity factors in each province vary widely.
The second chart in this figure compares the utility-scale breakevens between fixed mount projects and tracker mount projects. In every community in Canada, tracker mount breakevens are lower than fixed mount breakevens.
Open data can be freely used and shared by anyone for any purpose. The data for these graphs are available.
- The price premiums that utility-scale solar projects earn by generating electricity during daytime and evening hours—when electricity demand is the highest—means that time-of-day break-even prices for utility-scale solar are significantly lower than their flat rate.
- The flat rate is the constant, hourly price that would support a utility-scale solar project, not considering hourly premiums during the morning, afternoon, and evening—when demand for electricity is the highest. Flat rates might be best thought of as the price at which utility-scale projects must sell their electricity at to break even.
- The time-of-day rate is the average, daily electricity price that would support a utility-scale solar project when hourly premiums are considered. Time-of-day rates might be best thought of as the average, daily market prices that result in the higher rates utility-scale projects can receive in the middle of the day, when demand is highest. Thus, time-of-day rates put utility-scale solar into perspective with a 24-hour period, not just the window in which utility-scale solar projects sell.
- Importantly, time-of-day rates are more useful at showing the value of utility-scale solar power to the market. Because solar power generates electricity when demand is highest, it has more value and earning power. Thus, utility-scale time-of-day breakevens are lower than flat-rate breakevens.
- Provincial tariffs can significantly increase the break-even prices of utility-scale projects, keeping these projects uneconomic in all provinces. This is because tariffs are generally based on facility capacity, not generation.
- Tariffs are meant to recover the costs of operating an electricity grid. Tariffs help pay for transmission systems, which transport electricity from distant generating stations to consuming markets. Tariffs also support grid stability, by recovering costs associated with “reserve” power, which largely sits idle until one of more generating stations has an outage.
- Solar projects have such a low capacity factor that their tariff costs per unit of electricity generated are much higher than facilities that have higher capacity factors—such as nuclear, hydro, and base-load coal-fired and gas-fired units. Even with reductions in installation costs over the long term, high tariff costs continue to make a large majority of places in Canada uneconomic for utility-scale solar.
- However, generating stations may not need to pay for tariffs in some circumstances. For example, if the electricity is bought as part of a power-purchase agreement, the buyer may pay tariff costs. If the generation station is connected directly to a distribution system (skipping transmission systems altogether), it will likely not need to pay transmission tariffs, though some tariffs associated with grid stability may still be required.
Currently, some places in Nova Scotia and Prince Edward might be economic if no tariffs are applied and the projects use trackers. This is because the price of electricity is high enough in these provinces that utility-scale projects can compete with other forms of generation.
- As installation costs fall, it makes financial sense to install utility-scale solar in most places in Prince Edward Island, Nova Scotia, New Brunswick, Saskatchewan, and some of British Columbia whether trackers are installed or not. But, only if no, or reduced, tariffs are applied. Other places in Canada would need electricity prices to be higher.
Figure 11: Maps of fixed-mount, utility-scale solar breakevens by $/MW.h and as compared to provincial wholesale prices or large industry energy charges
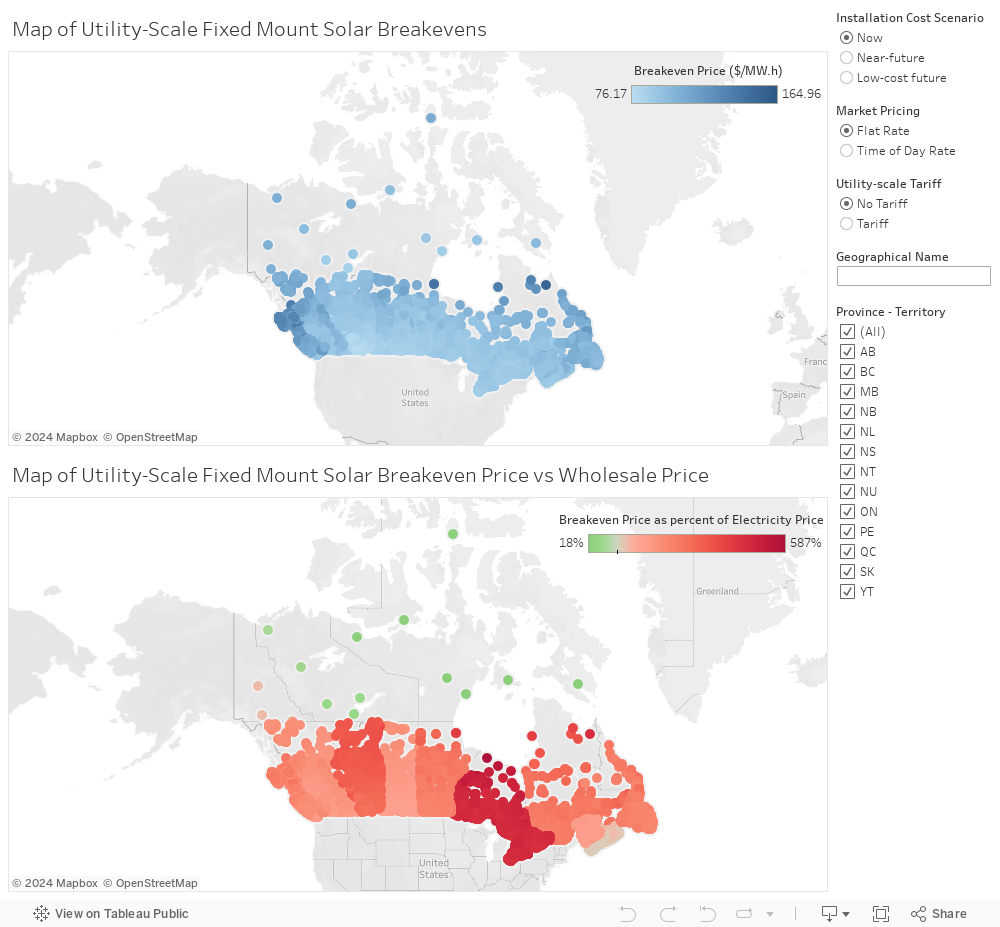
Description:
The first map in this figure shows the utility-scale fixed mount solar breakevens in Canada When no tariffs are applied, breakevens currently range from $76/MW.h to $165/MW.h for flat prices and $56/MW.h to $133/MW.h for time-of-day prices. In the near future, this ranges from $57/MW.h to $129/MW.h for flat prices and $42/MW.h to $104/MW.h for time-of-day prices. In a low-cost future, this ranges from $47/MW.h to $109/MW.h for flat prices and $34/MW.h to $88/MW.h for time-of-day prices.
When tariffs are applied, breakevens currently range from $84/MW.h to $272/MW.h for flat prices and $62/MW.h to $218/MW.h for time-of-day prices. In the near future, this ranges from $64/MW.h to $233/MW.h for flat prices and $48/MW.h to $187/MW.h for time-of-day prices. In a low-cost future, this ranges from $52/MW.h to $211/MW.h for flat prices and $40/MW.h to $170/MW.h for time-of-day prices.
The second map compares these utility-scale, fixed mount solar breakeven prices to wholesale electricity prices across Canada. Currently, when no tariffs are applied, only some places in Nova Scotia have solar breakevens lower than wholesale electricity prices for both flat rates and time-of-day rates. In the near future, all of Nova Scotia, Prince Edward Island, and some southern places in Saskatchewan will have lower solar breakevens for time-of-day rates. Almost everywhere else in Canada, utility-scale, fixed mount solar remains uneconomic, even in a low-cost future, except for some places in New Brunswick and the southern Interior of British Columbia.
When tariffs are applied, no place is economic in Canada, even in a low-cost future.
Open data can be freely used and shared by anyone for any purpose. The data for these graphs are available.
Figure 12: Plot of fixed-mount, utility-scale solar breakevens by community compared to provincial wholesale prices or large industry energy charges
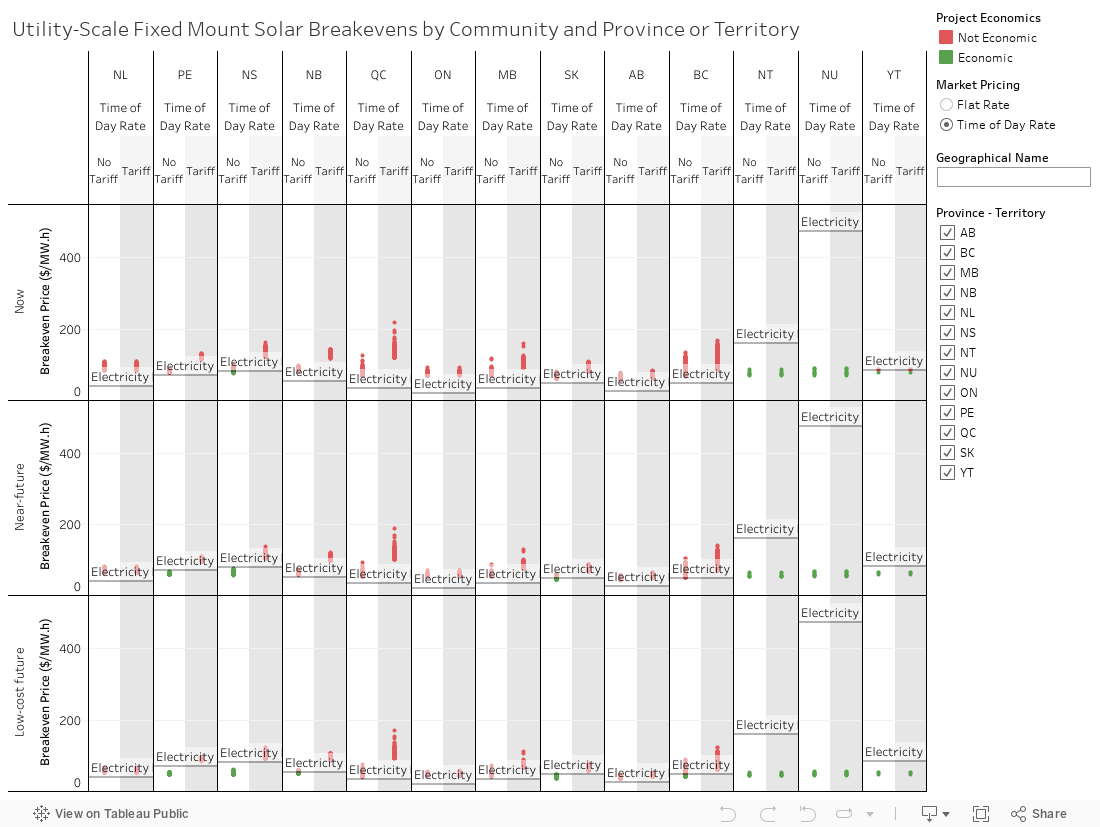
Description:
This chart shows the utility-scale fixed mount solar breakevens in Canada when no tariffs are applied, breakevens currently range from $76/MW.h to $165/MW.h for flat prices and $56/MW.h to $133/MW.h for time-of-day prices. In the near future, this ranges from $57/MW.h to $129/MW.h for flat prices and $42/MW.h to $104/MW.h for time-of-day prices. In a low-cost future, this ranges from $47/MW.h to $109/MW.h for flat prices and $34/MW.h to $88/MW.h for time-of-day prices.
When tariffs are applied, breakevens currently range from $84/MW.h to $272/MW.h for flat prices and $62/MW.h to $218/MW.h for time-of-day prices. In the near future, this ranges from $64/MW.h to $233/MW.h for flat prices and $48/MW.h to $187/MW.h for time-of-day prices. In a low-cost future, this ranges from $52/MW.h to $211/MW.h for flat prices and $40/MW.h to $170/MW.h for time-of-day prices.
This chart includes reference lines for each province and territory to show whether a plotted solar breakeven is higher or lower than wholesale electricity prices for that province or territory. Currently, when no tariffs are applied, only some places in Nova Scotia have solar breakevens lower than wholesale electricity prices for both flat rates and time-of-day rates. In the near future, all of Nova Scotia, Prince Edward Island, and some places in Saskatchewan will have lower solar breakevens for time-of-day rates. Almost everywhere else in Canada remains uneconomic, even in a low-cost future, except for some places in New Brunswick and British Columbia.
When tariffs are applied, no place is economic in Canada, even in a low-cost future.
Open data can be freely used and shared by anyone for any purpose. The data for these graphs are available.
Figure 13: Maps of tracker-mount, utility-scale solar breakevens by $/MW.h and as compared to provincial wholesale prices or large industry energy charges
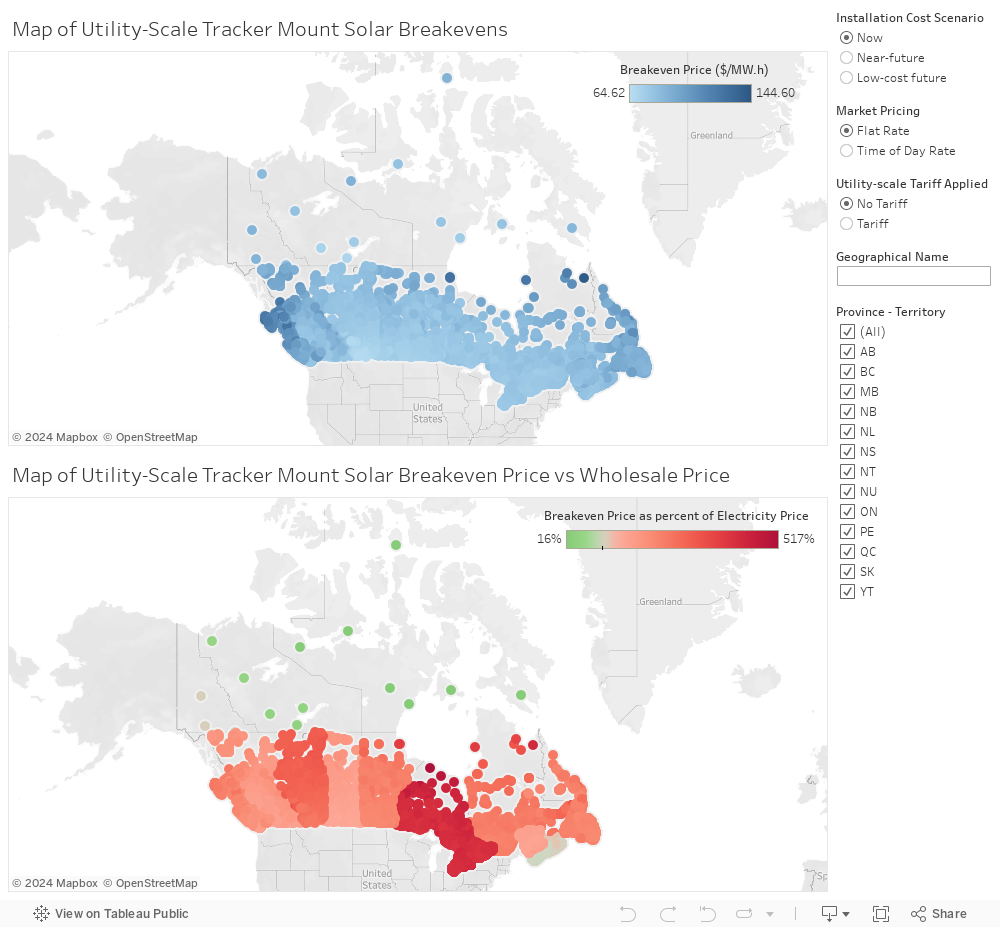
Description:
The first map in this figure shows the utility-scale fixed mount solar breakevens in Canada When no tariffs are applied, breakevens currently range from $65/MW.h to $145/MW.h for flat prices and $49/MW.h to $113/MW.h for time-of-day prices. In the near future, this ranges from $49/MW.h to $113/MW.h for flat prices and $37/MW.h to $91/MW.h for time-of-day prices. In a low-cost future, this ranges from $40/MW.h to $95/MW.h for flat prices and $30/MW.h to $77/MW.h for time-of-day prices.
When tariffs are applied, breakevens currently range from $70/MW.h to $241/MW.h for flat prices and $53/MW.h to $194/MW.h for time-of-day prices. In the near future, this ranges from $41/MW.h to $165/MW.h for flat prices and $41/MW.h to $123/MW.h for time-of-day prices. In a low-cost future, this ranges from $43/MW.h to $186/MW.h for flat prices and $35/MW.h to $149/MW.h for time-of-day prices.
The second map in this figure compares these utility-scale, tracker- mount solar breakeven prices to wholesale electricity prices across Canada. Currently, when no tariffs are applied, some places in Nova Scotia have solar breakevens lower than wholesale electricity prices for both flat rates and time-of-day rate. Meanwhile, Prince Edward Island has some places with breakevens lower than wholesale prices for time-of-day rates. In the near future, all of Nova Scotia, Prince Edward Island, and most of Saskatchewan will have lower solar breakevens for time-of-day rates. Almost everywhere else in Canada remains uneconomic, even in a low-cost future, except for most of New Brunswick and the southern interior of British Columbia.
When tariffs are applied, no place is economic in Canada, even in a low-cost future.
Open data can be freely used and shared by anyone for any purpose. The data for these graphs are available.
Figure 14: Plot of tracker-mount, utility-scale solar breakevens by community compared to provincial wholesale prices or large industry energy charges
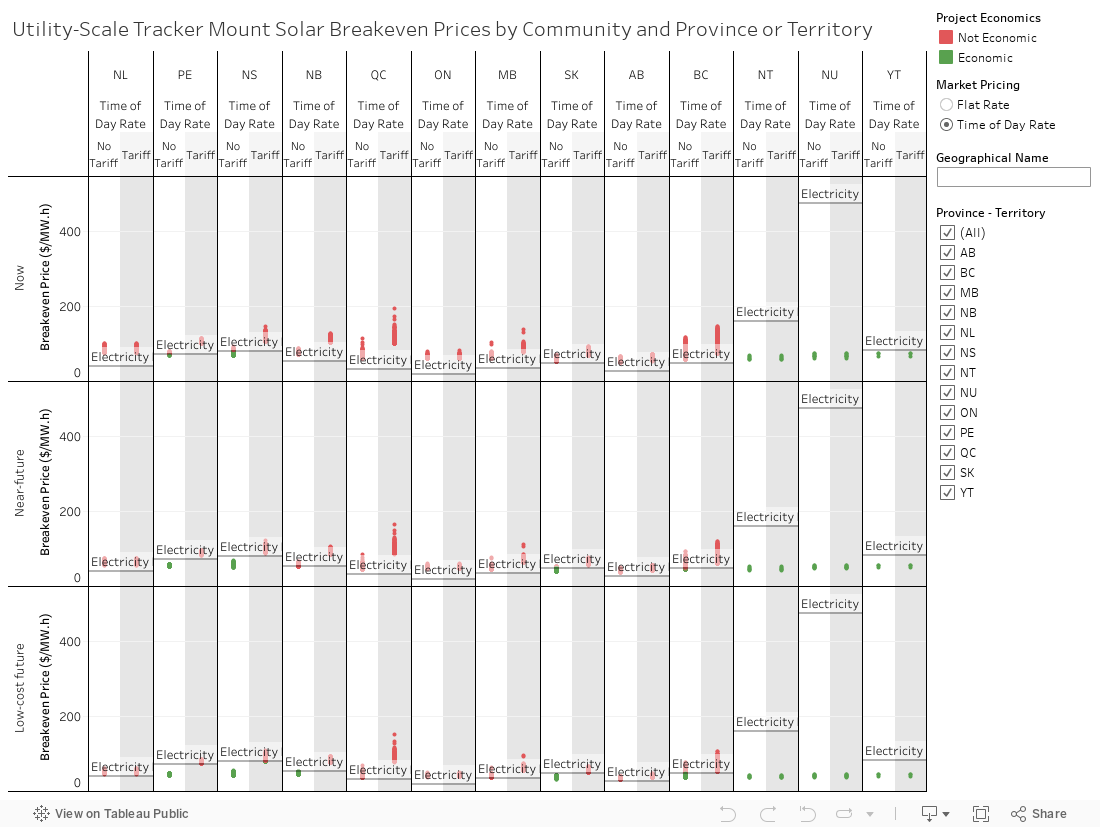
Description:
This chart shows the utility-scale tracker-mount solar breakevens in Canada when no tariffs are applied, breakevens currently range from $65/MW.h to $145/MW.h for flat prices and $49/MW.h to $113/MW.h for time-of-day prices. In the near future, this ranges from $49/MW.h to $113/MW.h for flat prices and $37/MW.h to $91/MW.h for time-of-day prices. In a low-cost future, this ranges from $40/MW.h to $95/MW.h for flat prices and $30/MW.h to $77/MW.h for time-of-day prices.
When tariffs are applied, breakevens currently range from $70/MW.h to $241/MW.h for flat prices and $53/MW.h to $194/MW.h for time-of-day prices. In the near future, this ranges from $41/MW.h to $165/MW.h for flat prices and $41/MW.h to $123/MW.h for time-of-day prices. In a low-cost future, this ranges from $43/MW.h to $186/MW.h for flat prices and $35/MW.h to $149/MW.h for time-of-day prices.
This chart includes reference lines for each province and territory to show whether a plotted solar breakeven is higher or lower than wholesale electricity prices for that province or territory. Currently, when no tariffs are applied, some places in Nova Scotia have solar breakevens lower than wholesale electricity prices for both flat rates and time-of-day rates, while Prince Edward Island has some places with breakevens lower than wholesale prices for time-of-day rates. In the near future, all of Nova Scotia, Prince Edward Island, and most of Saskatchewan will have lower solar breakevens for time-of-day rates. Almost everywhere else in Canada remains uneconomic, even in a low-cost future, except for most of New Brunswick and the southern Interior of British Columbia.
When tariffs are applied, almost nowhere else is economic in Canada, even in a low-cost future.
Open data can be freely used and shared by anyone for any purpose. The data for these graphs are available.
The NEB also estimated break-even prices of utility-scale solar projects in Canada’s Energy Future 2018 (EF2018). Footnote 6
- Date modified: