ARCHIVED – Canadian Refinery Overview 2018 – Energy Market Assessment
This page has been archived on the Web
Information identified as archived is provided for reference, research or recordkeeping purposes. It is not subject to the Government of Canada Web Standards and has not been altered or updated since it was archived. Please contact us to request a format other than those available.
Refineries by Region
Western Canada
Most refineries in Western Canada are owned by vertically integrated companies, which have crude oil production, refining and product marketing. The refineries in western Canada have access to western Canadian crude oil production and domestic crude oil supplies meet all of their feedstock needs. As shown in Figure 11, refineries in western Canada are well connected to local crude oil production by pipeline systems. These refineries use western Canadian crude oil because it is close. This is advantageous relative to other Canadian refineries because their facilities produce products at a lower cost. If and when possible, integrated companies even process their own crude oil production.
Figure 11: Western Canada – Refineries and Major Oil Transportation Routes

Source: Map produced by the NEB, March 2016
Description:
This map shows the location of major oil transportation routes and refineries in western Canada. It shows the two B.C. refineries in Burnaby and Prince George. As well as the four refineries located in Alberta, three in the Edmonton area and one in Lloydminster. The map also shows the refineries in Moose Jaw and Regina, Saskatchewan. In addition, included on the map are the upgraders in Alberta and Saskatchewan.
Refineries in Alberta and B.C. process more oil sands crude, synthetic and bitumen, than other refineries in Canada. (Figure 12) B.C. refineries source crude oil from B.C. as well as from Alberta on the Trans Mountain Pipeline.
Figure 12: Input to Refineries by Crude Type – Alberta and British ColumbiaFootnote 1

Source: CANSIM 126-0003
Description:
This chart shows the breakdown by crude type that is processed in refineries in Alberta and B.C. January to October 2017, Alberta and B.C. refineries processed 61% synthetic crude oil, 24% light and medium crude oil, 12% bitumen, and 3% conventional heavy crude oil.
Western Canada is connected with refined product pipelines. Within Alberta, RPPs are transported from Edmonton on the Alberta Products Pipeline to the southern part of the province. Refined petroleum products are transported to B.C. via the Trans Mountain pipeline and to Saskatchewan, Manitoba and northwestern Ontario on the Enbridge Mainline.
However, Alberta has limited access to RPP imports. In general, the Prairie Provinces cannot easily meet their RPP demand in the event of a disruption because they do not have the capacity to bring in large quantities, by pipeline or other means, from other regions.
Central and Atlantic Canada
In the past, Atlantic Canada and Quebec were not well connected to domestic crude oil production. Until recently, all of these Canadian refineries imported crude oil to meet their needs. With the reversal of Line 9 and more rail capacity, Quebec refineries now process some western Canadian crude oil and are less exposed to international crude oil market fluctuations.
Refineries in Newfoundland and Labrador and New Brunswick still rely almost entirely on imports, and at times process offshore eastern Canadian production. When it is economic to do so, the Irving refinery in New Brunswick rails crude oil from western Canada and the U.S. Because the refineries in Newfoundland and Labrador and New Brunswick import crude oil, they are more exposed to international crude oil market fluctuations.
Figure 13: Eastern Canada and Ontario - Refineries and Major Oil Transportation Routes

Source: Map produced by the NEB, January 2016
Description:
This map shows major oil transportation routes in eastern Canada and Ontario for crude oil and refined petroleum products. It shows the four refineries in Ontario: three in Sarnia and one in Nanticoke. The two refineries in Quebec: one in Montreal and one in Levis near Quebec City. In addition, the map shows the refineries located in eastern Canada: one in Newfoundland and Labrador and one in New Brunswick. The map also shows all major crude oil and refined products pipelines.
Ontario
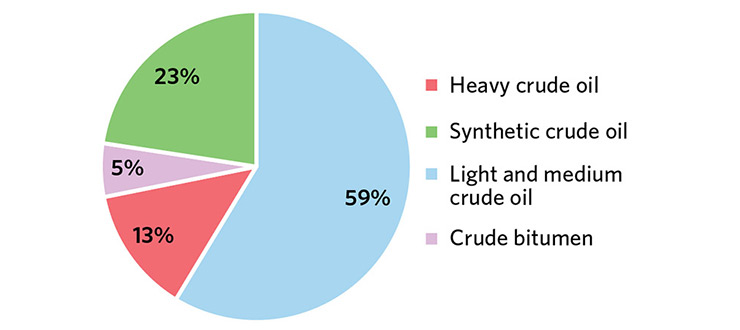
Ontario refineries process both western Canadian crude oil and imports. Almost 60% of the crude oil processed in Ontario is light crude. (Figure 14) Refining costs can be higher in Ontario due to this larger proportion of higher cost light crude, as well as added transportation costs given the distance between Sarnia and large producing areas.
Figure 14: Input to Refineries by Crude Type – OntarioFootnote 2
Source: CANSIM 126-0003
Description:
This chart shows the breakdown by crude type that is processed in refineries in Ontario. January to October 2017, Ontario refineries processed 59% light and medium crude oil, 23% synthetic crude oil, 13% heavy crude oil, and 5% bitumen.
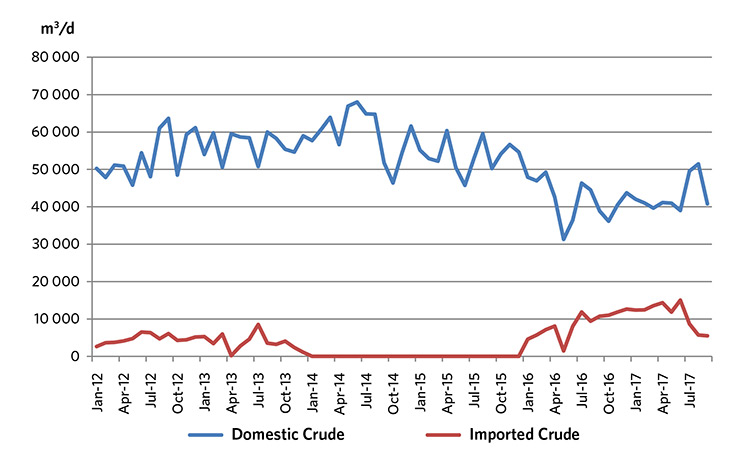
Since the reversal of Line 9 back to its eastward flow, more crude oil has been sourced from the U.S. (Figure 15)
Figure 15: Western Canadian and Imported Crude Oil to Ontario Refineries
Source: CANSIM 134-0001
Description:
This chart shows western Canadian crude and imported crude oil supplied to Ontario refineries between January 2012 and September 2017. Since 2014, domestic crude oil supplied to Ontario refineries has been dropping and imported crude oil has been flat. Beginning in 2016, imported crude oil has been increasing slightly, but recently has dipped down. Domestic crude oil receipts have slowly been increasing since 2015 and more recently have dropped slightly.
RPPs produced in Ontario are consumed in domestic regional markets. Three pipelines transport RPPs in Ontario: the Trans Northern Pipeline, the Sarnia Products Pipeline and the Sun Canadian Pipeline. The Trans Northern Pipeline transports RPPs from Quebec to locations in eastern Ontario and Toronto. The Sarnia Products Pipeline and the Sun Canadian Pipeline transport RPPs from Sarnia to Toronto. Ontario can also receive RPPs by rail, truck, and ship from Quebec and the U.S.
Quebec and Atlantic Canada
Access to tidewater allows refineries in Quebec and Atlantic Canada to have a more diverse crude oil supply than those in Ontario and western Canada, as well as access to markets for their RPP exports. In 2013, the Board approved the reversal and expansion of Line 9B, between North Westover, Ontario and Montreal, Quebec, so that crude oil could flow from west to east all the way to Montreal [Filing A59170]. This gave refineries in Quebec a pipeline connection to western Canadian and U.S. crude oil supply and reversed all of Line 9 to its original direction.
Quebec refineries process mostly light and medium crude oil with smaller volumes of synthetic and bitumen. (Figure 16)
The Pipeline Saint-Laurent, links the Jean Gaulin Refinery operated by Valero in Lévis near Quebec City to the terminal in Montreal East, supplying the Greater Montreal area with large volumes of RPPs such as gasoline, diesel, heating, oil and jet fuel. In addition, Trans Northern Pipeline transports RPPs from Quebec to Ontario.
Figure 16: Input to Refineries by Crude Type – QuebecFootnote 3

Source: CANSIM 126-0003
Description:
This chart shows the breakdown by crude type that is processed in refineries in Quebec. January to October 2017, Quebec refineries processed 56% light and medium crude oil, 35% synthetic crude oil, 7% bitumen, and 2% heavy crude oil.
Refineries located in Atlantic Canada almost exclusively rely on imported crude oil from a number of different countries supplemented with some east coast production. (Figure 17)
The Irving Refinery in Saint John, New Brunswick is the largest refinery in Canada, and exports considerable volumes of RPPs to the U.S. The Irving refinery is unique compared with other refineries because it is a family-owned operation with no crude oil production, and a refining and marketing arm.
Crude Oil Imports to Central and Eastern Canada
Eastern Canada imports significant volumes of crude oil to meet its refining needs. Each province, Newfoundland and Labrador, New Brunswick, Quebec, and Ontario has a diverse crude slate, with imports in some cases coming from several different countries.
In 2017, Newfoundland and Labrador received almost 60% of its crude oil from the U.S. This is down from 2015, when it received almost all of its imports from the U.S. It also imports crude oil from the United Kingdom and Angola.
New Brunswick has the most diverse crude slate. In 2017Footnote 4, Saudi Arabia accounts for almost 40% of New Brunswick’s crude oil imports, followed by Azerbaijan, the United Kingdom, the U.S. and Nigeria.
Quebec receives over 60% of its crude oil imports from the U.S. with lesser volumes from Algeria. U.S. imports have grown with the reversal of Line 9B.
Ontario receives all of its crude oil imports from the U.S. Most of the U.S. imports come from the states of Texas, North Dakota and Indiana.
Figure 17: Imports by Eastern Canadian Provinces YTD 2017Footnote 5

Source: Statistics Canada’s Canadian International Merchandise Trade Database
Description:
This chart shows crude oil imports into Newfoundland and Labrador, New Brunswick, Quebec, and Ontario for the years 2015, 2016 and up to October 2017, and the percentage that each country represents of total imports. In 2017, 59% of Newfoundland and Labrador imports came from the U.S., followed by 18% from the United Kingdom and 9% from each Angola and the Russian Federation; the remaining 3% came from Norway. In New Brunswick, 38% came from Saudi Arabia, followed by 19% from Azerbaijan, 15% from Norway, 12% from Nigeria, and 8% from the U.S. smaller volumes came from the United Kingdom, Angola, Columbia, the Ivory Coast and Iraq. In Quebec 66% of imports came from the U.S. followed by 21% from Algeria, 4% from Kazakhstan, 4% from the United Kingdom and 2% from Nigeria. Ontario receives all of its crude oil imports from the U.S.
- Date modified: