ARCHIVED – Canada’s Energy Future 2017 Supplement: Natural Gas Production
This page has been archived on the Web
Information identified as archived is provided for reference, research or recordkeeping purposes. It is not subject to the Government of Canada Web Standards and has not been altered or updated since it was archived. Please contact us to request a format other than those available.
Canada’s Energy Future 2017 Supplement: Natural Gas Production [PDF 2729 KB]
Report Data and Figures [EXCEL 140 KB]
Appendix Data and Figures [EXCEL 10014 KB]
January 2018
Copyright/Permission to Reproduce
ISSN 2369-1479
Table of Contents
Chapter 1: Background
The National Energy Board’s (NEB) Energy Futures (EF) series explores how possible energy futures might unfold for Canadians over the long term. EF analysis considers a range of impacts across the entire Canadian energy system. In order to cover all aspects of Canadian energy in one supply and demand outlook, crude oil and natural gas production analysis can only be addressed at a relatively high level. Supplemental crude oil and natural gas production analyses address impacts specific to the supply sector, creating an opportunity to provide additional detail and to expand the number of cases to cover greater volatility in crude oil and natural gas prices and in supply-side technology assessment.
Future oil prices are a key driver of future oil production and a key uncertainty to the projections in the Canada’s Energy Future 2017: Energy Supply and Demand Projections to 2040 (EF2017). Crude oil prices could be higher or lower depending on demand, technology, geopolitical events, and the pace at which nations enact policies to reduce GHG emissions.
EF analysis assumes that over the long term all energy produced, given the pricing conditions of the case, will find markets and infrastructure will be built as needed to move that energy to markets. The timing and extent to which particular markets emerge, whether demand growth over/undershoots local production, whether export/import opportunities arise, and whether new infrastructure for crude oil is built, are difficult to predict. This is why simplifying assumptions are made. The analysis in this supplemental report continues the EF tradition of assuming these short-term disconnects are resolved over the longer term.
EF series Natural Gas and Crude Oil Production Supplemental Reports include six cases: the three EF2017 cases, and three additional cases that further analyze oil and gas production in Canada.
Table 1.1 EF2017 Natural Gas and Crude Oil Production Supplements Assumptions/Cases
| Variables | EF2017 | Additional Cases | ||||
|---|---|---|---|---|---|---|
| Reference | Higher Carbon Price | Higher Carbon Price + Technology | Reference + Technology | High Price | Low Price | |
| Oil Price | Moderate | Moderate | Moderate | Moderate | High | Low |
| Gas Price | Moderate | Moderate | Moderate | Moderate | High | Low |
| Carbon Price | Fixed nominal C$50/t | Increasing CO2 cost reaching nominal C$140/t in 2040 | Increasing CO2 cost reaching nominal C$140/t in 2040 | Fixed nominal C$50/t | Fixed nominal C$50/t | Fixed nominal C$50/t |
| Technology Advances | Reference assumption | Reference assumption | Accelerated | Accelerated | Reference assumption | Reference assumption |
| Notes | Based on a current economic outlook and a moderate view of energy prices | Considers the impact on the Canadian energy system of higher carbon pricing | Considers the impact of greater adoption of select emerging energy technologies on the Canadian energy system, including technological advances in oil sands production | Since price is one of the most influential factors in oil and gas production, and does vary over time, these two cases look at the effects of significant price differences on production | ||
This natural gas production supplemental report includes a detailed look at the Reference Case, followed by results from the other five cases. In the technology cases, technological advances focus on oil sands production and not natural gas; therefore, natural gas prices are assumed to be the same in each technology case. Consequently, all of the cases except the High Price and Low Price cases have the same gas price projection. The natural gas price assumptions in the High and Low Price cases differ significantly from the other cases.
The Appendix includes a description of the methods and assumptions used to project natural gas production, and detailed data sets for all cases – including annual wells drilled, production decline curve parameters, and monthly production, all by stratigraphic and geographic grouping. The Appendix , data from the Appendix [EXCEL 141 KB], and Chart data [EXCEL 11159 KB] are available.
Chapter 2: Reference Case
2.1 Production by Type of Gas
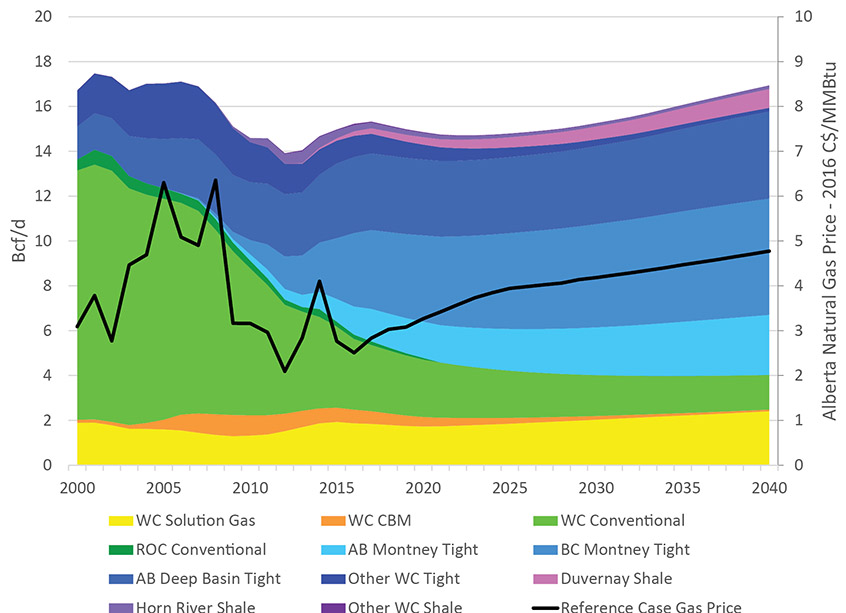
- Canadian gas production has remained steady in the last few years despite declining gas prices since 2014 (Figure 2.1). This was driven by, in part, drilling to evaluate resources that were expected to backstop LNG exports off Canada’s West Coast and because gas-processing plants were added to help debottleneck the gas-gathering system. However, some of this activity is starting to fade and total natural gas production in Canada is expected to decline slightly into 2021. From there, production starts to increase as gas pricesFootnote 1 rise and production from new wells starts to outpace production declines from older wells. Historical production in Canada peaked in 2001 at 495 million cubic metres per day (106m³/d) or 17.5 billion cubic feet per day (Bcf/d); in 2016 production was 431 106m³/d (15.2 Bcf/d) and by 2040 it’s projected to increase by 11% to 480 106m³/d (16.9 Bcf/d).
- Production from the Montney Formation, a large gas resource extending from northeast British Columbia (B.C.) into northwestern Alberta, has grown significantly over the past five years. Production of Montney tight gas increased from no production prior to 2006 to almost 128 106m³/d (4.5 Bcf/d) in 2016, or 30% of total Canadian natural gas production. The majority of Canadian production growth over the projection period comes from the Montney, with its production reaching 223 106m³/d (7.9 Bcf/d) in 2040, a 74% increase from 2016.
- The Alberta Deep Basin – a tight gas play which runs along the Alberta foothills – produced 96 106m³/d (3.4 Bcf/d) in 2016. Production grows modestly as natural gas and natural gas liquids (NGLs) prices increase, reaching 110 106m³/d (3.9 Bcf/d) by 2040.
- The Duvernay and Horn River shale gas plays currently produce small amounts of natural gas; production from both grows modestly over the projection period. The Duvernay is an emerging shale play in Alberta that contains natural gas, NGLs and crude oil. The Horn River in northeastern B.C. is more established, but the formation lacks NGLs, and is currently uneconomic to drill. Combined, production from the two plays increases from 14 106m³/d (0.5 Bcf/d) in 2016 to 28 106m³/d (1.0 Bcf/d) in 2040, with the Duvernay making up 85% of the total in 2040.
- Production from conventional and coalbed methane natural gas resources – which do not rely on horizontal drilling and multi-stage hydraulic fracturing – declines steadily over the projection period as new drilling in them is uneconomic using Reference Case price assumptions. Western Canadian (WC) conventional production – not including solution gas – made up 55% of total production in 2006 and 21% in 2016; it continues declining to 10% in 2040.
- Solution gas production is based on Reference Case oil production from conventional, tight, and shale oil production (More details available here). It increases gradually over the next 25 years, making up 14% of total Canadian production in 2040.
- Production from the Rest of Canada (ROC) is minimal over the projection period and is discussed in more detail in the next section.
Figure 2.1 Reference Case Production and Gas Price
Description:
This graph breaks down the Reference Case projection for Canadian marketable natural gas production by area and type of gas, and also includes the Alberta natural gas price. Western Canada solution gas is projected to increase from 1.87 Bcf/d in 2016 to 2.41 Bcf/d in 2040. Western Canada CBM is projected to decrease from 0.61 Bcf/d in 2016 to 0.07 Bcf/d in 2040. Western Canada conventional is projected to decrease from 3.15 Bcf/d in 2016 to 1.55 Bcf/d in 2040. Rest of Canada conventional production is projected to decrease from 0.19 Bcf/d in 2016 to less than 0.01 Bcf/d by 2040. Alberta Montney tight gas production is projected to increase from 1.25 Bcf/d in 2016 to 2.68 Bcf/d by 2040. British Columbia Montney tight gas production is projected to increase from 3.28 Bcf/d in 2016 to 5.19 Bcf/d in 2040. Alberta Deep Basin tight gas is projected to increase from 3.39 Bcf/d in 2016 to 3.88 Bcf/d in 2040. Other western Canada tight gas is projected to decrease from 0.95 Bcf/d in 2016 to 0.17 Bcf/d in 2040. Duvernay shale gas is projected to increase from 0.2 Bcf/d in 2016 to 0.84 Bcf/d in 2040. Horn River shale gas is projected to decrease from 0.28 Bcf/d in 2016 to 0.15 Bcf/d in 2040. Other western Canada shale gas is projected to decrease from 0.06 Bcf/d in 2016 to 0.01 Bcf/d in 2040. Total Canadian natural gas production is projected to increase from 15.23 Bcf/d in 2016 to 16.94 Bcf/d in 2040. The Alberta natural gas price, in 2016 Canadian dollars per MMBtu, is projected to increase from $2.51 in 2016 to $4.77 in 2040.
2.2 Production by Province
-
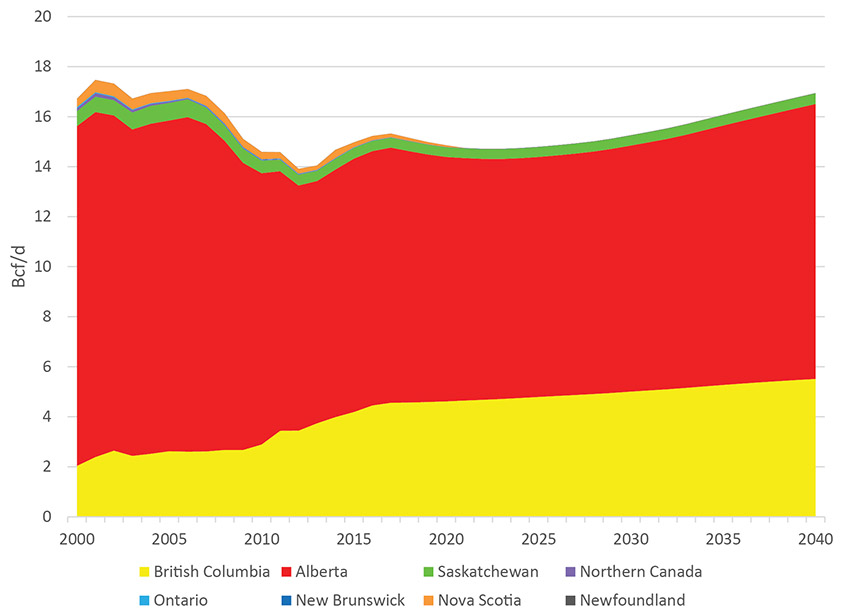
Alberta continues to be the largest natural gas producer, though B.C.’s share increases over the period as Montney production grows (Figure 2.2). Saskatchewan gas production, which is mostly solution gas (see Appendices C1-C6 for gas production by grouping), grows slowly but steadily over the projection period.
Figure 2.2 Reference Case Production by Province
Description:
This graph breaks down the Reference Case projection for Canadian marketable natural gas production by province. British Columbia natural gas is projected to increase from 4.45 Bcf/d in 2016 to 5.51 Bcf/d in 2040. Alberta production is projected to go from 10.17 Bcf/d in 2016 to 10.99 Bcf/d in 2040. Saskatchewan is projected to go from 0.41 Bcf/d in 2016 to 0.43 Bcf/d in 2040. Northern Canada is expected to decrease from approximately 0.01 Bcf/d in 2016 to zero by 2026. Ontario is projected to decrease from approximately 0.01 Bcf/d in 2016 to zero by 2022. New Brunswick is projected to decrease from approximately 0.01 Bcf/d in 2016 to less than 0.01 Bcf/d in 2040. Nova Scotia is projected to decrease from 0.17 Bcf/d in 2016 to zero by 2021. Newfoundland has no marketable natural gas production.
- Natural gas production in Atlantic Canada continues to decline over the projection period. Onshore natural gas production in New Brunswick falls to near zero by 2040. Offshore natural gas production in Nova Scotia is assumed to decline steadily and ceases by 2021 for both the Deep Panuke and Sable projects. Given relatively high costs for offshore exploration and current provincial policies for onshore gas exploration, no new Atlantic Canada gas fields are projected to come online.Footnote 2
- Ontario and northern Canada natural gas production continue to decline over the projection period.
- Significant natural gas resources exist outside western Canada (see section 2.5), but are not projected to be developed over the projection period given economics, distance to markets, drilling moratoriums, and other factors.
2.3 Production by Well Vintage
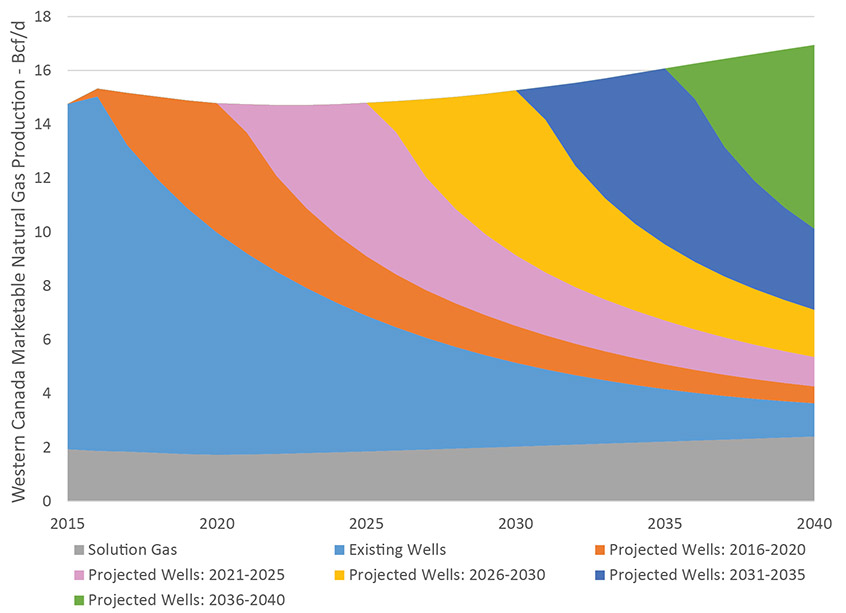
- Figure 2.3 shows production by groups of well years. If no new wells were drilled from 2016 onwards, production would drop to 44 106m³/d (1.2 Bcf/d) by 2040, not including solution gas.
- Production in each of the five-year increments increases over the projection period as gas prices and capital expenditures increase, increasing drill days and wells drilled (see Appendices B1.1 – B1.6 and Appendices B2.1-B2.6 for detailed drill days and wells by year for each grouping).
Figure 2.3 Reference Case Production by Well Vintage
Description:
This graph breaks down the Reference Case projection for Canadian marketable natural gas production by gas well vintages, grouped together in 5 year increments starting in 2015. Solution gas is also included and is projected to increase from 1.93 Bcf/d in 2015 to 2.41 Bcf/d in 2040. Production from all wells drilled before 2016 is projected to decrease from 12.82 Bcf/d in 2015 to 1.23 Bcf/d in 2040. Production from wells drilled from 2016 to 2020 increases from 0.29 Bcf/d in 2016 to 4.80 Bcf/d in 2020, and then decreases to 0.63 Bcf/d in 2040. Production from wells drilled from 2021 to 2025 increases from 1.05 Bcf/d in 2021 to 5.69 Bcf/d in 2025, and then decreases to 1.09 Bcf/d in 2040. Production from wells drilled from 2026 to 2030 increases from 1.15 Bcf/d in 2016 to 6.12 Bcf/d in 2020, and then decreases to 1.75 Bcf/d in 2040. Production from wells drilled from 2031 to 2035 increases from 1.23 Bcf/d in 2031 to 6.54 Bcf/d in 2035, and then decreases to 3.01 Bcf/d in 2040. Production from wells drilled from 2036 to 2040 increases from 1.31 Bcf/d in 2036 to 6.82 Bcf/d in 2040.
2.4 Well Initial Productivity
- Industry focus on deeper resources has increased the average initial production (IP) rate of western Canadian gas wells. The average IP was lowest in 2006 at 0.54 million cubic feet per day (MMcf/d) as many low productivity, shallow wells were being drilled (Figure 2.4). In contrast, the average IP for all wells drilled in western Canada was 2.2 MMcf/d in 2016 – a large jump over the last decade because of increased targeting of deeper resources with horizontal drilling and multi-stage hydraulic fracturing. The average IP over the projection is expected to remain high as operators continue focusing on productive, deeper wells. IPs are also expected to trend slightly upward over the projection: improved drilling and completion technology is expected to more than offset the increased development of non-coreFootnote 3 areas as operators fully develop their core acreage.Footnote 4
Figure 2.4 Western Canada Average Well Initial Production by year
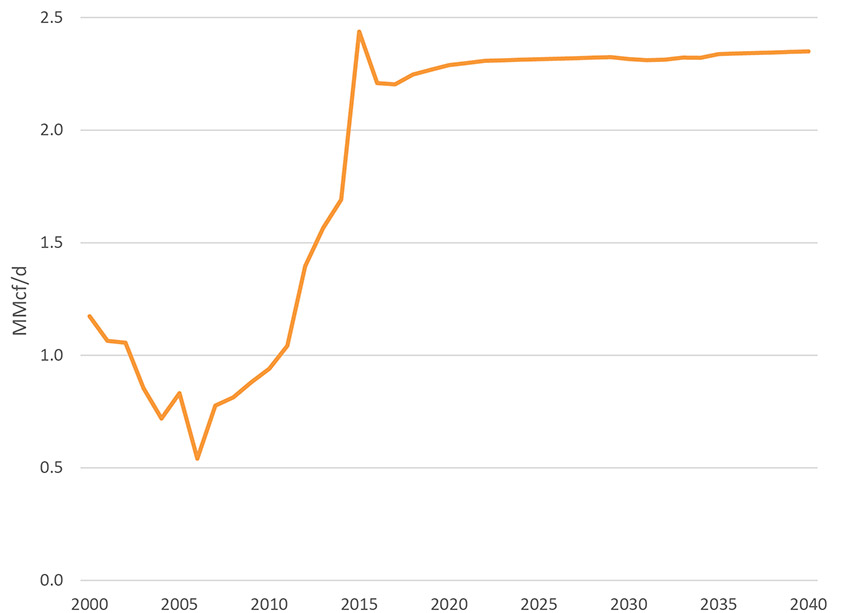
Description:
This graph includes the average initial production rate for all gas wells drilled in western Canada, per million cubic feet per day. The average for wells drilled in 2000 was 1.17. In 2016 the average was 2.21 and is projected to increase to 2.35 in 2040.
2.5 Marketable Natural Gas Resources
- Canada has abundant natural gas resources. With existing technology, the amount of remaining marketable gas available to be developed as of year-end 2016 is estimated at 1 225 trillion cubic feet (Tcf) or over 200 years of supply at current production levels. Canada produces 5.6 Tcf per year. From 2017 to 2040 total production will be 135 Tcf – just 11% of the potential 1 225 Tcf. For the Reference Case, Canadian resources are still projected to contain 1 090 Tcf at the end of 2040, or 196 years of production at 2016 production levels. See the EF2017 Appendices for a breakdown of resource by type of gas and area.
Figure 2.5 Gas Resources versus Projected Production
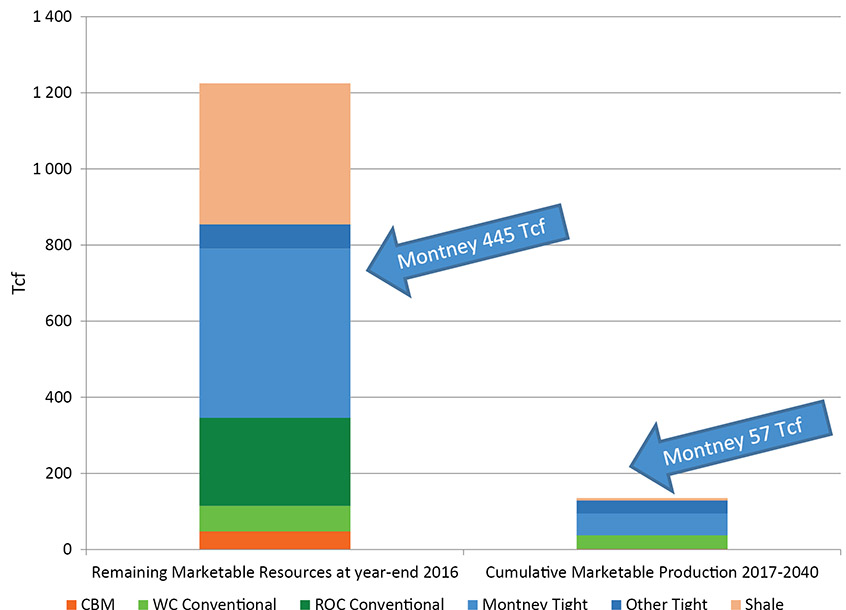
Description:
This chart breaks down the remaining marketable natural gas resources in Canada as of December 31, 2016 and cumulative Canadian marketable natural gas production in the Reference Case by area and type of gas over the projection period from 2017 to 2040. At the end of 2016 there was 47.60 Tcf of remaining marketable CBM resource and 2.06 Tcf are projected to be produced over the projection period. At the end of 2016 there was 66.91 Tcf of remaining marketable conventional gas resource in western Canada and 35.29 Tcf are projected to be produced over the projection period. At the end of 2016 there was 231.65 Tcf of remaining marketable conventional gas resource in the rest of Canada and 0.19 Tcf are projected to be produced over the projection period. At the end of 2016 there was 444.66 Tcf of remaining marketable Montney tight gas and 57.12 Tcf are projected to be produced over the projection period. At the end of 2016 there was 63.70 Tcf of remaining marketable other tight gas in western Canada and 34.35 Tcf are projected to be produced over the projection period. At the end of 2016 there was 370.33 Tcf of remaining marketable shale gas in western Canada and 6.31 Tcf are projected to be produced over the projection period. In all of Canada as of 31 December 2016 there was a total of 1224.85 Tcf remaining marketable natural gas and over the projection period 135.32 Tcf is projected to be produced in the Reference Case.
- Western Canada contains a significant amount of Canada’s natural gas resource. The rest of Canada also has significant resources with the majority located in northern Canada (Figure 2.6).
Figure 2.6 Rest of Canada (ROC) Gas Resources
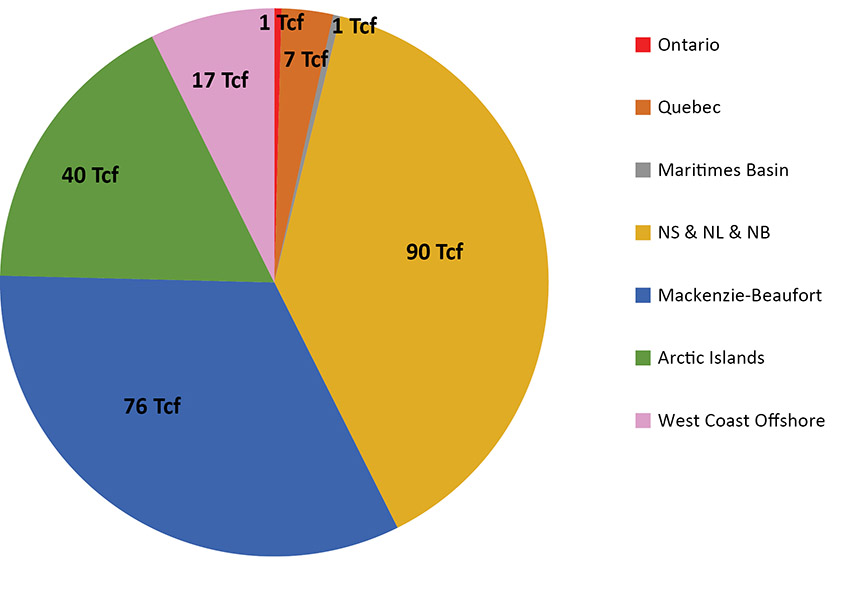
Description:
This chart breaks down the remaining marketable natural gas resources in the rest of Canada by area, as of 31 December 2016. In Ontario there was 0.98 Tcf. In Quebec there was 7.0 Tcf. In the Maritimes Basin there was 1.00 Tcf. In Nova Scotia, Newfoundland and Labrador, and New Brunswick there was 89.67 Tcf. In Mackenzie-Beaufort there was 76.00 Tcf. In the Arctic Islands there was 40.00 Tcf. In West Coast offshore there was 17.00 Tcf.
Chapter 3 – All Cases
- Natural gas production varies between the cases, especially for the High and Low Price cases (Figure 3.1). All cases show the same focus on more economic deep and tight gas resources. The projections for the rest of Canada are the same in all six cases.
- In all cases except for the Low Price Case, production is expected to decline over the short term before eventually increasing from year to year to the end of the projection period. In the Low Price Case, sub-$4 per million British thermal units gas prices do not generate enough capital expenditures to drill sufficient wells for production from new wells to outpace the decline in production from older wells. As a result, total production declines over the entire projection. Production drops to 232 106m³/d (8.2 Bcf/d) in 2040 or to about half the amount of the Reference Case.
- The High Price Case projection reaches 845 106m³/d (29.8 Bcf/d) in 2040, twice as much as the Reference Case. This is largely from a compounding effect over the duration of the projection, where higher prices cause more drilling and more production – which in turn leads to more revenue. These higher revenues generate higher capital expenditures and more drilling and production in subsequent years, and so onFootnote 5. However, this analysis makes the assumption that markets will exist and infrastructure will be built as needed and does not address the question of where this production would be consumed.
- The Higher Carbon Price cases have carbon prices going to $140/tonne in 2016 dollars by 2040 – almost triple that of the other cases’ carbon price of $50/tonne. However, the effect on production is not nearly as much as the effect of the High Price or Low Price assumptions.
Figure 3.1 Gas Price and Production Projections by Case
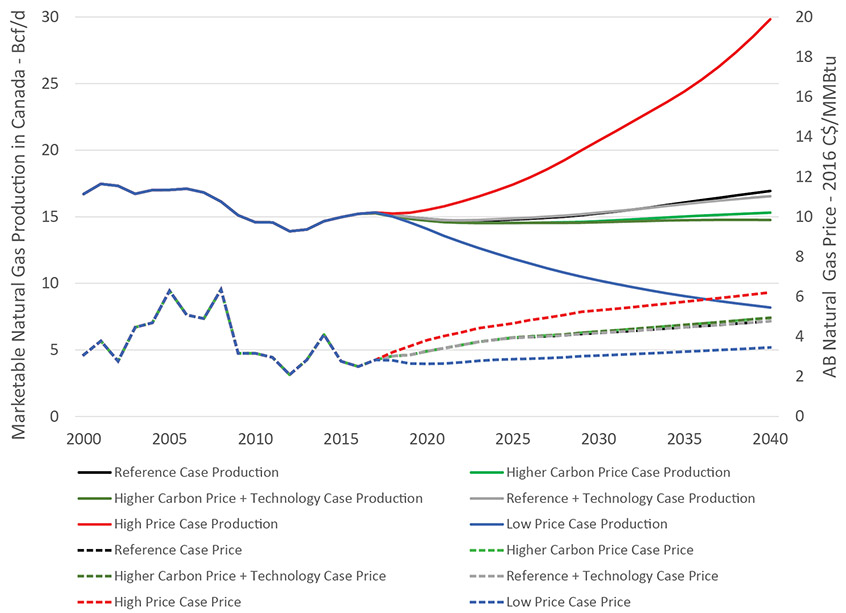
Description:
This graph shows the projections for Canadian marketable natural gas production and Alberta natural gas price for all six cases. The Alberta natural gas price is in 2016 Canadian dollars per MMBtu. In the Reference Case price is projected to increase from $2.51 in 2016 to $4.77 in 2040, and production is projected in increase from 15.23 Bcf/d in 2016 to 16.94 Bcf/d in 2040. In the Higher Carbon Price Case gas price is projected to increase to $4.95 in 2040, and production is projected to increase to 15.31 Bcf/d in 2040. In the Higher Carbon Price and Technology Case gas price is projected to increase to $4.95 in 2040, and production is projected to decrease to 14.76 Bcf/d in 2040. In the Reference and Technology Case gas price is projected to increase to $4.77 in 2040, and production is projected to increase to 16.54 Bcf/d in 2040. In the High Price Case gas price is projected to increase to $6.21 in 2040, and production is projected to increase to 29.84 Bcf/d in 2040. In the Low Price Case gas price is projected to decrease to $3.46 in 2040, and production is projected to decrease to 8.18 Bcf/d in 2040.
- The $50/tonne carbon price works out to a cost of $0.22 per thousand cubic feetFootnote 6 of marketable natural gas produced. However, Reference Case and Higher Carbon Price case gas production projections remain relatively similar (compared to the High and Low price cases), mainly because assumed gas prices for the two cases are the same. The two technology cases (the Higher Carbon Price + Technology case and the Reference Case + Technology case) only consider changes to oil sands production methods, and both use the same gas price assumptions, so their projected gas production are also similar. The only noticeable difference in all these scenarios is solution gas production, because carbon prices were assumed to affect oil prices and oil production through changes in demand (Figure 3.2). The EF2017 Supplement: Conventional, Tight, and Shale Oil Production includes the oil production projections that the solution gas projections are based on.
Figure 3.2 Solution Gas Production Projections by Case
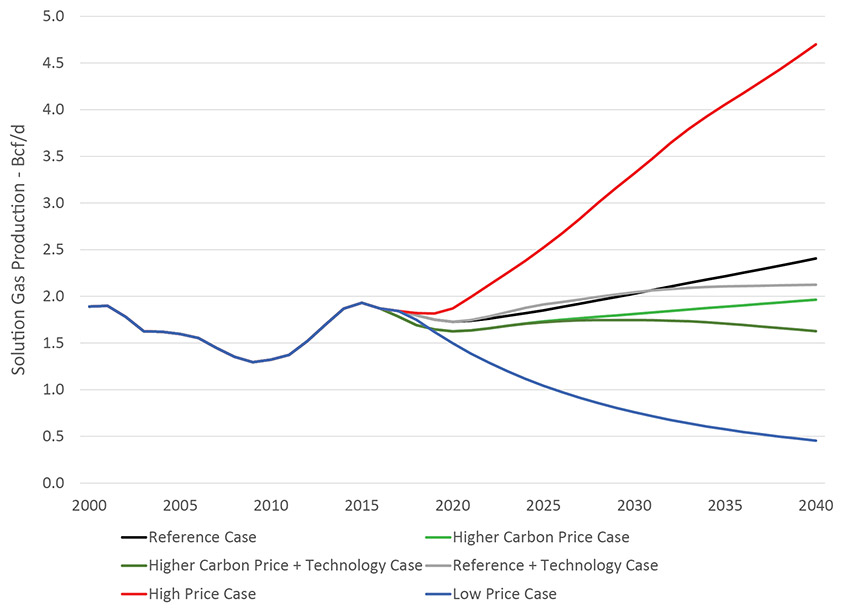
Description:
This graph shows the projections for Canadian marketable solution gas production for all six cases. In the Reference Case production is projected to increase from 1.87 Bcf/d in 2016 to 2.41 Bcf/d in 2040. In the Higher Carbon Price Case production is projected to increase to 1.97 Bcf/d in 2040. In the Higher Carbon Price and Technology Case production is projected to decrease to 1.63 Bcf/d in 2040. In the Reference and Technology Case production is projected to increase to 2.12 Bcf/d in 2040. In the High Price Case production is projected to increase to 4.70 Bcf/d in 2040. In the Low Price Case production is projected to decrease to 0.46 Bcf/d in 2040.
Chapter 4 – Final Thoughts
- This analysis assumes that over the long term, all energy production will find markets and infrastructure will be built as needed. However, a lack of markets for Canadian natural gas production could reduce the prices Canadian producers receive relative to the Henry Hub price and impact gas production trends.
- These projections describe what is possible today given price, economics, technology, geology, and other assumptions. Actual production could be different given other unforeseen factors like demand, weather, processing plant outages, etc.
- Gas production depends on price, but also on recovery technology and drilling efficiency and costs. Should technology or costs advance differently than assumed, capital expenditures and well production projections would be different than modelled here.
- Canada has abundant natural gas resources.
- Date modified: