Scenarios and Assumptions
On this page:
This chapter describes the premise of the three scenarios in EF2023. We also describe the assumptionsFootnote 2 of those scenarios.
Scenario premise
EF2023 analyzes three scenarios: the Global Net-zero Scenario, the Canada Net-zero Scenario, and the Current Measures Scenario. All three scenarios provide projections for all energy commodities and all Canadian provinces and territories. We developed these scenarios to explore questions that are relevant to the current Canadian energy dialogue, and to depict a range of potential outcomes for the future.
The premise of each scenario differs based on:
- The pace of climate action in Canada (including whether Canada must achieve net-zero emissions by 2050).
- The pace of climate action in the rest of the world.
Both the Global and Canada Net-zero scenarios share the premise that the future pace of climate action in Canada is consistent with Canada reaching net-zeroFootnote 3 greenhouse gas (GHG) emissions in 2050. Simply put, a key outcome of these scenarios is predetermined: the level of GHG emissions in 2050. We then rely on our energy and economy models to project a pathway for the energy system that is consistent with this outcome.
In the Current Measures Scenario, there is no additional action to reduce GHGs beyond those in place today. In this scenario, we do not require our modeling results to achieve net-zero GHG emissions in Canada by 2050.
Global climate action affects Canada’s energy system
While the pace of domestic climate action is a key part of our scenarios, the pace of action outside of Canada is also important. As a trading nation, what happens globally affects Canada’s economy and energy system. EF2023 focuses on Canada, and we do not model global energy markets. Instead, international factors relevant to the Canadian energy outlook are assumptions, or inputs, that we put into our models. Examples include global prices for crude oil and natural gas, and costs for many low-carbon technologies.
While both net-zero scenarios share the same overall premise for achieving net-zero in Canada, they differ based on the pace of global climate action. The Global Net-zero Scenario is based on rapid global climate action: a pace consistent with the world achieving the Paris Agreement goal of limiting warming to 1.5°C, compared to pre-industrial levels. In the Canada Net-zero Scenario, the pace of global climate action increases, but not as quickly. Global action in the Current Measures Scenario is the slowest, with limited future global action beyond policies in place today.
The IEA’s global outlook is our primary source for international assumptions
The primary source for international assumptions in the Global and Canada Net-zero scenarios is the International Energy Agency’s (IEA) World Energy Outlook 2022 (WEO2022). Much like the CER’s Canada’s Energy Future report, the IEA’s energy outlook contains multiple long-term scenarios.
Published in October 2022, WEO2022 provides robust and transparent projections. Relying on this analysis for the international perspective in EF2023 ensures our assumptions reflect recent international trends and events, including the impact of the Russian invasion of Ukraine on the global energy system.
While the IEA does model Canada, we do not rely on those results in EF2023. Rather we use the IEA’s projections of key global variables (such as the global crude oil price) as assumptions in EF2023. We describe the specific assumptions we draw from the WEO2022 in the following section, Key Assumptions.
The Global Net-zero Scenario uses assumptions from the IEA’s Net Zero Emissions by 2050 Scenario
In our Global Net-zero Scenario, we use the IEA’s Net Zero Emissions by 2050 Scenario from WEO2022 as a source for many assumptions. This scenario is described by the IEA as “consistent with limiting the global temperature rise to 1.5°C without a temperature overshoot (with a 50% probability).” As a result, the scenario provides a good basis for ensuring our Global Net-zero Scenario reflects rapid global action to reduce GHG emissions.
The principles of the IEA’s Net Zero Emissions by 2050 Scenario are summarized below:
- The uptake of all the available technologies and emissions reduction options is dictated by costs, technology maturity, policy preferences, and market and country conditions.
- All countries co‐operate towards achieving net‐zero emissions worldwide.
- An orderly transition across the energy sector, ensuring the security of fuel and electricity supplies at all times.
The Canada Net-zero Scenario uses the IEA’s Announced Pledges Scenario for its international assumptions

The Announced Pledges Scenario includes all the climate commitments and longer-term targets made by governments around the world and assumes that they will be met in full and on time. It covers net-zero by 2050 targets from Canada, the United States, the European Union, and others. It also includes targets such as China’s goal to achieve carbon neutrality before 2060, and India’s goal to reach net-zero by 2070.
The IEA’s Announced Pledges Scenario models increasing global climate action but is unlikely to limit the global temperature rise to 1.5°C. According to the IEA, the global GHG emissions resulting from this scenario would cause a temperature rise of around 1.7°C by 2100. The premise of the Canada net-zero Scenario is aligned with the Announced Pledges Scenario, with slower climate action outside of Canada than in the Global Net-zero Scenario.
The Current Measures Scenario uses other sources for international assumptions
The international assumptions of the Current Measures Scenario are not from the WEO2022. Instead, we review global scenario analysis produced by institutions, academia, industry, private forecasters, and other relevant energy analysis, to develop our own assumptions.
Figure A.1 summarizes, at a high-level, the premise of the CER’s scenarios, and how they relate to the assumptions in EF2023. The following section, Key Assumptions, describes the assumptions in detail.
Figure A.1: Scenarios and assumptions

Description
Description: This figure provides an overview of the three scenarios in EF2023, including a breakdown of their respective assumptions. These scenarios are the Global Net-zero Scenario, the Canada Net-zero Scenario, and the Current Measures Scenario. It shows that in the net-zero Scenarios, climate policies increase in strength to achieve net-zero GHG emissions in Canada by 2050, while the Current Measures scenario includes limited future action to reduce GHG emissions and no requirement to hit net-zero. It also shows that the pace of global climate action differs between the three scenarios. The Global Net-zero scenario has a rapid pace, consistent with limiting warming to 1.5 degrees C. The Canada Net-zero Scenario has an increasing pace, but insufficient to limit warming to 1.5 degrees C. The Current Measures scenario has limited future actions to reduce GHG emissions globally.
The figure then shows what this means for the assumptions in each scenario in EF2023:
Domestic climate policies:
- Both net-zero scenarios: Canadian climate policies increase in strength to achieve net-zero GHG emissions in Canada by 2050.
- Current Measures Scenario: Only climate policies that are currently in place
Technology:
- Global Net-zero Scenario: Adoption of low carbon technologies accelerates, which leads to cost reductions and efficiency improvements of technologies
- Canada Net-zero Scenario: Adoption of low carbon technologies accelerates. Costs fall and efficiency improves, but less so than in the Global Net-zero Scenario.
- Current Measures Scenario: Limited global climate action reduces incentives to progress low-carbon technologies.
International Crude Oil Markets:
- Global Net-zero Scenario: Global climate action increases rapidly. Global crude oil demand and crude oil prices, fall dramatically.
- Canada Net-zero Scenario: Global climate action increases, but less quickly. Global crude oil demand and crude oil prices fall, but less than in the Global Net-zero Scenario.
- Current Measures Scenario: Global climate action remains at current levels. Global crude oil demand and prices are the highest among the three scenarios.
International Natural Gas Markets:
- Global Net-zero Scenario: Global climate action increases rapidly. Global natural gas demand, and natural gas prices, fall, though less steeply than crude oil.
- Canada Net-zero Scenario: Global climate action increases, but less quickly. Global natural gas demand, and natural gas prices fall, but less than in the Global Net-zero Scenario.
- Current Measures Scenario: Global climate action remains at current levels. Global natural gas demand and prices are the highest among the three scenarios.
Different global scenarios modeling a net-zero world
For the Global Net-zero Scenario in EF2023, we rely on the IEA’s Net Zero Emissions by 2050 Scenario as a source for international assumptions. We also rely on the IEA’s Announced Pledges Scenario in our Canada Net-zero Scenario. The IEA is an autonomous inter-governmental organization within the Organisation for Economic Co-operation and Development framework. Canada is one of 31 full member countries of the IEA.
We chose this approach because the IEA’s global energy outlooks are among the most authoritative analyses of the global energy system. The World Energy Outlook series is publicly available, transparent about its assumptions and modeling approach, and provides significant context to accompany the results. Nearly all of the variables we require for the international assumptions in our own modeling exercise, such as crude oil and natural gas prices and technology costs, are readily available.
Other global outlooks were considered for EF2023
There are other energy outlooks that include global net-zero pathways that we considered but ultimately did not use in EF2023. Choosing a different global scenario to rely on would have resulted in different assumptions and outcomes in EF2023. Other global outlooks include the International Renewable Energy Agency World Energy Transitions Outlook, BP Energy Outlook, Shell Scenarios and Platts Future Energy Outlooks.
In addition, as part of the Intergovernmental Panel on Climate Change’s (IPCC) Sixth Assessment Report (AR6), authors collected and assessed model-based scenarios related to climate change mitigation. The collection of these scenarios is referred to as the AR6 Scenarios DatabaseFootnote 4.
The IEA’s outlook compared to other global pathways to net-zero
WEO2022 provides a comparison between the 16 IPCC scenarios that are comparable with the Net Zero Emissions by 2050 Scenario outcome of net-zero emissions from the global energy system. It indicates that the IEA’s scenario has lower total energy demand (due to efficiency and electrification), higher wind and solar electricity generation, and higher hydrogen consumption compared to many of the IPCC scenarios. It also shows that the Net Zero Emissions by 2050 Scenario has lower levels of bioenergy, carbon capture, utilization, and storage (CCUS)Definition*, and energy-related carbon dioxide removals than most of the IPCC scenarios. This does not indicate that the IEA, IPCC or any other scenarios are more reasonable but rather that there is a range of global pathways consistent with limiting warming to 1.5°C.
In addition to the three main scenarios in EF2023, you will find five cases in this report that ask: “What if?” There are many uncertainties on the pathway to net-zero. These cases explore some of them by changing key assumptions in EF2023 and showing what it could mean for Canada’s pathway to net-zero:
- What if the technologies to enable wide-scale adoption of hydrogen are more or less costly?
- What if small modular reactor (SMR) technology matures less quickly and is more costly?
- What if DAC technology matures more quickly and is less costly?
- What if CCUS technology does not mature as quickly and is more costly?
- What if electricity vehicle charging patterns result in higher peak electricity demand?
We chose these questions based on the magnitude of the impact these factors could have on the pathway to net-zero, and the level of uncertainty about their future.
Why do we do scenario analysis?
EF2023, and most previous versions of the report, contain multiple scenarios. Scenario analysis is common in most long-term energy outlooks.
We do scenario analysis to explore uncertainties facing the future of the energy system. The results in EF2023 are not predictions about the future. Rather, they are the product of scenarios based on a premise and a certain set of assumptions. Relying on just one scenario to understand the energy outlook implies too much certainty about what could happen in the future.
The scenarios in EF2023 explore uncertainty about the future pace of climate action in Canada and around the world. Past versions of the report explored this and other areas of uncertainty using scenarios. Past scenarios focused on energy infrastructure developments, energy prices, economic growth, and technological progress.
While scenarios provide a range of potential outcomes for the future, they are also useful to compare against one another. The similarities and differences across the scenarios often provide more useful insights than a single scenario in isolation.
Key Assumptions
All dollar figures throughout the report are in Canadian dollars unless stated otherwise.
Domestic climate policy
Domestic climate policies include laws, regulations, and programs put in place by governments with the goal of reducing GHG emissions. Such policies can affect the trajectory of Canada’s energy system. We make assumptions about the climate policies we model in each scenario in EF2023. This section outlines some of the key policies we include. Additional details are available in Appendix 1: Domestic Climate Policy Assumptions.
Domestic climate policies in the Current Measures Scenario
Federal, provincial, and territorial climate policies that are currently in place are the basis of the Current Measures Scenario. A policy is “in place” if it was enacted prior to March 2023. We do not include announced policies that are not yet implemented in the Current Measures Scenario.
The Canadian Net-Zero Emissions Accountability Act (CNZEAA) enshrines in legislation the Government of Canada’s commitment to achieve net-zero GHG emissions by 2050. The CNZEAA does not contain mechanisms that directly influence the energy system like a more typical climate policy might, rather it provides a framework of accountability and transparency to deliver on Canada’s climate commitments. The Current Measures Scenario does not model the CNZEAA.
Carbon pricing in EF2023
Pricing carbon pollution is a key existing climate policy in Canada. Canada’s carbon pricing approach allows provinces and territories to choose their own system to price carbon pollution, or to rely on the federal pricing system. The federal pricing system is comprised of two parts, a regulatory charge on fossil fuels like gasoline and natural gas, called the fuel charge, and a performance-based system for industries, called the Output-Based Pricing System. Provinces and territories that develop their own systems must meet minimum national stringency criteria set by the federal government to ensure consistency and fairness. In all instances, mechanisms for allocating proceeds from carbon pricing continue as outlined by provinces or territories in their own systems, or as defined in the federal system. All revenue from the federal carbon pricing system is returned to the provinces and territories where they are collected.
In all three scenarios, we assume that existing provincial and territorial carbon pricing systems remain in place. Prices in all jurisdictions increase from current levels by $15 per tonne of carbon dioxide equivalent (CO2e) per year to reach $170 per tonne by 2030. We describe our assumptions about how we model the cost of carbon between 2030 and 2050 later in this section.
Carbon pricing and mitigating economic competitiveness risks
How we apply carbon pricing to large industrial emitters differs between scenarios. This difference ensures consistency with each scenario premise. A key difference between all three scenarios is the level of future climate action outside of Canada. This can influence the design of carbon pricing systems. When some countries are not moving as quickly as Canada to reduce GHG emissions, there is a risk that some industries in those countries have an economic advantage over competitors in Canada. There is also a risk some industrial facilities may move from Canada to another country to avoid paying a price on carbon pollution; this migration is often called carbon leakage.

The federal and provincial carbon pricing systems have mechanisms to mitigate these risks. Under the federal system, this mechanism is referred to as the Output-Based Pricing System. This performance-based system is designed to create a financial incentive for industries to reduce emissions but also reduce the risk of carbon leakage and adverse competitiveness impacts due to domestic carbon pricing. Industry-specific benchmarks (output-based standards) are used to determine the amount of carbon price owed. Instead of paying the fuel charge on fuels that they use, facilities must provide compensation for emissions above an emissions limit, calculated by multiplying relevant output-based standards and the quantity of product produced.
We assume that in the Global Net-zero Scenario, the Output-Based Pricing System, and provincial mechanisms to mitigate the risks of competitiveness impacts and carbon leakage, phase out completely by 2050. In the Canada Net-zero Scenario, slower global action implies that competitiveness could still be a concern. As a result, we assume these mechanisms remain in place but the benchmarks for determining the emission limits decline steadily over the projection period. In the Current Measures Scenario, these emission limits remain at their current levels over the projection period.
Domestic climate policies in the Global and Canada Net-zero scenarios
The Global and Canada Net-zero scenarios include all in-place federal, provincial, and territorial climate policies. Both net-zero scenarios also include all announced but not-yet-implemented policies, to the extent possible. We applied the following criteria to determine whether an announced policy was included in our analysis:
- The policy was announced prior to March 2023.
- Sufficient details exist to model the policy.
The federal government made several key climate policy announcements that it is working to implement, including:
- Clean Electricity Regulations – regulations to reduce GHG emissions from the generation of electricity to help work towards a net-zero electricity supply by 2035.
- Oil and Gas Emissions Cap – regulations to reduce GHG emissions from the oil and gas sector at a pace and scale necessary to achieve Canada’s 2030 and 2050 climate targets.
- Light-duty Zero Emission Vehicle (ZEV) Sales Mandate - a mandatory 100% zero-emission vehicle sales target by 2035, including interim targets of at least 20% by 2026 and at least 60% by 2030.
- A 75% reduction in oil and gas sector methane emissions relative to 2012 levels by 2030 - regulations and other measures needed to achieve at least a 75% reduction in methane emissions from the oil and gas sector from 2012 levels by 2030.
- Investment Tax Credit for Clean Hydrogen – a tax credit to support investments in clean hydrogen production.
These and other announced but not-yet-implemented policies are modeled in both net-zero scenarios. Final details of some of these policies were not available at the time of analysis. We include these policies by relying on assumptions about those policies as necessary.
In some cases, we strengthen existing and announced policies beyond what is specified in a policy or regulation. For example, the Clean Fuel Regulations require the emission intensity of certain fuels for sale in Canada to decline by a specific rate until 2030. We continue emission intensity reductions as if the policy continued to increase in strength beyond 2030.
Finally, to ensure the Global and Canada Net-zero scenarios achieve net-zero by 2050, we rely on some hypothetical policies in the 2030 to 2050 period. The following section, Modeling Net-zero and Future Climate Policy Assumptions describes this approach.
Assumptions regarding future policies in EF2023 are meant to be illustrative and represent a stylized future policy environment. Our assumptions are not policy recommendations for governments. In developing future policies, governments will consider economic, social, legal, jurisdictional (both within and outside of Canada), and other factors.
Table A.1 describes the key policy assumptions in EF2023. Further details on these and other policies is available in Appendix 1: Domestic Climate Policy Assumptions.
Table A.1: Overview of domestic climate policy assumptions
| Policies currently in place These policies are the basis of the Current Measures Scenario and are also included in the Global and Canada Net-zero scenarios. |
|
|---|---|
| Policy | Description |
| Carbon pricing | Current provincial and territorial pricing systems, as well as the federal carbon pricing backstop. |
| Methane regulations | Federal and provincial regulations applying to methane, including federal regulations for the upstream oil and gas sector aimed at reducing emissions by 40% from 2012 levels by 2025. |
| Investment tax credit for carbon capture, utilization, and storage | A federal investment tax credit for CCUS projects that permanently store captured carbon dioxide (CO2) in geological storage or in concrete. |
| Investment tax credit for clean technologies | A federal investment tax credit for electricity generation systems, stationary electricity storage systems, low-carbon heat equipment, and industrial zero-emission vehicles and related infrastructure. |
| Clean fuel regulations | A performance-based supply standard requiring suppliers of gasoline and diesel to reduce the lifecycle carbon intensity of their fuels. |
| Coal phase-out | Traditional coal-fired generation is phased out of electricity generation by 2030. |
| Energy efficiency regulations | Current federal and provincial regulations on energy efficiency for appliances, heating and cooling equipment, building codes, and vehicles. |
| Zero-emissions vehicle subsidies | Current federal and provincial subsidies on zero-emission vehicles. |
| Renewable fuels | Current provincial and federal regulations for blending biodiesel, ethanol, hydrogenation-derived renewable diesel, and renewable natural gas. |
| Announced policies that are not yet implemented These policies are included in the Global and Canada Net-zero scenarios but not the Current Measures Scenario. |
|
| Policy | Description |
| Clean electricity regulations | Federal regulations to reduce GHG emissions from the generation of electricity to help work towards a net-zero electricity supply by 2035. |
| Zero-emission vehicle mandate | A federal zero-emission vehicle (ZEV) mandate is introduced in 2025, rising to 100% of new light duty vehicle sales by 2035 in the provinces. New heavy duty vehicle sales rise to 100% ZEV where feasible by 2040. |
| National net-zero emissions building strategy | Increase energy efficiency of new and existing buildings out to 2050. |
| Oil and gas emissions cap | Regulations to reduce GHG emissions from the oil and gas sector at a pace and scale necessary to achieve Canada’s 2030 and 2050 climate targets. |
| Methane regulations | Methane emissions from the upstream oil and gas sector are reduced by 40% by 2025 from 2012 levels and 75% by 2030. |
| Carbon pricing | See the following section, “Modeling net-zero and Future Climate Policy Assumptions.” |
Modeling net-zero and future climate policy assumptions
A requirement of the Global and Canada Net-zero scenarios is that Canada reaches net-zero GHG emissions by 2050. In the net-zero scenarios in EF2023, we begin with the end goal in mind: net-zero GHG emissions in 2050, and use our models to identify a pathway to that point. This is a different approach compared to past versions of this report. Previously, we ran our models without restrictions, giving us insights into what a given premise and set of assumptions meant for the future.
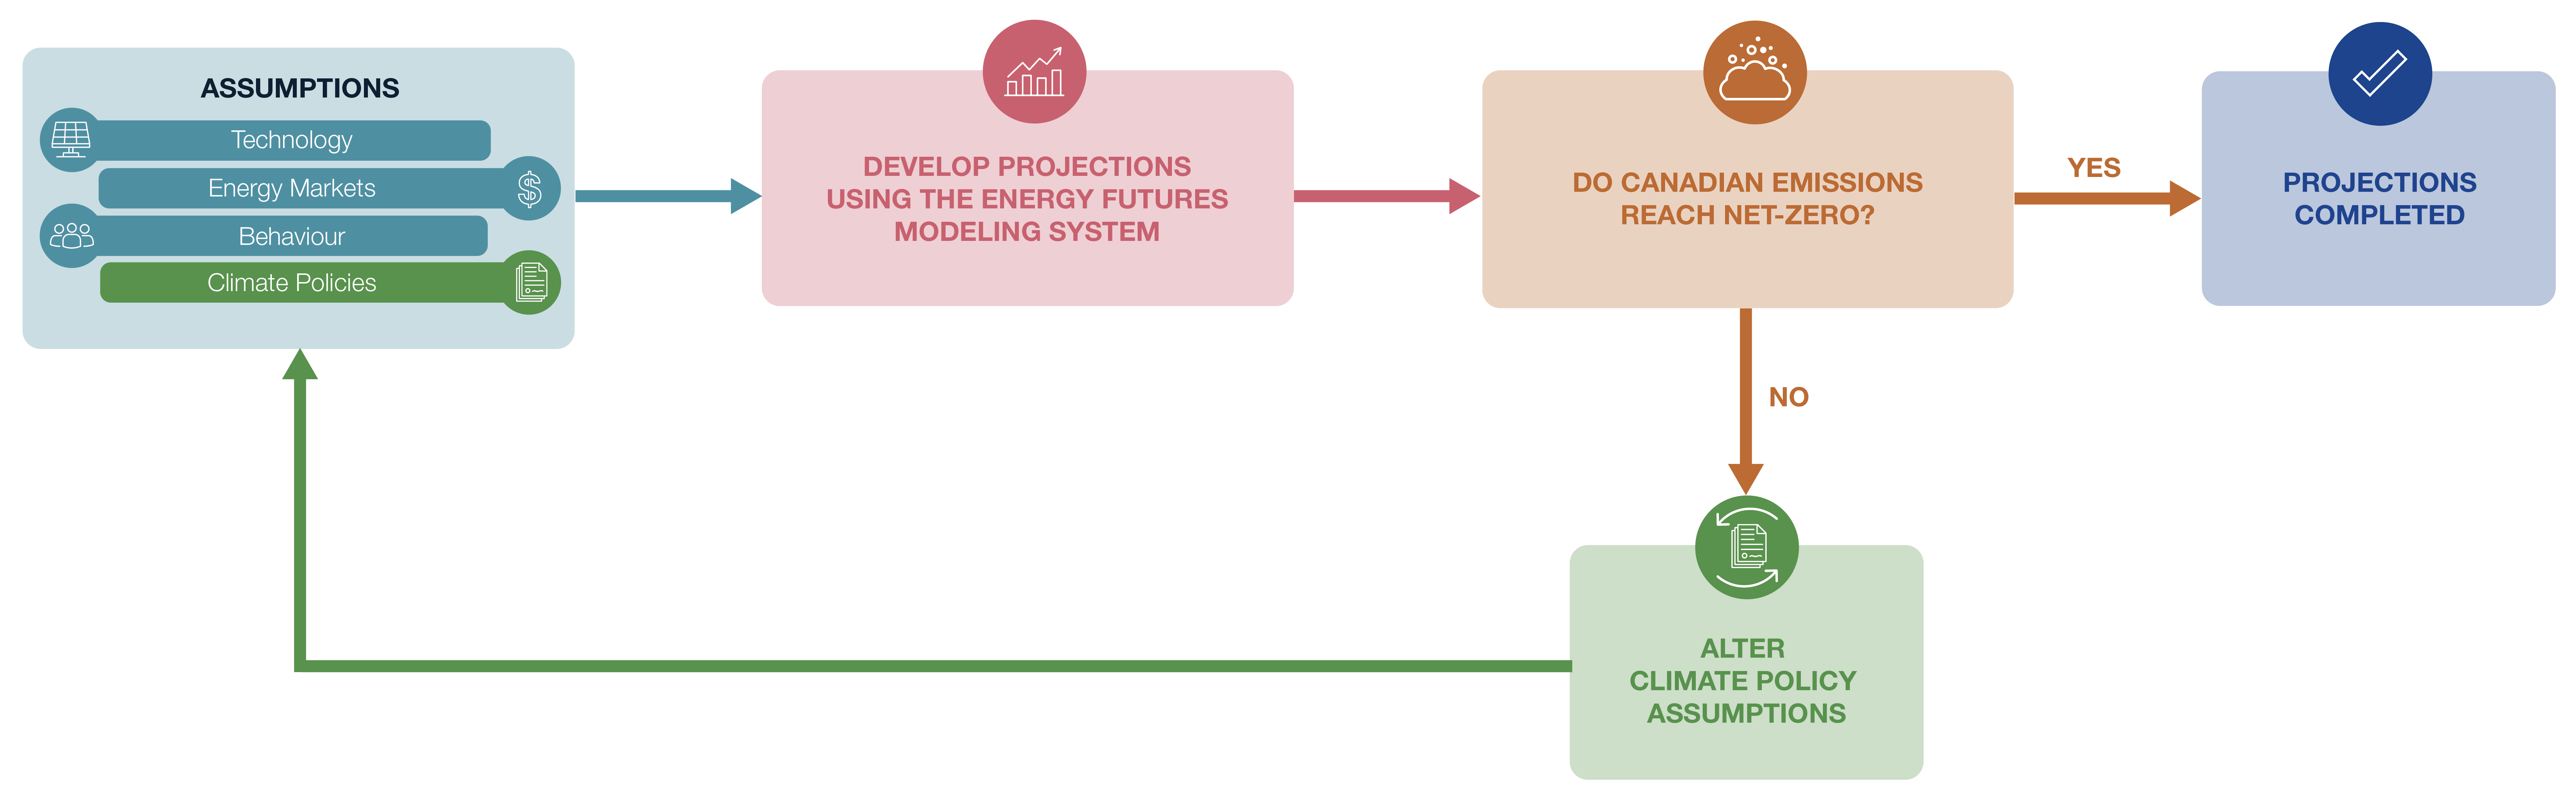
To reach net-zero, we take an iterativeDefinition* approach
This approachFootnote 5 begins with running the Energy Futures Modeling System with an initial set of assumptions. Once complete, we look at the resulting GHG emissions in 2050. If our projections do not result in net-zero emissions by 2050, we alter our hypothetical future climate policy assumptions and re-run our models. With each additional model run, we alter the policy assumptions, resulting in higher or lower GHG emissions. We repeat this process until the outcome of the model is consistent with net-zero GHG emissions by 2050. Other assumptions, such as those on technologies, international markets, and behaviour, remain constant. Figure A.2 shows this process.
Figure A.2: Simplified iterative approach to modeling net-zero in the Global and Canada Net-zero scenarios
Description
Description: This figure shows the EF2023 approach to modeling in the Global and Canada Net-zero scenarios. Specific assumptions about technology, energy markets, behaviour and climate policies are used to develop projections using the Energy Futures modeling system. If the output doesn’t lead to Canada reaching net-zero emissions by 2050, the climate policy assumptions are incrementally altered until the projections reach net-zero.

The main driver of our models reaching a net-zero emissions outcome is what we refer to as the “aggregate cost of carbon.” The aggregate cost of carbon represents the hypothetical suite of policies, regulations, and programs, that we assume in the 2030 to 2050 period. In practical terms, to implement this in the Energy Futures Modeling System, we rely on a hypothetical economy-wide carbon price to represent the aggregate cost of carbon. This choice is solely for technical modeling purposes. It is likely that future climate policy in Canada, like it is today, will be a diverse mix of tools to reduce emissions. Our assumptions are not policy recommendations for governments. In addition, these assumptions are not an estimate of what future carbon prices are necessary to achieve net-zero, but instead a modeling technique we use to explore potential net-zero outcomes.
The aggregate cost of carbon resulting from the iterative process shown in Figure A.2 increases steadily from $0 per tonne of carbon dioxide equivalent (CO2e) in 2030 to 2022$330 per tonne of CO2e in 2050 in inflation adjusted terms in the Global Net-zero Scenario, and to 2022$380 per tonne of CO2e in the Canada Net-zero Scenario. In both net-zero scenarios, this is in addition to the federal backstop carbon price of $170 per tonne of CO2e in 2030 to 2050 (or 2022$95 per tonne of CO2e in inflation-adjusted terms by 2050), as well as all in-place federal, provincial, and territorial climate policies and the announced but not-yet-implemented policies that we model in our analysis.
Technology
To model Canada’s energy system, we make assumptions about a wide variety of technologies that use or produce energy. These range from well-established technologies (like refrigerators, furnaces, and wind turbines) to those under development or not yet widely used (like heat-pumps,Definition* small modular reactors (SMRs),Definition* and DACDefinition* processes). We make assumptions about the current and future costs, performance, and efficiency of technologies.
Energy technology development and the pace of climate action are related

Climate policies drive technological innovation and create markets for low-carbon technologies. This innovation and market development can result in lower costs and better performance. The difference in global climate action in our three scenarios means we make different assumptions about technology in each scenario.
The Global and Canada Net-zero scenarios assume continued technological progress, including commercialization of many emerging technologies that can support a net-zero future. Both scenarios rely on the IEA’s scenarios for many of the technology assumptions, where clean energy technologies generally get progressively less costly over time. The pace of this cost decline varies by scenario. In the IEA’s analysis, the more households and businesses use a technology, the more its cost tends to decline. This means that technology costs decline the most in the Global Net-zero Scenario because it draws its technology assumptions from the IEA’s Net Zero Emissions by 2050 Scenario, which is the most ambitious scenario in WEO2022. The cost declines in the Canada Net-zero Scenario are somewhat slower, as that scenario relies on the IEA’s Announced Pledges Scenario, which has somewhat slower global climate action. The Current Measures Scenario has the slowest pace of technological development.
Figure A.3 provides an example of the cost declines for some of the technologies in the Global Net-zero Scenario.
Figure A.3: Capital cost trends for select technologies, Global Net-zero Scenario

Description
Description: This line chart shows the evolution of capital cost trends for key technologies over the projection period in the Global Net-zero Scenario, starting with 2021=1 as the index. The key technologies are air source heat pump, direct air capture, solar, batteries, hydrogen electrolysis, and wind.
All technologies see a gradual decline in capital cost over the projection period. Hydrogen electrolysis sees the steepest decline by 2050, followed by air source heat pump and solar.
Critical minerals are key to low-carbon energy deployment
All assumptions in EF2023 have a degree of uncertainty associated with them. How much different technologies eventually cost will likely differ from what we assume in this report. A key factor affecting many low-carbon technologies is the cost of inputs to manufacture those technologies, including critical minerals. In its WEO2022 report, the IEA notes that the increasing use and importance of critical minerals could become a bottleneck for clean energy deployment. For more information on the impact of critical minerals on the Canadian energy outlook, see the text box: “Critical Minerals and the Energy Transition” in EF2021, or the CER’s Market Snapshot “Critical Minerals are Key to the Global Energy Transition”.
Table A.2 describes many of the technology assumptions in EF2023 in all three scenarios. Further details on these and other technologies is available in Appendix 2: Technology Assumptions.
Table A.2: Overview of technology assumptionsTable Note a
| Technology | Global Net-zero | Canada Net-zero | Current Measures |
|---|---|---|---|
| CCUS | Capture costs are different by industry and range from $45-200/tCO2 by 2030 and $30-160/tCO2 from 2030-2050. | Capture costs are different by industry and range from $45-200/tCO2 by 2030 and $ 30-160/tCO2 from 2030-2050. | Capture costs are different by industry and range from $45-200/tCO2 through the projection period. |
| Battery-electric passenger vehicles | Cost declines 30% by 2030 and 38% by 2050. | Cost declines 28% by 2030 and 36% by 2050. | Cost declines 26% by 2030 and 33% by 2050. |
| Medium and heavy-duty freight vehicles | Battery-electric and fuel cell truck costs fall steadily, approaching parity with diesel vehicles in 2035-2050 period. | Battery-electric and fuel cell truck costs fall steadily, approaching parity with diesel vehicles in 2035-2050 period. | Battery-electric and fuel cell truck costs remain near current levels. |
| Heat pumps | Cost declines 15% by 2030 and 40% by 2050. | Cost declines 13% by 2030 and 34% by 2050. | Cost declines 7% by 2030 and 20% by 2050. |
| Wind electricity | Capital cost declines 13% by 2030 and 17% by 2050. | Capital cost declines 10% by 2030 and 16% by 2050. | Capital cost declines 9% by 2030 and 15% by 2050. |
| Solar electricity | Capital cost declines 44% by 2030 and 60% by 2050. | Capital cost declines 44% by 2030 and 60% by 2050. | Capital cost declines 40% by 2030 and 57% by 2050. |
| Direct Air Capture (DAC) | Capture cost declines to $330/tCO2 by 2035 and $230/tCO2 by 2050. | Capture cost declines to $350/tCO2 by 2035 and $250/tCO2 by 2050. | Capture cost remains at $400-450/tCO2 over projection period. |
| Hydrogen electrolyzer | Capital cost declines 80% by 2030 and 84% by 2050. | Capital cost declines 74% by 2030 and 82% by 2050. | Capital cost declines 62% by 2030 and 70% by 2050. |
Crude oil and natural gas markets
Global crude oil and natural gas prices are a key driver of the Canadian energy system and are determined by supply and demand factors beyond Canada’s borders. The CER does not model international energy markets. Instead, we rely on other sources of information, including the analysis of others, to develop assumptions on factors like crude oil and natural gas prices. As we describe later in this section, we rely on IEA’s WEO2022 projections for key inputs in both of our net-zero scenarios.
Global crude oil prices were volatile over the past few years

After averaging around US$60 per barrel (bbl) from 2017 to 2019, the annual average price for BrentDefinition* crude oil fell to US$42/bbl in 2020. This price decreased largely because the COVID-19 pandemic reduced business activity, commuting, shipping, and travel, reducing global demand for oil-based products like gasoline, diesel, and jet fuel. Beginning in 2021, prices began to steadily increase, as consumption of these products rebounded when many countries eased pandemic restrictions. Meanwhile, oil producers were slow to increase investment from 2020 levels, meaning there was less new oil production to supply growing demand. Price increases accelerated in early 2022 when Russia invaded Ukraine and countries around the world sanctioned Russia’s energy exports, increasing demand for non-Russian oil. The price for Brent crude oil rose above US$100/bbl for several months in 2022 before declining to closer to US$80/bbl late in the year.
North American natural gas prices followed similar trends to crude oil
From 2017 to 2019, the Henry Hub natural gas price was stable around US$3.00 per million British thermal units (MMBtu). With the onset of the COVID-19 pandemic, the price fell, averaging just over US$2.00/MMBtu in 2020. Like crude oil, natural gas prices increased through 2021 and 2022, at first because many countries eased pandemic restrictions and then because natural gas producers were slow to ramp up investment levels as demand increased. Then Russia invaded Ukraine, increasing demand for non-Russian natural gas around the world, especially liquefied natural gas (LNG) from markets like the United States. Henry HubDefinition* natural gas prices averaged US$8.81/MMBtu in August 2022, the highest monthly average since July 2008. By the end of 2022, natural gas prices decreased to less than US$6.00/MMBtu. In the first three months of 2023, gas prices continued to fall, trading closer to US$2.00/MMBtu in March.
International crude oil and natural gas prices
We rely on the IEA’s WEO2022 for the global oil and natural gas price assumptions in the two net-zero scenarios in EF2023. The IEA’s Net Zero Emissions by 2050 Scenario is the source of price assumptions for our Global Net-zero Scenario. The IEA projects crude oil prices to decrease to 2021US$35/bbl in inflation-adjusted terms by 2030 and 2021US$24/bbl in 2050. In the IEA’s scenario, global crude oil consumption falls from 94.5 million barrels per day (MMb/d) (15.0 10³m³/d) in 2021, to 75.3 MMb/d (12.0 10³m³/d) in 2030 and 22.8 MMb/d (3.6 10³m³/d) in 2050. Much of this drop is because of the electrification of transportation; all global passenger vehicle sales are electric vehicles by 2035 in the IEA's Net Zero Emissions by 2050 Scenario. By 2050, three quarters of remaining global crude oil use is for products like petrochemical feedstock, lubricants, and asphalt, where the oil is not combusted.
In the Net Zero Emissions by 2050 Scenario, the IEA projects that North American natural gas prices fall from 2021US$6.60/MMBtu in 2021 to 2021US$2.00/MMBtu in 2030 and 2021US$1.80/MMBtu in 2050, in inflation-adjusted terms. Global demand for natural gas in this scenario falls by 20% from 2021 to 2030, and by over 70% by 2050. The steepest reductions in the global use of natural gas occurs in electricity generation and heating of buildings. Producing low-carbon hydrogen from natural gas makes up half of the remaining consumption in 2050.
The IEA’s WEO2022 Announced Pledges Scenario is the source of global price assumptions for our Canada Net-zero Scenario. In the Announced Pledges Scenario, the drop in fossil fuel consumption is not as dramatic as in the Net Zero Emissions by 2050 Scenario. Global crude oil consumption declines 40% from 2021 to 2050, and natural gas falls 37% over the same period. As a result, the price of crude oil decreases to 2021US$64/bbl in 2030 and 2021US$60/bbl in 2050 in inflation-adjusted terms in the IEA’s Announced Pledges Scenario. The price of natural gas decreases to 2021US$3.70/MMBtu in 2030 and 2021US$2.60/MMBtu in 2050.
EF2023 uses IEA price projections to model crude oil and natural gas production
While we rely on the IEA’s crude oil and natural price projections, we do not use the IEA’s projected production of Canadian crude oil and natural gas. Instead, we use the IEA’s prices (adjusted to reflect local Canadian prices) in our models to project crude oil and natural gas production (which we describe in the following chapter, “Results”).
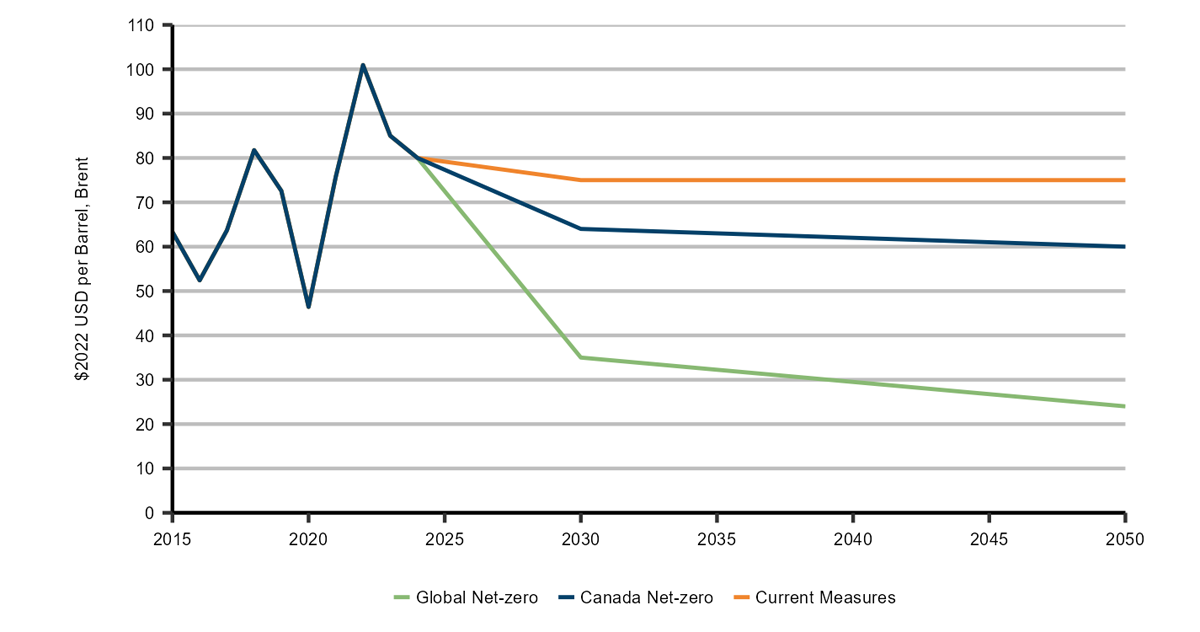
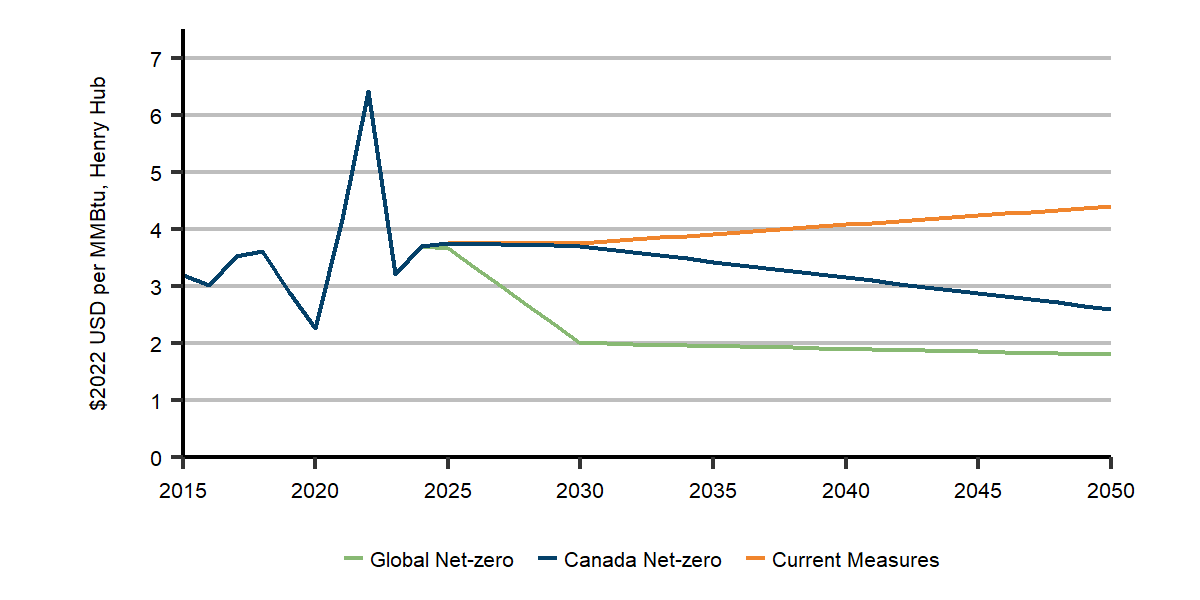
We base our global price assumptions in the Current Measures Scenario on a review of price projections by various other organizations. In this scenario, we assume the Brent crude oil price is 2021US$75/bbl by 2030 and stays at that level through the projection period. We assume the Henry Hub natural gas price reaches 2021US$3.75/MMBtu in 2030, after which the price increases slowly, reaching 2021US$4.40/MMBtu in 2050.
Figures A.4 and A.5 show the prices we assume for crude oil and natural gas for all three scenarios in EF2023. For the Global and Canada Net-zero scenarios, we adjust the IEA’s WEO2022 prices to align with key global price benchmarks used in the Canada’s Energy Future series: Brent, the primary global benchmark price for crude oil, and Henry Hub, a key North American benchmark price for natural gas. We also interpolate annual prices from IEA’s projections, which are only available for the years 2030 and 2050.
Figure A.4: Brent crude oil price assumptions, all scenarios
Description
Description: This line chart shows the Brent crude oil price assumptions in the three scenarios. All scenarios see a modest-to-significant price decline until 2030, followed by stable or gradually declining prices until 2050. Prices see the most significant decline in the Global Net-zero Scenario.
Figure A.5: Henry Hub natural gas price assumptions, all scenarios
Description
Description: This line chart shows Henry Hub natural gas price assumptions in the three scenarios.
Only the Current Measures scenario sees a gradual price increase over the projection period. The Global Net-zero Scenario sees a steep decline from 2025 to 2030, followed by a slow decline until 2050. The Canada Net-zero Scenario sees stable prices until 2030, followed by a gradual decline despite remaining higher than in the Global Net-zero Scenario.
Domestic crude oil and natural gas prices

While international prices are a key driver of Canadian crude oil prices (like Western Canada Select (WCS)Definition* for heavy crude oil), local factors are also important in determining the prices Canadian crude oil producers receive. The difference, or “differential,” in prices between local markets and international prices depends on many things, such as whether pipelines have enough capacity to ship all exports, issues in downstream markets, and quality differences between different types of crude oil (like the chemical and compositional differences between light, sweet crude oil, and heavy, sour crude oil).
In all three scenarios, the difference between West Texas Intermediate (WTI), a key North American crude benchmark, is US$2.50/bbl lower, in inflation-adjusted terms, than Brent over the entire projection period. We also assume that the difference between WTI and WCS remains at its historical level over the projection period at US$12.50/bbl in the Current Measures and Canada Net-zero scenarios. In the Global Net-zero Scenario, this differential begins to narrow slightly starting in 2035, reaching US$10/bbl in 2050. We alter the differential in this scenario to account for continued demand of heavier refined products, like asphalt.
Liquefied natural gas
We make assumptions about the amount of natural gas that Canada exports as LNG in all three scenarios (Figure A.6). Unlike many other industries, we do not use a model to project future LNG production. This is because the sector consists of a few large potential projects, each with their own unique circumstances. Instead, we rely on Asian natural gas prices in the WEO2022 to assess the economic viability of Canadian LNG exports, from which we develop our assumptions.
We assume LNG production is the lowest in the Global Net-zero Scenario
In the Global Net-zero Scenario, we assume exports of LNG from the first phase of the LNG Canada project begin in 2025 and ramp up to 1.7 billion cubic feet per day (Bcf/d) (49.0 106³/d) in 2026. This is the volume of natural gas that would be exported, accounting for natural gas used for fuel at the LNG facility. We also assume the Woodfibre LNG project begins production in 2028 and increases to full capacity of just below 0.3 Bcf/d (8.5 106³/d) in 2029. Total exports in the Global Net-zero Scenario reach 2 Bcf/d (56.6 106³/d) in 2029 and remain at that level until 2044. In 2045, LNG production begins to fall in response to much lower global LNG demand, reaching 0.3 Bcf/d (8.5 106³/d) by 2046 and staying at that level to 2050.
LNG exports increase to 2030 and then level off in the Canada Net-zero Scenario
In addition to the LNG exports in the Global Net-zero Scenario, we assume the Canada Net-zero Scenario also includes the second phase of the LNG Canada project beginning in 2029. Total LNG exports reach 3.8 Bcf/d (108.2 106³/d) in in 2030 and continue at that level throughout the projection period. We assume higher LNG exports in the Canada Net-zero Scenario because of higher natural gas prices and global LNG trade in the IEA’s Announced Pledges Scenario.
LNG exports are the highest in the Current Measures Scenario
LNG Exports reach 4.6 Bcf/d (131.4 106³/d) in 2034 and staying at that level to 2050 in the Current Measures Scenario. In all three scenarios, we assume all LNG exports originate from Canada’s west coast. Future LNG development is uncertain and could be significantly different than implied by these assumptions.
Figure A.6: Canadian LNG export volume assumptions, all scenarios

Description
Description: This line chart shows Canadian LNG export volume assumptions in the three scenarios.
Exports increase from zero to nearly 2 Bcf/d in the three scenarios in the mid to late 2020s. Volumes remain stable until the mid-2040s in the Global Net-zero Scenario, at which point they drop to less than 0.5 Bcf/d. Volumes increase to nearly 4 Bcf/d in 2030 in the Canada Net-zero Scenario and remain there throughout the projection period. Current Measures sees the same export volumes, followed by another increase to nearly 5 Bcf/d by the early- to mid-2030s.
Implications of Russia's invasion of Ukraine
In early 2022, Russia, a major exporter of oil and natural gas to world energy markets, invaded Ukraine. Nations around the world condemned the invasion and responded by sanctioning Russian energy exports. For example, much of Europe, which relied heavily on Russian natural gas, restricted imports. In addition, transportation of Russian natural gas to Europe was severely curtailed when the Nord Stream pipeline – two offshore pipelines that connect Russia to Germany – reduced flows in July 2022, and then was shut down entirely in September 2022 because of sabotage. These events resulted in an immediate surge in global demand for non-Russian oil and natural gas that could last for several years.
European countries have also responded by accelerating plans to shift to less reliance on oil and natural gas. This acceleration includes new policies to speed up the adoption of electric vehicles, enable bigger and quicker buildouts of renewable energy, delay the retirement of some nuclear power plants, and increase energy efficiency. These are in addition to accelerating climate policy action around the world. In the WEO2022, the IEA projects that policies in place around the world today could cause fossil fuel demand to peak in the mid-2020s and then decline.
These developments result in additional uncertainty in modeling Canada’s energy system. Canada is major exporter of oil and natural gas, and the global market is undergoing significant changes. For a detailed discussion of how these events could impact the global energy outlook, please see “The global energy crisis” in the IEA’s WEO2022.
Non-energy and land use, land-use change and forestry emissions (LULUCF)Definition*
The analysis in EF2023 focuses on energy production, processing, transportation, and consumption in Canada, which currently represents approximately 80% of Canada’s GHG emissions (mostly from fossil fuel combustion).
To depict a net-zero outcome for Canada, however, our analysis requires projections for all GHG emission sources and sinks. There are several human-caused GHG emission sources and sinks not directly linked to the energy system. While we do model non-energy emissions from industrial processes and product use, we do not model other non-energy GHG emissions in Canada. As a result, we make assumptions about them in our scenarios. Table A.3 describes the non-energy emissions we do not model, and the assumptions we make in our scenarios.
Table A.3: Non-energy emission assumptions, all scenarios
| Emissions source | DescriptionFootnote 6 | Assumption |
|---|---|---|
| Agriculture | Emissions related to the production of crops and livestock (excludes on-farm fuel use). Agriculture emissions were 54 MT in 2021. | Our projections of agricultural sector output were the primary driver of the agriculture emission assumptions. Some potential emissions reductions from adoption of innovative agriculture practices are included in the net-zero scenarios. Current Measures Scenario: 55 MT in 2030 and 59 MT by 2050 Global and Canada Net-zero scenarios: 51 MT in 2030 and 41 MT by 2050 |
| Waste | Emissions from the treatment and disposal of solid and liquid wastes, and waste incineration. Waste emissions were 21 MT in 2021. | Our projections of the number of households were the primary driver of the waste emission assumptions. We account for the proposed regulations on landfill methane in the assumptions of the net-zero scenarios. Current Measures Scenario: 22 MT in 2030 and 23 MT by 2050 Global and Canada Net-zero scenarios: 13 MT in 2030 and 11 MT by 2050 |
| Land use, land-use change and forestry (LULUCF) | Net emissions associated with Canada’s managed lands, such as forests and cropland. Land use, land-use change and forestry emissions were negative 17 MT in 2021. | Our assumptions for land use, land-use change and forestry emissions are based on a review of various studies and projections of others, such as recent studies by Environment and Climate Change Canada, Canadian Climate Institute, and Institut de l’énergie Trottier. Current Measures Scenario: 13 MT in 2030 and beyond Global and Canada Net-zero scenarios: -30 MT in 2030 and -50 MT by 2050 |
- Date modified: