Your feedback will help us improve and better meet your needs (opens in new tab)
Canada’s natural gas pipeline network is a critical part of the country’s energy infrastructure, supporting domestic production, consumption and industrial activity, and international trade. Transmission pipelines play a key role in this network by transporting natural gas over long distances, from producing areas to regional markets.
Transmission pipelines connect producing areas to:
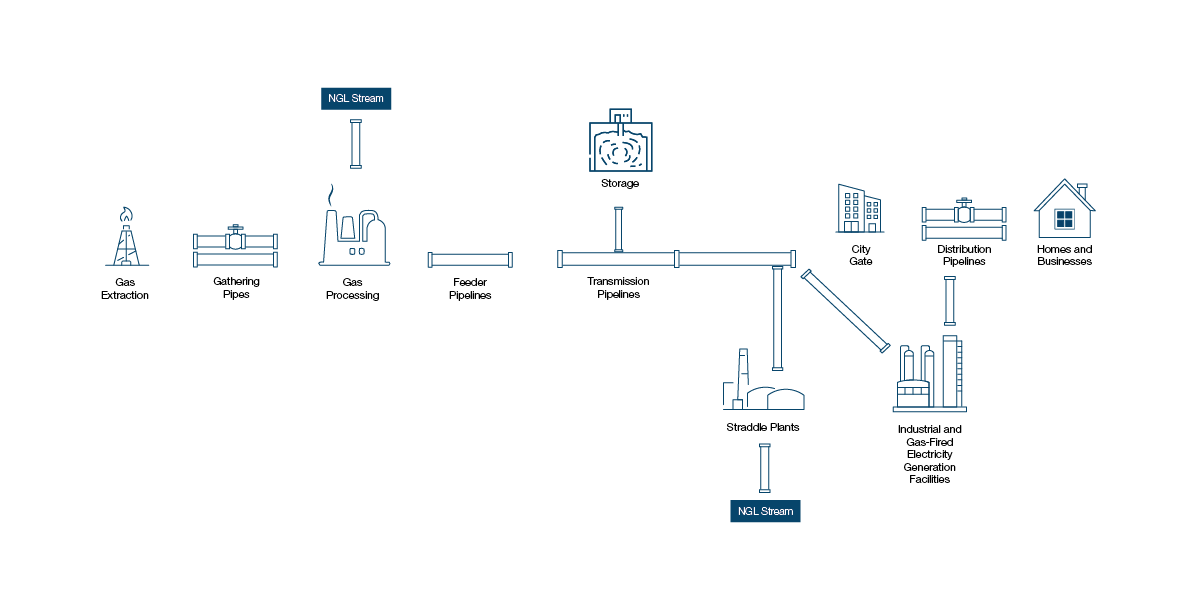
In general, Canada’s natural gas transmission pipelines carry marketable “dry” natural gas, which primarily consists of methane. Before entering transmission pipelines, raw natural gas is typically processed to remove natural gas liquids (such as ethane, propane, butane, and pentanes plus) and impurities (such as sulphur, water, and carbon dioxide). Figure 1 illustrates the natural gas system, including gas production, processing, and transportation. For more information on natural gas liquids, see the Natural gas liquids section.
Figure 1: Natural gas system overview
Source: CER
Text Alternative: This diagram provides an outline of the natural gas system from the point of production, through processing and transportation on feeder and transmission pipelines, and ultimately to points of consumption, storage, or further industrial processing.
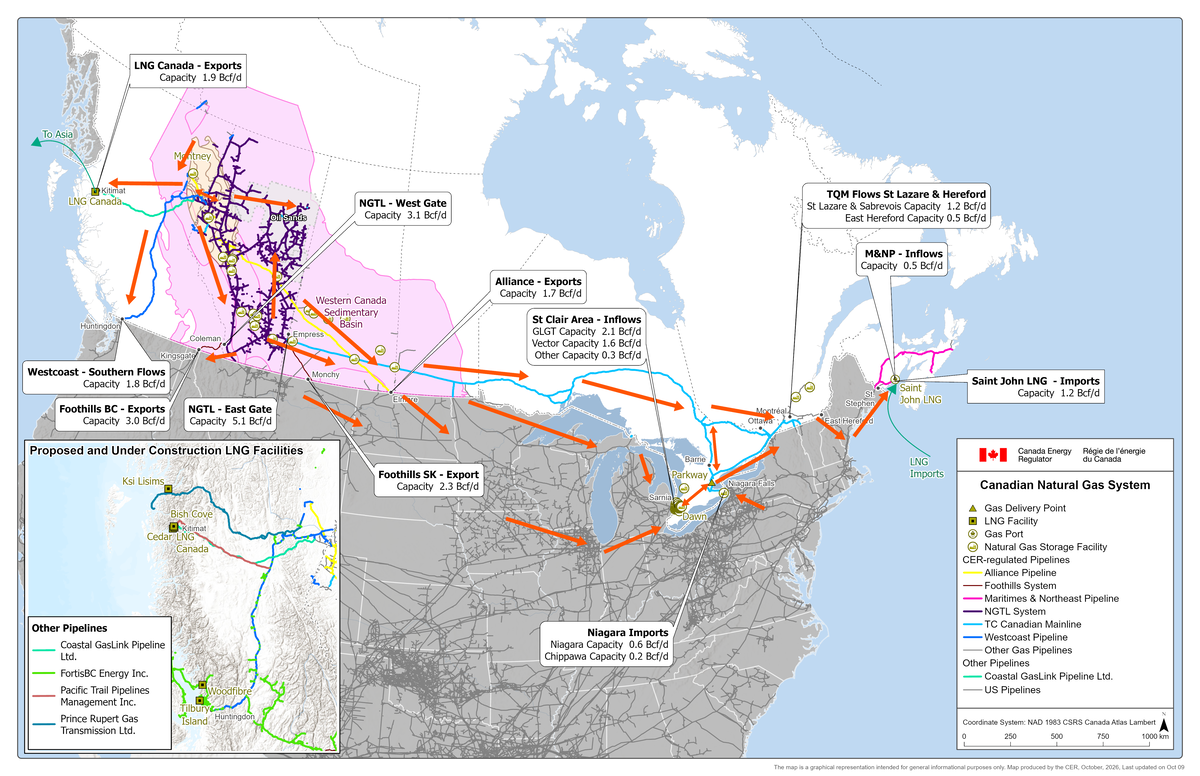
The CER regulates about 69,000 km of operating pipelines, including 48,000 km of operating natural gas pipelines. Many of Canada’s natural gas transmission pipelines transport natural gas production from western Canada (Alberta and British Columbia), where nearly all Canadian production is located, to various markets, including central Canada and the Maritimes or export points. Figure 2 shows the major transmission pipelines regulated by the CER, as well as some provincially regulated pipelines, U.S. pipelines, LNG terminals, and natural gas storage locations. It also displays the boundary of the Western Canada Sedimentary Basin (WCSB), which contains the sedimentary formations that supply 99.9% of the natural gas produced in Canada.
Figure 2: Canadian natural gas system
Source: CER; Geomatics Data Management Inc. (GDM).
Text Alternative: This map shows the major components of Canada’s natural gas system, including major transmission lines, LNG facilities, and directions of flow.
Canadian natural gas production is growing
In 2024, Canada was the fifth largest producer of natural gas in the world, accounting for 5% of global supply.Footnote 1 Canadian marketable natural gas production averaged 19.1 billion cubic feet per day (Bcf/d) in 2025, up 18% from 16.1 Bcf/d in 2021.Footnote 2 While short periods of production cuts have followed periods of low or negative pricing, as well as wildfires, production has continued to increase overall.
Several factors have driven production growth over the past five years, including:
Figure 3 illustrates how almost all Canadian natural gas production comes from Alberta and British Columbia (B.C.). While conventional production of natural gas has declined, horizontal drilling and multi-stage hydraulic fracturing have made more resources viable, especially tight and shale oil and gas. This has driven growth in areas with tight resources, such as the Montney Formation in Alberta and B.C., which now produces over half of Canadian gas production.Footnote 3
Figure 3: Annual average Canadian productionFootnote 4
Source: CER – Marketable Natural Gas Production in Canada
Text Alternative: The figure includes annual average total Canadian natural gas production from 2015 to 2025. Production steadily increased from 15.2 billion cubic feet per day (Bcf/d) in 2015 to 19.1 Bcf/d in 2025. The area chart is dominated by two major producing regions, Alberta and B.C., whereas other provinces and territories contribute relatively minimal volumes. Although total production continues to trend upward, the overall distribution of production among regions shifted. Alberta remains the dominant source of production; however, B.C.’s growing output accounts for most of the change in regional shares and continues to strengthen its position as Canada’s second‑largest producing region.
Industrial demand drives growth in Canadian natural gas consumption
Domestic natural gas demand grew by 14% between 2021 and 2025, driven largely by industrial demand growth.Footnote 5 In 2025, total Canadian consumption reached 12.8 Bcf/d. There is natural gas demand from coast to coast, from western Canada to the Maritimes; however, natural gas is produced almost entirely in western Canada and must be transported by pipeline to central Canada and the Maritimes (Ontario, Quebec, New Brunswick, and Nova Scotia). Central Canada is supplied by a combination of western Canadian gas and imports from the U.S., while the Maritimes relies almost entirely on natural gas transported through the U.S. to meet demand for most of the year.
In 2025, 76% of demand was for industrial consumption, 12% for commercial consumption, and 12% for residential consumption. Western Canada (British Columbia, Alberta, Saskatchewan, and Manitoba) accounted for 69% of demand in 2025, with Alberta representing 56% of overall Canadian demand. Ontario has the second-largest demand in the country, accounting for 26% of overall demand, followed by Saskatchewan at 6%, B.C. at 5%, and Quebec at 5%.
Industrial demand grew from 8.3 Bcf/d to 9.7 Bcf/d between 2021 and 2025, an increase of 17%. Western Canada accounted for 77% of total industrial demand in 2025, and Ontario had the highest relative growth in industrial demand between 2021 and 2025 at 44%. Industrial natural gas demand growth in Canada is partly driven by the increasing use of natural gas in electricity generation. Several provinces rely on natural gas to supply a significant share of their electricity and to support system reliability. Some provinces have also increased natural gas-fired power generation to replace retiring coal units,Footnote 6 contributing to higher natural gas consumption in the power generation sector. In western Canada, the expansion of oil sands production has also driven growth in industrial demand for natural gas. In situ extraction methods rely heavily on natural gas to generate steam, and as production capacity in the oil sands increases, natural gas requirements rise.Footnote 7 The AER estimates oil sands natural gas demandFootnote 8 was 3.5 Bcf/d in 2025, representing 27% of total gas demand in Canada. (See the Crude oil section for a more detailed discussion of oil sands growth.)
Residential and commercial natural gas demand in Canada, however, has not materially changed over the past several years, despite population growth across Canada of 9% between 2021 and 2025.Footnote 9 The gap between population growth and residential natural gas consumption points to structural changes in the market. Efficiency improvements, such as better insulation and more stringent performance standards for new homes and buildings, are reducing per‑household energy demand for heating.Footnote 10 At the same time, new residential development in Canada is increasingly concentrated in multi‑unit housing,Footnote 11 which is typically more energy‑efficient than single‑detached homes. Additionally, high-performance retrofits of existing heating systemsFootnote 12 and the gradual shift away from natural gas heating, supported by the rising adoption of electric heat pumps, are reshaping demand.Footnote 13
Figure 4: Natural gas demand in western Canada and central Canada and the Maritimes, by sector
Source: Statistics Canada Table 25-10-0086 – Natural gas supply and disposition, monthly (x 1,000)
Text Alternative: The figure presents two side‑by‑side stacked bar charts comparing natural gas consumption in western Canada on the left and central Canada and the Maritimes on the right from 2021 to 2025. Each bar is divided into three end‑use sectors: commercial (dark blue), industrial (yellow‑orange), and residential (light blue). In western Canada, overall consumption rises from just under 8 Bcf/d in 2021 to 8.8 Bcf/d in 2025, driven almost entirely by large industrial demand. Commercial and residential segments remain comparatively small and relatively stable. In contrast, central Canada and the Maritimes show substantially lower consumption levels between 3.3 and 4.0 Bcf/d over the period, with industrial use consistently forming the largest share. Together, the charts illustrate that industrial activity dominates natural gas use in both regions, but the scale of consumption is significantly larger in western Canada, with modest growth in industrial use observed in both regions over the five‑year period.
Canada is a net exporter of natural gas.Footnote 14 Although nearly all exports have historically gone to the U.S., meaningful overseas exports began in mid-2025 for the first time. In 2025, Canada exported an average of 9.1 Bcf/d of natural gas, including LNG, representing 48% of domestic natural gas production. Canada’s natural gas market is highly integrated with the U.S. through a vast pipeline transmission network.Footnote 15 In June 2025, LNG Canada began its first liquefied natural gas (LNG) exports, substantially expanding Canadian access to global markets.Footnote 16
Production growth, LNG exports, and U.S. electricity demand drive higher Canadian natural gas exports
The U.S. Midwest and U.S. West regions are the main export markets for western Canadian natural gas because they are well-connected to Canada by pipeline infrastructure. Canada also exports natural gas to the U.S. Northeast region and began exporting LNG to Asia in 2025.
While exports have not fully rebounded to levels seen in the mid-2000s,Footnote 17 such as when they averaged 10.4 Bcf/d in 2007, exports have increased by 18% over the past five years. This recent growth is due to more supply being available for export, as rising Canadian gas production outpaced domestic natural gas demand growth. In addition, pipeline capacity expansions provided more access to U.S. markets. These markets were facing increased natural gas demand due to LNG exports and growing demand for natural gas in electricity generation. See the Transportation capacity and utilization section for more information on pipeline capacity expansions.
Natural gas exports to the U.S. East declined between 2009 and 2017 as rapid growth in natural gas production from the Appalachian Basin reduced reliance on imports. Production from the Utica and Marcellus Shales has increased significantly since 2009; however, production growth has moderated since 2020, largely because of pipeline constraints in the region. Although the Appalachian Basin is not directly adjacent to LNG terminals, it is connected by pipeline to U.S. LNG export markets and is increasingly supplying LNG feedstock,Footnote 18 supported by higher prices and strong demand. Demand in the U.S. East is also rising, supported by increased gas-fired electricity demand, including from data centre development related to artificial intelligence.Footnote 19 In this market context, natural gas exports from the WCSB into the U.S. East have remained competitive, growing 23% between 2021 and 2025.
Exports to the U.S. Midwest have decreased over the longer term from an average of 5.1 Bcf/d in 2007, however, export volumes have stabilized in recent years at around 4 Bcf/d, rebounding from a low of 2.9 Bcf/d observed in 2020. Nearly half of all Canadian natural gas exports in 2005 went to the U.S. Midwest, but since then, export flows have shifted.
Exports to the U.S. West have increased steadily since 2005 and grew by 13% between 2021 and 2025. The U.S. West consists of two distinct markets: the Pacific Northwest and California. The Pacific Northwest has relatively limited domestic natural gas supply options and relies on production from the U.S. Rockies. Canadian exports play a significant role in the region, serving the majority of natural gas demand. Natural gas from Canada is also exported to California; however, it plays a supplemental role in the California market, which also has pipeline connections to the Permian Basin of Texas and New Mexico.
Canadian LNG exports ramped up in the second half of 2025, after the LNG Canada facility came online in June and began progressing toward the project’s 1.9 Bcf/d nameplate capacity.Footnote 20 Canada’s top LNG export destinations in 2025 were the Republic of Korea (38%), Japan (31%), and China (22%).Footnote 21 Natural gas exports to the U.S. also supported growing U.S. LNG exports, which reached 15 Bcf/d in 2025.Footnote 22 Canadian gas helps balance U.S. markets, including when domestic U.S. production is directed to LNG exports. Some Canadian volumes supply U.S. LNG exports directly under agreements linked to Gulf Coast liquefaction facilities.Footnote 23
Figure 5 shows Canadian natural gas exports by destination. Between 2021 and 2025, exports grew but remained concentrated in the U.S. Midwest and West. The figure also shows growth in exports to the U.S. East and the expansion of LNG exports in 2025, reflecting Canada’s growing access to overseas markets.
Figure 5: Natural gas exports from Canada
Source: CER, Liquefied Natural Gas – Exports, Natural Gas – Exports; Geomatics Data Management Inc. (GDM), Esri, TomTom, Garmin, FAO, NOAA, USGS, ©OpenStreetMap contributors, and the GIS User Community.
Text Alternative: This figure illustrates Canada’s natural gas exports from 2021 to 2025, showing a stacked area chart of export volumes by destination. Destinations include the U.S. Midwest, U.S. West, and U.S. East regions, and LNG exports appear as a small new segment in 2025. A map beneath the chart highlights major export locations across Canada.
Over 4.5 Bcf/d of LNG export capacity is proposed, planned or under construction
Proposed, planned and operating LNG projects in western Canada (shown in Figure 2) aim to capitalize on the region’s abundant and relatively low-cost natural gas resources by exporting LNG to global markets where demand is strong and prices are higher.
The majority of currently operating, planned and proposed LNG export facilities in North America are located at the U.S. Gulf Coast. Canadian LNG projects have both advantages and challenges compared to facilities on the U.S. Gulf Coast. Western Canada is geographically closer to major LNG importers in northeast Asia, such as China, Japan, and South Korea,Footnote 24 reducing shipping times and costs. The region’s colder climate also lowers the amount of energy required to cool and liquefy natural gas.
Indigenous Communities have significant ownership stakes in some of these projects, setting potential future Canadian LNG projects apart from other LNG projects in the world.Footnote 25 Canadian LNG projects are also actively moving toward partially or wholly electrifying their liquefaction processes, driven by emissions reduction targets.Footnote 26
At the same time, developing LNG projects on B.C.’s west coast is complex. Facilities and pipelines are often located in remote areas, with rugged terrain and challenging coastlines, making construction costly and time-intensive. By contrast, the U.S. Gulf Coast has well-established infrastructure, including extensive pipeline networks that connect natural gas supply from the interior of the continent to LNG export terminals.
Table 1 lists currently operating, approved, and under-review LNG export facilities in Canada that have export licences from the CER. Over 4.5 Bcf/d of additional LNG export capacity is currently proposed, planned, or under construction on the B.C. coast.Footnote 27 Additional LNG facilities may be proposed in the coming years.
Table 1. Operating, approved, and under-review LNG export facilities in Canada above 1 million tonnes per annum (MTPA)
| Project | Key pipelines | Capacity (MTPA) | Capacity (Bcf/d) | Status | Start date (expected or actual) |
|---|---|---|---|---|---|
| LNG Canada Phase 1 | Coastal GasLink PipelineFootnote 28 | 14 | ~1.9 | Operating | June 2025 |
| Woodfibre LNG | Eagle Mountain-Woodfibre Gas PipelineFootnote 29 | 2.1 | ~0.3 | Under Construction | 2027 |
| Cedar LNG | Coastal GasLink PipelineFootnote 30 | 3.8 | ~0.5 | Under Construction | 2028 |
| LNG Canada Phase 2 | Coastal GasLink PipelineFootnote 31 | 14 | ~1.9 | Approved by EAO, Referred to Major Projects Office, FID Announced | Early 2030s |
| Ksi Lisims LNG | Prince Rupert Gas Transmission Pipeline | 12 | ~1.7 | Approved by EAO, Referred to Major Projects Office, Awaiting FID | N/A |
| Tilbury LNG
Phase 2 |
FortisBC SystemFootnote 32 | 2.5 | ~0.3 | Approved by EAO, Awaiting FID | N/A |
| Kitimat/Bish Cove LNG | Pacific Trails Pipeline | 18 | ~2.5 | Cancelled by previous owners; assets acquired by Haisla NationFootnote 33 | N/A |
| Summit Lake PG LNG | Westcoast Pipeline (also known as BC Pipeline) | 2.7 | ~0.4 | Project Under Review by EAO, IAAC (currently suspended)Footnote 34 | N/A |
Even though Canada is a net exporter of natural gas, Canada does still import natural gas, primarily from the U.S. to supply central Canada and the Maritimes.Footnote 35 In 2025, Canada imported an average of 2.5 Bcf/d of natural gas, including LNG imports, representing 19% of the country’s total natural gas demand. Figure 2 shows the major natural gas import points in central Canada and the Maritimes. These points receive U.S.-produced natural gas and also re‑import natural gas that originated in western Canada but was transported through the U.S. via transmission pipelines.
Natural gas imports increased significantly in the early 2010s, largely due to the rise of low-cost supply from the Appalachian Basin in the U.S.Footnote 36 This shale gas displaced some western Canadian natural gas supply in central Canada, as well as export markets in the U.S., changing traditional export patterns and reducing eastbound flows on the TC Canadian Mainline. This new U.S. gas supply could often be delivered to central Canada and the Maritimes at lower cost than gas from western Canada because of its closer geographic location and competitive pricing. In the early 2010s, rising pipeline tolls for western Canadian gas heading east contributed to this shift, as long-haul flows on the TC Canadian Mainline declined.
Since around 2019, growth in U.S. imports has levelled off, and shipments of western Canadian gas to central Canada have increased. Between 2021 and 2025, flows from Alberta to Ontario on the TC Canadian Mainline rose by 59%.Footnote 37 This change indicates that western Canadian gas became more competitive over this period. From 2021 to 2025, western Canadian NIT prices were generally lower than Appalachian prices, with a difference of more than $2/GJ on average in 2025. Lower long-haul transportation costs on the TC Canadian Mainline, due to toll restructuring, also supported this shift. As a result, U.S. imports have fallen slightly but remain an important part of the supply mix. Limited spare pipeline capacity to move additional western Canadian gas to central Canada means imports from the U.S. are still necessary to meet the region’s demand.
North America has the world’s largest natural gas market
In general, the North American natural gas market is well-connected, transparent, liquid, and responsive. Gas moves freely across borders to where it is needed, without major barriers, and ample gas storage helps manage seasonal swings in demand. As a result, the system can quickly respond to changes in supply and demand. This integration helps ensure consumers have reliable access to natural gas and supports significant natural gas trading (the buying and selling of the physical commodity or contracts for the future delivery of set volumes of the commodity).
Figure 6 below displays the location of key natural gas pricing hubs in Canada and the U.S. and monthly average wholesale prices at each hub.Footnote 38 The continental benchmark, Henry Hub, is located in Louisiana and is used as a reference point for pricing natural gas in various regions across North America. For example, Canadian natural gas contracts are typically settled on local Canadian hub prices, which are often calculated as a “basis differential” (a discount or premium) to the Henry Hub price. The basis differential between price hubs is affected by several factors, including pipeline transportation costs, supply and demand dynamics, and general market sentiment.
The NIT (Nova Inventory Transfer) pricing point is used as a benchmark for natural gas sourced from the WCSB. NIT is a natural gas trading hub located at major storage facilities in Alberta and has become the virtual trading point representing the price anywhere on the NGTL System. The NGTL System is connected to many delivery points within the large Alberta gas market and several export markets via interconnected pipelines as well as multiple storage facilities in Alberta. Other commonly quoted reference points for natural gas prices in or adjacent to Canada include Dawn (at the natural gas storage and transportation hub near Dawn, Ontario), Westcoast Station 2 (on the Westcoast or BC Pipeline), and Maritimes & Northeast (on the Maritimes & Northeast Pipeline that runs through Maine and supplies natural gas in the Maritimes).
Figure 6: Natural gas prices at key North American hubs (average daily price by month)
Source: Natural Gas Intelligence (NGI); Geomatics Data Management Inc. (GDM), Esri, TomTom, Garmin, FAO, NOAA, USGS, ©OpenStreetMap contributors, and the GIS User Community.
Text Alternative: This figure shows natural gas prices (daily prices averaged by month) at the major hubs in Canada and the U.S. North American natural gas prices tend to be lower at NIT and Westcoast Station 2 and higher at Dawn, Henry Hub, and Maritimes & Northeast. Prices at Dawn typically track closer with Henry Hub prices.
Regional price differences reflect supply-demand dynamics and pipeline capacity constraints
In 2022, average natural gas prices at Henry Hub rose to their highest levels in the last decade, reaching an annual average of about C$8/GJ. North American prices in 2022 were influenced by changes in global gas markets due to the war in Ukraine and the resulting increase in demand for LNG imports into Europe, which was significantly supplied by U.S. LNG. This, along with strong domestic consumption, contributed to below-average storage inventories and upward pressure on prices.Footnote 39 It also resulted in an increased differential between prices in western Canada and the Henry Hub. This widening differential reflects not only stronger U.S. price signals, but also pipeline capacity constraints that limited the ability of western Canadian gas to access higher-priced markets, preventing western Canadian prices from rising in-step.
When pipeline capacity is unconstrained, natural gas price differentials should generally reflect transportation costs (pipeline tolls) between gas markets. NIT and Westcoast Station 2’s prices typically trade below Henry Hub prices. However, the basis differential between NIT and Henry Hub grew substantially in the summer of 2022 to about C$8/GJ, due to pipeline constraints. Even though gas prices were very high at Henry Hub, pipeline constraints at key points out of western Canada limited exports of western Canadian gas to the U.S. market, keeping western Canadian gas markets relatively well supplied and local prices relatively low. While the differential narrowed to more common levels by the end of 2022, the differential has increased again in recent years. Annual NIT prices in western Canada averaged around C$1.6/GJ in 2025 compared with C$4.7/GJ for Henry Hub. Daily Westcoast Station 2 prices fell into negative territory at certain times in every year from 2021 to 2025, while NIT also recorded negative spot prices at certain times in 2022, 2024, and 2025.Footnote 40 These dynamics point to pipeline capacity continuing to be tight and sometimes constrained out of western Canada.
In contrast, prices at Dawn have more closely mirrored Henry Hub, with annual averages ranging from C$8/GJ in 2022 to C$3/GJ in 2024, occasionally spiking into double‑digit levels during winter peak events. The Maritimes consistently experience the highest natural gas prices, with annual averages at the Maritimes & Northeast hub ranging from C$13/GJ in 2022 to C$5/GJ in 2023. This region has the greatest price volatility in Canada, reaching temporary highs above C$40/GJ in both 2022 and 2025. This is due, in large part, to pipeline constraints into the U.S. Northeast and the Maritimes that limit natural gas flows. In addition, there has been limited local supply of natural gas in the Maritimes since production offshore of Nova Scotia ceased.Footnote 41 The Maritimes also lacks major natural gas storage facilities,Footnote 42 and there is virtually no storage capacity east of New York State.Footnote 43
Balanced natural gas markets generally rely on sufficient pipeline capacity to move production efficiently to end markets. When capacity is well aligned with supply and demand, producers and consumers have sufficient market and supply access without incurring unnecessary transportation costs. Whereas excess pipeline capacity can lead to higher tolls for shippers and result in underutilized infrastructure, inadequate capacity means that natural gas cannot be transported to market, leading to discounted pricing, production shut‑ins, and lower royalty and tax revenues in upstream areas and elevated pricing in downstream areas. Further, some spare capacity on natural gas pipelines helps balance markets during short-term swings, such as during cold snaps, when gas demand significantly increases for only a few days or weeks each year.
Natural gas price volatility is increasing amid infrastructure constraints and increasing supply and demand variability
North American natural gas prices have been increasingly volatile in recent years, with ranges between the highest and lowest prices for Henry Hub in the double digits in 2021, 2024, and 2025. Between 2021 and 2025, the average annual price range for Henry Hub was about C$15/GJ. This follows a more stable period from 2009 to 2020, during which annual price ranges did not exceed C$7/GJ and averaged around C$3/GJ. Prices can change over short or long periods of time for a variety of reasons, including supply and demand, weather patterns, geopolitical events, and market sentiment. Supply, demand, and exports have all been increasing in North America, but storage and pipeline infrastructure has not always kept pace with respect to capacity, location, and/or timing, leading to greater volatility.Footnote 44
Fluctuations in supply and demand due to weather or other factors can also increase volatility. Renewable electricity generation has been increasing, particularly from variable sources such as wind.Footnote 45 To maintain reliability and respond to changes in electricity demand and generation from sources like wind and solar, natural gas is widely and increasingly used as a dispatchable power source, which contributes to variability in gas demand. In addition, winter weather remains a key driver of these large price ranges. During severe cold events, natural gas demand increases for space heating and at the same time freezing temperatures can cause production shut-ins. These disruptions are particularly common in U.S. southern basins, such as the Permian Basin, where natural gas infrastructure and drilling operations are less extensively winterized and are among the fastest-growing sources of supply.Footnote 46
These evolving market dynamics also affect pipeline utilization and planning. Markets increasingly require spare pipeline capacity to manage periods of peak demand. When capacity is insufficient, supply flows can be constrained, contributing to localized price spikes during these periods.
Global price dynamics are driving North American LNG exports
North American prices delinked from other global benchmarks starting in 2008 during the shale revolution. Since then, North American prices have remained well below benchmark prices in Asia and Europe. With abundant Canadian natural gas resources and comparatively low domestic prices, producers, marketers, and investors are increasingly looking to access higher priced international markets.
Between 2021 and 2025, annual average Henry Hub prices ranged from about C$3/GJ to C$8/GJ. Northeast Asian LNG (ANEA) and European (TTF) natural gas prices were higher, with annual average prices ranging from about C$14/GJ to C$46/GJ over the same period. Prices in Asia and Europe increased significantly after Russia invaded Ukraine in February 2022, resulting in a significant gas supply shock that drove prices to C$40/GJ and higher.Footnote 47
These persistent price differentials create incentives for LNG exports from North America, where gas production exceeds domestic needs. Although LNG imports in foreign markets are more expensive than pipeline deliveries due to additional costs associated with liquefaction, marine transport, and regassification, these costs can be absorbed in regions with limited local supply and higher natural gas prices.
Natural gas can be transported by pipeline, or as liquefied natural gas (LNG) or compressed natural gas (CNG) by truck, rail, and marine. Most natural gas transportation in Canada is by pipeline, but Canada has increased its natural gas export capacity with the completion of LNG export facilities on the west coast. Transportation by truck and rail is very limited.
Natural gas generally flows through transmission pipelines under pressures between 5 to 12 megapascals (MPa). Compressor stations ensure natural gas flows through the system by maintaining higher pressures in upstream areas and lower pressures downstream. Pipeline diameters and system design also play key roles in optimizing pressure, throughput, and, ultimately, pipeline capacity.
Limited capacity at key points within a network of natural gas pipelines often has widespread effects across a region and potentially across the broader continental market. For example, pipeline bottlenecks downstream of important receipt points in producing areas can limit how much additional natural gas can be injected into pipelines or storage. Meanwhile, delivery points downstream of a pipeline bottleneck might not receive enough natural gas, especially during high-demand periods.
Pipeline capacity
The capacity of a natural gas pipeline is based on many factors, such as the direction of flow, ambient temperature, pipeline compression, and maintenance work or other pressure restrictions. Companies will add capacity due to increases in supply or demand of natural gas, and can also decrease capacity due to changing markets.
Capacity data presented in this section may refer to either nameplate capacity or expected available capacity. Nameplate capacity represents the theoretical design capacity of a pipeline under assumed conditions. In contrast, expected available capacity reflects estimated operating conditions at a specific point in time.
Users should interpret capacity and utilization metrics with caution. Available capacity figures do not capture all constraints affecting pipeline throughput, such as upstream or downstream bottlenecks, derating of, or maintenance on, segments, or the ability to secure firm transportation contracts.
Pipeline operators have options to increase the volume of gas that can flow through the pipe, including adding pipeline loops (connecting sections of additional pipeline that run parallel to an existing pipeline) and increasing compression (increasing pressure so more gas can flow through the same amount of space). Conversely, capacity can be decreased through pressure reductions at points where not enough natural gas is flowing or where a pipeline has integrity issues.
Once a pipeline, or one of its sections, is no longer economical to operate, a company may choose to remove it from service through deactivation, decommissioning, and/or abandonment.
Strong production growth in the WCSB and expanding opportunities in LNG and U.S. markets are reshaping Canada’s natural gas landscape. Pipelines transporting gas out of western Canada are generally highly utilized, particularly during peak demand periods. Available capacity remains limited in key areas, though some spare capacity exists to support planned additional LNG exports.
Throughput on pipelines in Alberta, which makes up over half of Canada’s domestic natural gas demand, has grown, and utilization rates are high for oil sands delivery areas. At the same time, flows to central Canada and the Maritimes are evolving in response to shifting supply and demand dynamics. Central Canada is increasingly sourcing natural gas from western Canada to meet growing demand amid competition with U.S. markets. In the Maritimes, minimal local production means the region continues to rely on U.S. pipeline imports and LNG deliveries during peak demand periods.
Major natural gas pipeline systems regulated by the CER
The NGTL System is a large natural gas gathering and transportation system with receipt and delivery points across Alberta as well as northeastern B.C. NGTL collects natural gas from WCSB producing areas and transports the gas to markets and customers in Alberta and, through connected pipelines, across North America. About three-quarters of Canadian production is transported by NGTL.
Natural gas production in the WCSB has increasingly shifted toward tight gas plays in northeast B.C. and northwest Alberta, while traditional conventional production that was more dispersed around Alberta has continued to decline. This geographic shift has reshaped flows on the NGTL System, which historically gathered conventional supply from across Alberta. Today, around a quarter of the basin’s production enters NGTL through the North Montney Mainline and Groundbirch Mainline in the northwest section of the NGTL System, which mostly collects gas from the Montney Formation in B.C. The majorityFootnote 48 of this gas supply then moves south toward markets via the Grande Prairie Mainline and Edson Mainline, which collect gas from the Montney Formation in Alberta, the Alberta Deep Basin, and the Duvernay Shale along the way. This southern route forms the dominant flow path toward the East Gate and West Gate delivery areas, with flows averaging 12.1 Bcf/d in 2025, as measured at the Upstream of James River key point.
The NGTL System also serves significant demand within Alberta, which makes up over half of Canada’s domestic demand. In 2025, flows to Oil Sands Delivery Areas on NGTL were higher than flows at West Gate (an average of 2.87 Bcf/d versus 2.69 Bcf/d at West Gate).
NGTL is connected to the Foothills System at two key points: West Gate and East Gate. The Foothills System transports natural gas into B.C. and Saskatchewan, as well as the U.S. at key export points at Kingsgate, B.C., and Monchy, Saskatchewan, where gas is delivered to the U.S. Gas Transmission Northwest Pipeline (GTN) and U.S. Northern Border Pipeline, respectively. The Alberta sections of the Foothills system are effectively integrated with southern portions of NGTL that deliver gas to southern Alberta markets and to major export points.
The Enbridge Westcoast/BC Pipeline System transports natural gas from northeastern B.C. to both domestic (B.C. and Alberta) and export markets. Much of the recent production growth in the WCSB comes from northeastern B.C., particularly the Montney Formation, increasing demand for transportation on the Westcoast/BC Pipeline System as producers seek market access.
Westcoast transports gas throughout B.C., and its primary delivery points are the Huntington/FortisBC Lower Mainland key point and the connections at NOVA/Gordondale and Sunset Creek to the NGTL System and Coastal GasLink Pipeline. Together, these delivery points provide about 3.3 Bcf/d of capacity.Footnote 49 Shifting supply and demand dynamics are influencing natural gas transportation requirements on the Westcoast system. Increasing production from the Montney Formation, along with growing demand for feed gas to supply LNG export facilities, has led to several recent and planned expansion projects.
The Alliance Pipeline is unique among Canada’s major natural gas transmission systems because its design allows it to transport liquids‑rich natural gas. This means that it does not require as much removal of natural gas liquids (NGLs) before transmission compared with other major natural gas pipelines. Alliance transports western Canadian liquids‑rich gas to the Chicago area, where NGLs are extracted at Aux Sable’s Channahon Extraction and Fractionation Facility. This facility is connected to three NGL pipelines serving local refineries and industrial customers. Natural gas from Alliance can also continue through the U.S. to markets in the U.S. Midwest, as well as central Canada and the Maritimes, including on the Vector Pipeline. In June 2026, Alliance submitted a project notification for the Alliance Heartland Expansion Project, which would provide a new natural gas service with delivery into Fort Saskatchewan, Alberta.Footnote 50 Alliance’s nominal receipt and delivery capacity in Canada is 1.6 Bcf/d, although actual throughput varies daily due to maintenance, outages, and daily temperature and pressure conditions.
The TC Canadian Mainline receives natural gas in western Canada via the NGTL System at East Gate.Footnote 51 It also receives gas in Ontario, where receipts include both imports of U.S.-produced gas and re-imports of western Canadian-produced gas via the Great Lakes Gas Transmission (GLGT) and VectorFootnote 52 pipelines. The GLGT and Vector pipelines deliver natural gas into the Dawn Hub, which maintains significant storage inventories serving central and eastern Canadian markets, as well as markets in the U.S. Midwest and U.S. Northeast.Footnote 53 The Canadian Mainline is connected to the Dawn Hub through the provincially regulated Enbridge Dawn-to-Parkway System.Footnote 54 In other words, gas can flow into southern Ontario on GLGT and Vector, then flow through Enbridge’s Dawn-to-Parkway System and onto TC Energy’s Canadian Mainline near Cambridge and Oakville, Ontario, for delivery to markets farther east and north.
Natural gas can move eastward from the TC Canadian Mainline to the TQM system, serving Quebec as well as the Maritimes and the U.S. northeast via the Portland Natural Gas Transmission System (PNGTS).Footnote 55
The Maritimes & Northeast Pipeline (M&NP) was originally built to transport natural gas from offshore Nova Scotia to markets in the Maritimes and the northeastern U.S. However, offshore Nova Scotia production declined sharply after 2014 and ended entirely by the end of 2018.Footnote 56 Since 2015, natural gas has been increasingly imported into Canada near St. Stephen, New Brunswick, via the bi directional M&NP system. The Baileyville/St. Stephen key point on the system historically functioned as an export point, but with the decline and eventual end of offshore production, this flow pattern reversed.
Much of the natural gas now imported on M&NP originally flowed eastward along the TC Canadian MainlineFootnote 57 through TQM in Québec and was then exported to the U.S. at East Hereford, where TQM connects with the Portland Natural Gas Transmission System (PNGTS). From there, gas can move south to Maine and then return northward on M&NP into New Brunswick.
The Brunswick Pipeline transports re-gasified LNG from the Saint John LNGFootnote 58 terminal in Saint John, New Brunswick, to a connection with M&NP on the U.S. side of the New Brunswick-Maine border.Footnote 59 Some of this gas can then flow back into Canada on M&NP. LNG imports arrive at the terminal from overseas. In recent years, these volumes have been used mainly during periods of peak winter demand, resulting in low utilization of the Brunswick Pipeline. The annual average utilization of the pipeline was 6% over the past five years, peaking at 11% in 2025, while the maximum monthly utilization during peak winter demand was 51% in December 2025.
Many CER-regulated pipelines leaving the WCSB are highly utilized
Figure 7 below shows six key points on the NGTL, Westcoast or BC Pipeline, and Alliance Pipeline systems where gas leaves the WCSB and moves to domestic and export markets. It also shows combined pipeline throughput volumes and capacity across all the key points. The points represent the primary pathways through which gas moves from the WCSB into domesticFootnote 60 and international markets:
Combined flows across these key points are a useful indicator of overall capacity, throughput, and market access for natural gas leaving the WCSB.Footnote 63 Average combined flows across these key points increased from 9.5 Bcf/d in 2021 to 11.1 Bcf/d in 2025, a growth of 17%. Throughputs rose year over year except in 2023, when demand for transportation service was affected by two major factors: a mild winter in late 2022 and early 2023, which lowered seasonal consumption; and production shut-ins in northeast B.C. due to extensive wildfires during the spring and summer months.
From January 2021 to December 2025, about 2.7 Bcf/d of capacity was added at the key points. Roughly two-thirds of the additional capacity entered service in 2025 at Willow Valley Interconnect and Sunset Creek to enable flows of natural gas westward onto the provincially regulated Coastal GasLink pipeline, which serves LNG exports. Prior to these major additions in 2025, throughputs increased quickly to fill expanded capacity following capacity additions. Therefore, despite the additions, most key points remained highly utilized, with little or no spare capacity. Utilization reached a peak in early 2025. While most key points remained highly utilized at the end of 2025, those points serving Coastal GasLink and west coast LNG exports had spare capacity, helping to support planned growth in LNG exports.
Figure 7: Key points exiting the Western Canada Sedimentary Basin
Source: CER, Pipeline Throughput and Capacity Data; Geomatics Data Management Inc. (GDM), Esri, TomTom, Garmin, FAO, NOAA, USGS, ©OpenStreetMap contributors, and the GIS User Community.
Text Alternative: This figure presents a map on the left and a time‑series line chart on the right. The map highlights the major pipeline systems originating in the WCSB and identifies the locations of key delivery and export points. The time‑series chart displays combined flows and capacities for the following points: East Gate, West Gate, Alliance – Border, Huntington/FortisBC Lower Mainland, Sunset Creek (west flows towards Coastal GasLink Pipeline only), and Willow Valley Interconnect.
Key points serving intra-Alberta demand are highly utilized
Alberta has one of the most extensive natural gas pipeline networks in North America, with NGTL being its largest system. As outlined in the Industrial demand drives growth in Canadian natural gas consumption section, rising industrial demand in Alberta—a province that accounts for over half of Canada’s domestic consumption—is a key driver of overall growth. Figure 8 below shows four key points where gas is delivered to intra-Alberta demand centres. These points represent the primary pathways through which gas is delivered to industrial, commercial, and residential markets in Alberta:
Average combined flows to the Oil Sands Delivery Areas rose from 2.6 Bcf/d in 2021 to 2.9 Bcf/d in 2025, a 12% increase. During peak demand, the monthly average utilization rate at these two key points remained above 90%. In contrast, average throughput to Calgary and Edmonton remained fairly steady at around 1.7 Bcf/d. While the monthly average utilization rate during peak demand months has been moderate, averaging 60 to 68% between 2021 and 2025, daily utilization levels have periodically approached system limits, reaching up to 90% in Calgary and 86% in Edmonton. Shippers can obtain contracts on the NGTL System for firm transportation to meet peak demand.
Pipeline capacity at these key delivery points has continued to expand to accommodate growing demand for firm transportation service. From January 2021 to December 2025, the combined capacity at the points grew by around 1.3 Bcf/d. However, a recent NGTL firm contracting map indicates that much of the system is fully contracted.Footnote 64
Figure 8: Key points representing intra-Alberta demand
Source: CER, Pipeline Throughput and Capacity Data; Geomatics Data Management Inc. (GDM), Esri, TomTom, Garmin, FAO, NOAA, USGS, ©OpenStreetMap contributors, and the GIS User Community.
Text Alternative: This figure presents a map on the left and a time‑series line chart on the right. The map highlights the NGTL System, which serves intra-Alberta demand. The time‑series chart displays combined flows and capacities for the Oil Sands Delivery Area (OSDA) Kirby and Oil Sands Delivery Area (OSDA) Liege key points on top and combined flows and capacities for the Edmonton and Calgary key points below.
Pipeline flows into central Canada are evolving and capacity is highly utilized
The TC Canadian Mainline is the primary transportation route for the majority of natural gas that enters central Canada. Figure 9 shows four key points where gas is delivered to central Canada on the TC Canadian Mainline. Although these points do not represent all gas flows, they indicate some important flows into the region.Footnote 65
Together, these points represent the primary pathways through which central Canada is supplied with natural gas, including both domestic production from the WCSB and imports from U.S. supply basins.
Several points that once primarily exported gas began transitioning to become bi-directional as U.S. production surged in the late 2000s. Since 2012, Ontario has increasingly relied on U.S. imports via the Mainline, driven by rising output from the Appalachian Basin. Niagara began importing in 2012, followed by Chippawa in 2015, after both were converted to bi-directional service to accommodate Marcellus Shale gas flows. TC Energy also enabled bi-directional capability at Iroquois in 2017; while it remains primarily an export point, intermittent imports have occurred since 2018. As a result, throughout the 2000s and 2010s, flows of western Canadian natural gas on the Northern Ontario Line generally declined.
Flows have continued to evolve in recent years. Figure 9 below illustrates how flows reflect the relative economics of supply sources alongside seasonal demand patterns. Between 2021 and 2025, total flows across the four key points increased from an annual average of 2.5 Bcf/d to 3.1 Bcf/d, representing a 25% increase. Over this period, deliveries on the Northern Ontario Line accounted for a growing share of total volumes, rising from 46% to 60%.
Pipeline throughput shows strong seasonality, with higher utilization during winter months due to heating demand. Flows on the Northern Ontario Line are sustained year-round and increase to meet peak winter demand, while Eastern Triangle Parkway receipts display more pronounced seasonality reflecting storage withdrawals in the winter. Imports at Chippawa tend to be higher in summer, when lower-cost U.S. supply is more abundant, and decline in winter when central and eastern Canadian markets compete directly with U.S. markets. In contrast, imports at Niagara show limited seasonal change and contribute to a smaller share of total supply during peak winter demand. As a result, stored gas and increased deliveries from the Northern Ontario Line are critical to maintaining system reliability during peak winter periods.
Figure 9: Flows into Ontario on the TC Canadian Mainline
Source: CER, Pipeline Throughput and Capacity Data; Geomatics Data Management Inc. (GDM), Esri, TomTom, Garmin, FAO, NOAA, USGS, ©OpenStreetMap contributors, and the GIS User Community.
Text Alternative: The graphic consists of a map and a time‑series chart illustrating natural gas flows on the TC Canadian Mainline into Ontario. The top portion shows a simplified map of the pipeline system extending from Alberta through the Prairies, across Manitoba and the Great Lakes region, and into Ontario and Québec, with major receipt and delivery points Emerson, Chippawa, Niagara, Parkway, and the Northern Ontario Line highlighted. The lower portion is a stacked area chart displaying daily gas flow volumes from 2021 to 2025 at four key points into Ontario: Northern Ontario Line, the Eastern Triangle Parkway, Chippawa, and Niagara. The chart illustrates seasonal variability, with higher flows in winter months and recurring peaks each year as demand increases during heating seasons.
The Maritimes natural gas market receives supply from the pipe-constrained U.S. Northeast region and continues to rely on LNG imports during peak demand periods
Natural gas that enters central Canada can continue eastward from the TC Canadian Mainline to the TQM system, PNGTS, and then M&NP, which starts in Maine and continues into New Brunswick. The section titled Regional price differences reflect supply-demand dynamics and pipeline capacity constraints discusses the relatively high prices and volatility in the Maritimes market, largely due to the limited local supply of natural gas, lack of storage facilities, and limited pipeline capacity connecting the Maritimes and U.S. northeast markets with growing Appalachian supply.
Figure 10 illustrates natural gas imports into the Maritimes transported through M&NP and the Brunswick Pipeline. Imports from the M&NP Baileyville/St. Stephen key point have remained steady, and LNG imports continue to supplement supply during peak demand periods. Flows at Baileyville/St. Stephen on M&NP show frequent variation and clear seasonal peaks, particularly during winter months. Volumes on the Brunswick Pipeline remain low for most of the year but rise during short periods of increased LNG imports at the Saint John LNG terminal. Together, the map and chart show how import points and pipeline systems contribute to the Maritimes’ natural gas supply, with steady imports at St. Stephen and occasional LNG‑related spikes on the Brunswick system.
Figure 10: Maritimes imports
Source: CER, Pipeline Throughput and Capacity Data; Geomatics Data Management Inc. (GDM), Esri, TomTom, Garmin, FAO, NOAA, USGS, ©OpenStreetMap contributors, and the GIS User Community.
Text Alternative: This figure has two visual components showing natural gas activity in the Maritimes region. The top map outlines key pipelines across New Brunswick and Nova Scotia, including the M&NP and Brunswick Pipeline, and key connection points such as St. Stephen, New Brunswick. The time‑series chart below displays daily natural gas throughput from early 2021 to late 2025. The chart can display either pipeline.
Many new pipelines and pipeline expansions have been placed in service on both federally and provincially regulated pipelines in the past five years,Footnote 66 and several are currently proposed or under construction.Footnote 67 Table 2 and Table 3 list many of these projects, which support growing demand in Alberta and exports to the U.S. or other countries via LNG exports.
The Canada Energy Regulator has received many facilities applications for major natural gas pipeline systems in Canada, including some expansions. Between 2021 and 2025, 57 applicationsFootnote 68 were filed with the CER for the NGTL System, 16 applications for the Westcoast or BC Pipeline System, seven applications for the Alliance Pipeline, three applications for the TransCanada (TC) Canadian Mainline, two applications for the Maritimes & Northeast Pipeline (M&NP) system, one application for the Foothills System, and none for the Brunswick Pipeline.
Table 2. Recent, upcoming, and proposed pipelines and expansions – major CER-regulated facilities
| Project/program | Pipeline system | Company (parent company or owners) | Capacity increase | Status (as of May 2026) | Expected or actual In-service date |
|---|---|---|---|---|---|
| T-South Expansion and Reliability Project | Westcoast or BC Pipeline | Westcoast Energy GP Inc. on behalf of Westcoast Energy Limited Partnership (Enbridge) | 0.2 Bcf/d | In-service | 2021 |
| Spruce Ridge Program | Westcoast or BC Pipeline | Westcoast Energy GP Inc. on behalf of Westcoast Energy Limited Partnership (Enbridge) | 0.4 Bcf/d | In-service | 2021 |
| Edson Mainline Expansion Project | NGTL | NGTL GP Ltd. as general partner on behalf of NGTL Limited Partnership (TC Energy) | 0.3 Bcf/d | In-service | 2022 |
| 2021 NGTL System Expansion Project | NGTL | NGTL GP Ltd. as general partner on behalf of NGTL Limited Partnership (TC Energy) | 1.5 Bcf/d | In-service | 2023Footnote 69 |
| North Corridor Expansion | NGTL | NGTL GP Ltd. as general partner on behalf of NGTL Limited Partnership (TC Energy) | 0.4 Bcf/d | In-service | 2023 |
|
West Path Delivery Program: NGTL West Path 2022 NGTL West Path 2023 Foothills West Path 2022 Foothills West Path 2023 |
NGTL and Foothills | NGTL GP Ltd. as general partner on behalf of NGTL Limited Partnership and Foothills Pipe Lines Ltd. (TC Energy) | 0.3 Bcf/d | In-service | 2022-2023 |
| Grande Prairie Mainline Loop No. 4 (Valhalla North Section) and Berland River Compressor Station C3 Unit Addition | NGTL | NGTL GP Ltd. as general partner on behalf of NGTL Limited Partnership (TC Energy) | 0.4 Bcf/d | In-service | 2026 |
| Aspen Point Program | Westcoast or BC Pipeline | Westcoast Energy GP Inc. on behalf of Westcoast Energy Limited Partnership (Enbridge) | 0.5 Bcf/d | Under construction | Late 2026 |
| Grande Prairie Mainline Loop No. 3 – McLeod South Section | NGTL | NGTL GP Ltd. as general partner on behalf of NGTL Limited Partnership (TC Energy) | Information not available | Approved by the Commission of the CER | 2027 |
| Grande Prairie Mainline Loop No. 3 – Colt and Greenview SectionsFootnote 70 | NGTL | NGTL GP Ltd. as general partner on behalf of NGTL Limited Partnership (TC Energy) | Information not available | Under review by the Commission of the CER | 2028 |
| Sunrise Expansion Program | Westcoast or BC Pipeline | Westcoast Energy GP Inc. on behalf of Westcoast Energy Limited Partnership (Enbridge) | 0.3 Bcf/d | Under construction | 2028 |
| Birch Grove Program | Westcoast or BC Pipeline | Westcoast Energy GP Inc. on behalf of Westcoast Energy Limited Partnership (Enbridge) | 0.2 Bcf/d | Under review by the Commission of the CER | 2028 |
Table 3. Recent, upcoming, and proposed pipelines and expansions – major provincially regulated facilities
| Project/program | Pipeline system | Company (parent company or owners) | Capacity increase | Regulator | Status (as of May 2026) | Expected or actual In-service date |
|---|---|---|---|---|---|---|
| Coastal GasLink ProjectFootnote 71 | Coastal GasLink Pipeline | Coastal GasLink Pipeline Ltd. (Alberta Investment Management Corporation (AIMCo), KKR & Co., TC Energy) |
2.1 Bcf/d | British Columbia Energy Regulator | Operating | 2024Footnote 72 |
| FortisBC Eagle Mountain Pipeline Project | FortisBC System | FortisBC (Fortis Inc) | 0.23 Bcf/d | British Columbia Energy Regulator | Under Construction | 2027 |
| ATCO Yellowhead Mainline Project | ATCO System | ATCO Gas and Pipelines Ltd. (ATCO) | 1.1 Bcf/d | Alberta Utilities Commission (AUC) | Under construction | 2027 |
| Prince Rupert Gas Transmission Project | Prince Rupert Gas Transmission Pipeline | NW Infrastructure Limited Partnership | 2 Bcf/d | British Columbia Energy Regulator | On hold after construction started | N/A |
| Pacific Trails Pipeline Project | Pacific Trails Pipeline | Pacific Trail Pipelines (PTP) Management Inc. | 1 Bcf/d | British Columbia Energy Regulator | On Hold | N/A |
| Coastal GasLink Phase 2 Project | Coastal GasLink Pipeline | Coastal GasLink Pipeline Ltd. (Alberta Investment Management Corporation (AIMCo), KKR, TC Energy) |
2.1-2.9 Bcf/d | British Columbia Energy Regulator | FID Announced | N/A |