Canada’s Pipeline Transportation System 2016
Trans-Northern Pipelines Inc.’s Trans-Northern Pipeline
| Commodity and NEB Group | Refined petroleum products (Group 1) |
| Annual average capacity | Differs for each segment |
| Average throughput 2015Note a | 33 700 m³/d (212 Mb/d) |
| Primary receipt points | Montreal, QC; Nanticoke, ON |
| Primary delivery points | Montreal, QC; Toronto, Clarkson, Kingston, Oakville, Cornwall, Belleville, Maitland and Ottawa, ON |
| Rate base 2015 | Not available |
| Cost of Service 2015 | $81.1 million |
| Abandonment Cost Estimate and Collection PeriodNote b | $76.7 million; 40 years |
Source: NEB
Text version of this map
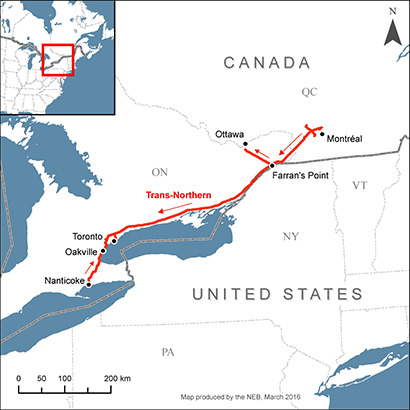
This map provides an overview of the Trans-Northern System.
Overview
The Trans-Northern Pipeline (Trans-Northern) transports refined petroleum products west from Montreal, QC to Toronto, ON, and from Imperial Oil Limited's refinery at Nanticoke, ON east to Toronto. There are delivery points along both stretches, including a branch line that services the Ottawa area. The pipeline operates bi-directionally between Toronto and Oakville, ON. Capacity varies across each segment of the pipeline. For example, from Montreal to Farran’s Point the capacity is 21 000 m³/d (132 Mb/d); from Farran’s Point to Belleville the capacity is 11 400 m³/d (72 Mb/d); and, from Belleville to Toronto the capacity is 10 000 m³/d (63 Mb/d).
Key Developments
In October 2010, the Board ordered a system-wide pressure reduction to 80% of the maximum operating pressure after assessing Trans-Northern’s integrity management plan. As of June 2016, the restriction remained in effect on parts of the system.
Utilization
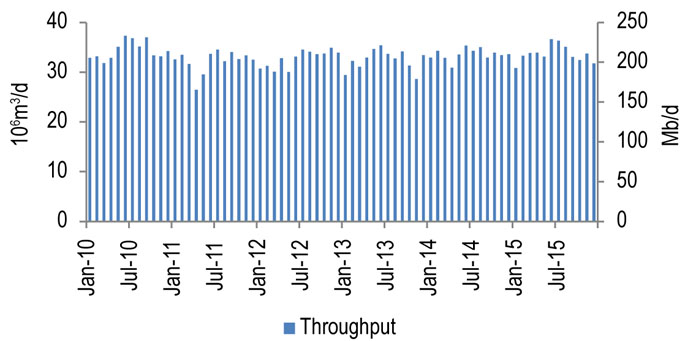
Figure 8.4.1 shows Trans-Northern throughput from 2010-2015. Throughput averaged 33 600 m³/d (211 Mb/d) in 2014, and 33 700 m³/d (212 Mb/d) in 2015. Capacity differs across the various segments of the system. Throughputs shown are the addition of average volumes shipped in each month for all segments of the pipeline.
Figure 8.4.1: Trans-Northern Throughput vs. Capacity
Source: Trans-Northern, NEB
Text version of this graphic
This bar chart shows throughput for the Trans-Northern Pipeline between 2010 and 2015. Throughput averaged 33.7 10³m³/d (212 Mb/d) in 2015, compared to 33.6 10³m³/d (211 Mb/d) in 2014.
Tolls
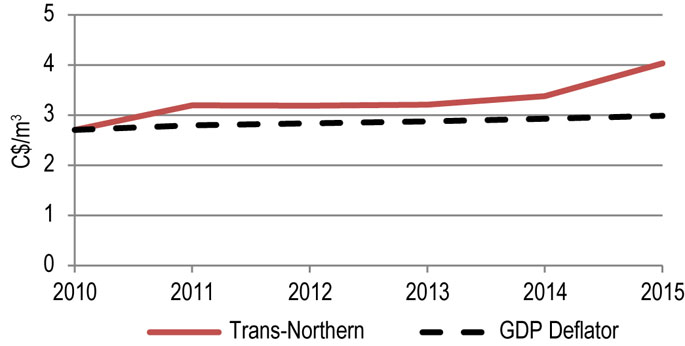
The toll settlement (RHW-3-96) established a starting point for the revenue requirement in 1996, and a mechanism to adjust costs each year. Tolls are submitted annually to the Board and are regulated on a complaint basis. Figure 8.4.2 shows the Trans-Northern benchmark toll (Nanticoke to North Toronto) and the GDP deflator (normalized) for 2010-2015. The benchmark toll increased by 18% in 2011, mainly due to a $6.5 million integrity allowance and a $4.5 million expense to cover cleanup costs related to events in 2010. It remained steady between 2012 and 2014 after which it increased by 19% due in part to a Non-Routine Adjustment for Pipeline Integrity.
Figure 8.4.2: TNPI Benchmark Toll
Source: NEB
Text version of this graphic
This graph shows the Trans-Northern benchmark toll as a solid red line and the GDP deflator as a black dashed line. The graph shows the Trans-Northern benchmark toll rising steadily from approximately $2.70 in 2010 to approximately $3.37 in 2014. The toll then increases to approximately $4.00 in 2015.
Financial
Trans-Northern Pipelines Inc. earns a return on equity equivalent to the RH-2-94 formula rate plus 25 points additional return for risk. Its financial ratios have improved in recent years due to stable cash flows and continued reduction of debt. Its credit rating, as assessed by DBRS, remains investment grade.
| Trans-Northern Pipelines Inc. | 2010 | 2011 | 2012 | 2013 | 2014 | 2015 |
|---|---|---|---|---|---|---|
| Revenue Requirement (millions) | $56.3 | $66.2 | $65.1 | $65.8 | $69.1 | $81.1 |
| Interest and Fixed-Charges Coverage Ratio | 3.83 | 3.47 | 4.83 | 6.41 | 5.52 | Note a |
| Cash Flow-to-Total Debt and Equivalents Ratio | 14.1% | 23.9% | 29.7% | 24.1% | 37.8% | Note a |
| DBRS Credit Rating | A (low) | A (low) | A (low) | A (low) | A (low) | A (low) |

- Date modified: