ARCHIVED – Canadian Pipeline Transportation System – Transportation Assessment
This page has been archived on the Web
Information identified as archived is provided for reference, research or recordkeeping purposes. It is not subject to the Government of Canada Web Standards and has not been altered or updated since it was archived. Please contact us to request a format other than those available.
Canadian Pipeline Transportation System - Transportation Assessment [PDF 3160 KB]
June 2008
Table of Contents
List of Figures and Tables
List of Acronyms, Abbreviations and Units
Foreword
Executive Summary
1. Introduction
2. Adequacy of Pipeline Capacity
2.1 Price Differentials and Tolls
2.1.1 Price Differentials and Tolls on Oil Pipelines
2.1.2 Price Differentials and Natural Gas Firm Service Tolls
2.2 Capacity Utilization on Major Routes
2.2.1 Oil Pipelines
2.2.2 Natural Gas Pipelines
2.3 Apportionment
2.3.1 Enbridge
2.3.2 Trans Mountain Pipeline Inc.
2.3.3 Cochin
2.4 Chapter Summary
3. Looking Ahead - Proposed Pipelines
3.1 Oil Pipelines
3.2 Natural Gas Pipelines
3.3 Chapter Summary
4. Pipeline Tolls and Shipper Satisfaction
4.1 Negotiated Settlements
4.2 Pipeline Tolls Index
4.2.1 Oil Pipeline Tolls
4.2.2 Natural Gas Pipeline Tolls
4.2.3 Comparison of Natural Gas and Oil Pipeline Tolls
4.3 Shipper Satisfaction
4.3.1 NEB Pipelines Services Survey
4.3.2 Formal Complaints
4.4 Chapter Summary
5. Pipeline Financial Integrity
5.1 Common Equity
5.2 Financial Ratios
5.3 Credit Ratings
5.4 Chapter Summary
6. Conclusions
Appendix 1: Group 1 and Group 2 Pipelines
Appendix 2: Pipeline Services Survey Aggregate Results
Appendix 3: Debt Rating Comparison Chart
List of Figures and Tables
Figures
| 1.1 | Oil Pipelines Regulated by the NEB |
| 1.2 | Natural Gas Pipelines Regulated by the NEB |
| 1.3 | 2007 Supply and Disposition of Crude Oil |
| 1.4 | 2007 Supply and Disposition of Natural Gas |
| 2.1 | Light Sweet Crude Export Price vs. Edmonton Par |
| 2.2 | Heavy Crude Export Price vs. WCS at Hardisty |
| 2.3 | Canadian Crude Oil Prices and Differential |
| 2.4 | Alberta-Dawn Price Differential vs TransCanada Toll and Fuel |
| 2.5 | Sumas-Station 2 Price Differential vs. Westcoast T-South Toll and Fuel |
| 2.6 | Enbridge Pipeline Throughput vs. Capacity |
| 2.7 | Trans Mountain Pipeline Throughput vs. Capacity |
| 2.8 | Express Pipeline Throughput vs. Capacity |
| 2.9 | Trans-Northern Pipeline Throughput |
| 2.10 | TransCanada Mainline Throughput vs. Capacity |
| 2.11 | Foothills Sask. Throughput vs. Capacity at Monchy |
| 2.12 | Westcoast Mainline Throughput vs. Capacity |
| 2.13 | Foothills South B.C. System Throughput vs. Capacity at Kingsgate |
| 2.14 | Alliance Throughput vs. Capacity |
| 2.15 | Trans Québec & Maritimes Throughput vs. Capacity |
| 2.16 | Maritimes & Northeast Pipeline Throughput vs. Capacity |
| 3.1 | Proposed Pipeline Projects and NEB Forecast of Crude Oil Supply |
| 3.2 | Proposed Canadian LNG Projects |
| 4.1 | Negotiated Settlements Timeline |
| 4.2 | NEB-Regulated Oil Pipeline Benchmark Tolls |
| 4.3 | NEB-Regulated Natural Gas Pipeline Benchmark Tolls |
| 4.4 | Oil and Natural Gas Pipeline Benchmark Tolls |
| 4.5 | Shipper Satisfaction on Pipeline Quality of Service |
| 5.1 | Variance from NEB-Approved ROE - 2003 to 2007 |
| 5.2 | Fixed-Charges Coverage Ratios |
| 5.3 | Cash Flow-to-Total Debt and Equivalent Ratios |
Tables
| 2.1 | Enbridge Apportionment |
| 2.2 | Trans Mountain Apportionment |
| 2.3 | Cochin Apportionment |
| 3.1 | Announced and Proposed Canadian Oil Pipelines and Expansions |
| 3.2 | Canadian Natural Gas Pipeline Proposals |
| 5.1 | Deemed Common Equity Ratios |
| 5.2 | Achieved ROEs and the RH-2-94 Formula ROE |
| 5.3 | DBRS Credit Rating History |
| 5.4 | S&P Credit Rating History |
| 5.5 | Moody's Credit Rating History |
List of Acronyms, Abbreviations and Units
Acronyms and Abbreviations
| ACCE | Alida to Cromer Capacity ExpansionProject |
| ADR | Appropriate Dispute Resolution |
| AOS | Authorized Overrun Service |
| Alliance | Alliance Pipeline Ltd. |
| Altex | Altex Energy Ltd. |
| BP | BP Canada |
| CAPP | Canadian Association of Petroleum Producers |
| CDA | Central Delivery Area |
| Central Delivery Area | CEPA Canadian Energy Pipeline Association |
| Cochin | Kinder Morgan Cochin Pipeline Ltd. |
| Coral | Coral Energy Canada Inc. |
| DBRS | Dominion Bond Rating Service |
| DDA | Distributor Delivery Area |
| EBIT | Earnings Before Interest and Taxes |
| Enbridge | Enbridge Pipelines Inc. |
| Express | Express Pipeline Limited Partnership |
| FERC | Federal Energy Regulatory Commission |
| Foothills | Foothills Pipe Lines Ltd. or Foothills Pipeline (Sask.) Ltd. |
| FT | Firm Transportation |
| FT-RAM | Firm Transportation Risk Alleviation Mechanism |
| FT-SN | Firm Transportation - Short Notice |
| Gateway | Gateway Pipeline Inc. |
| GDP | Gross domestic product |
| GiC | Governor in Council |
| IGUA | Industrial Gas Users Association |
| Imperial | Imperial Oil Limited |
| Irving/Repsol | Irving Oil Company Limited and Repsol YPF |
| Kinder Morgan | Kinder Morgan Canada Inc. |
| LNG | Liquefied Natural Gas |
| LSr | Light Sour |
| M&NP | Maritimes & Northeast Pipeline Management Ltd. |
| Mackenzie | Mackenzie Gas Project |
| Moody's | Moody's Canada Inc. |
| NEB or Board | National Energy Board |
| NGL | Natural Gas Liquid |
| Northern Border | Northern Border Pipeline Ltd. |
| OEB | Ontario Energy Board |
| PADD | Petroleum Administration Defense Districts |
| PCOG | Petro-Canada Oil and Gas |
| PECL | PPM Energy Canada Ltd. |
| PHMSA | U.S. Department of Transportation Pipeline and Hazardous Materials Safety Administration |
| PNGTS | Portland Natural Gas Transmission System |
| PSE | Pump Station Expansion |
| ROE | Return on Common Equity |
| S&P | Standard & Poor's |
| Terasen | Terasen Pipelines Inc. |
| T-South | Westcoast's Southern Mainline (Zone 4) |
| TNPI or Trans-Northern | Trans-Northern Pipeline Inc. |
| TMI | Trans Mountain Pipeline Inc. |
| TQM | Trans Québec & Maritimes Pipeline Inc. |
| TransCanada or TCPL | TransCanada PipeLines Limited |
| U.S. | United States |
| Union Gas | Union Gas Limited |
| WCSB | Western Canada Sedimentary Basin |
| WCS | Western Canada Select |
| Westcoast | Westcoast Energy Inc. |
| WTI | West Texas Intermediate |
Units
| b/d | Barrels per day |
| Mb/d | Thousand barrels per day |
| MMb/d | Million barrels per day |
| Bcf | Billion cubic feet |
| MMcf/d | Million cubic feet per day |
| GJ | gigajoule |
| m³/d | kilomètre |
| 10³m³/d | Thousand cubic metres per day |
| MW | Megawatt |
| km | Kilometres |
Foreword
The National Energy Board (the NEB or the Board) is an independent, quasi-judicial federal agency whose purpose is to promote safety and security, environmental protection and efficient energy infrastructure and markets in the Canadian public interest[*] within the mandate set by Parliament in the regulation of pipelines, energy development and trade. The NEB is an active, effective and knowledgeable partner in the responsible development of Canada’s energy sector for the benefit of Canadians.
The Board’s main responsibilities include regulating:
- the construction and operation of interprovincial and international oil and gas pipelines;
- tolls and tariffs on these pipelines;
- international power lines;
- the imports of natural gas and the exports of natural gas, oil, natural gas liquids (NGLs) and electricity; and
- oil and gas exploration and development on frontier lands and offshore areas not covered by provincial or federal management agreements.
This report marks the fourth year that the Board has provided an assessment of the Canadian pipeline transportation system. This report utilizes data from various publicly available sources which are collected and monitored by Board staff in addition to throughput data supplied by the pipeline companies. The Board also benefited from discussion with various companies and associations. Comments by all parties were taken into consideration in the preparation of this report.
Any comments on the report or suggestions for further analysis can be directed to:
Christian Rankin
Commodities Business Unit
National Energy Board
Telephone: 1 800-899-1265
Email: christian.rankin@cer-rec.gc.ca
If a party wishes to rely on material from this report in any regulatory proceeding, it can submit the material as it can any public document. In such a case, the material is in effect adopted by the party submitting it and that party could be required to answer questions on it.
Information about the NEB, including its publications, can be found on the Board’s website: www.neb-one.gc.ca.
Executive Summary
Energy is essential to our daily lives. The ability of the pipeline transportation system to deliver energy in the form of natural gas, natural gas liquids (NGLs), crude oil, and petroleum products is critical to Canada's economic well-being. Canadians depend on this infrastructure for a safe, reliable, and efficient energy supply.
The approximately 45 000 km of pipelines regulated by the NEB are a key element in Canada's pipeline transportation system. The purpose of this report is to determine how well these elements are working to ensure that the Board's Goal 3, "Canadians benefit from efficient energy infrastructure and markets", is being achieved.
The Board believes that the following outcomes are important characteristics of a well functioning pipeline transportation system:
- there is adequate pipeline capacity in place to move products to consumers who need them;
- pipeline companies provide services that meet the needs of shippers at just and reasonable prices; and
- pipeline companies have adequate financial strength to attract capital on terms and conditions that enable them to effectively maintain their systems and build new infrastructure to meet the changing needs of the market.
Based on the material discussed in this report, the Board believes that the Canadian pipeline transportation system continues to work effectively. The specific conclusions are as follows:
- Capacity is tight on oil pipelines. While there is some spare capacity on some oil pipeline systems, there were periods of apportionment in 2007. The market's view is that additional capacity is required to accommodate growing supply and to provide greater market flexibility. This is best demonstrated by the number of announced and proposed pipelines and expansions to both traditional markets and new markets such as the U.S. Gulf Coast and offshore Asia and California.
There is adequate capacity in place on existing natural gas pipelines. Most NEB-regulated gas pipelines have some excess capacity, even during the peak winter season. Pipeline utilization declined for most pipelines in 2007. Stagnating or declining conventional supply from the WCSB, growing demand within western Canada, and competition from other supply basins, particularly in the western U.S., resulted in reduced flows on pipelines transporting gas from western Canada. - Shippers continue to indicate that they are reasonably satisfied with the services provided by pipelines. The results of the NEB Pipeline Services Survey again rate the physical reliability of pipeline operations highly, while satisfaction with the level of tolls was again identified as the main area of concern for shippers.
- With respect to financial strength, common equity, fixed-charges coverage and cash flow-to-total debt and equivalents ratios are stable and credit ratings continue to be investment grade. The issue of financial soundness among NEB-regulated pipeline companies and their ability to attract capital is not addressed further in this year's report as the matter of return on equity is currently before the Board in the Trans Québec & Maritimes Pipeline Inc. hearing (RH-1-2008).
There are a significant number of pipeline projects proposed by industry to ensure that the Canadian transportation system has sufficient capacity to serve new and growing markets. The challenge for the pipeline industry is to put appropriate capacity in service corresponding with changes in production and market requirements. For this to happen, there must be adequate and predictable lead times to achieve sufficient market support from amongst competing proposals, seek regulatory approvals, and if and when these are obtained, arrange financing, mobilize labour and materials, and construct facilities.
A key component and ongoing challenge from the NEB's perspective is to provide a fair and effective process that engages Canadians meaningfully in the discussion related to determining the necessity and public convenience of industry proposals.
Energy is essential to our daily lives. The ability of the pipeline transportation system to deliver energy, in the form of natural gas, natural gas liquids (NGLs), crude oil, and petroleum products is critical to Canada's economic well-being. In 2007, approximately $121 billion
1. Introduction
worth of products were moved through NEB regulated pipelines to markets at home and in the United States (U.S.). The cost in 2007 of providing these transportation services is estimated to be around $4.9 billion, not including the fuel costs paid by shippers on natural gas pipelines.
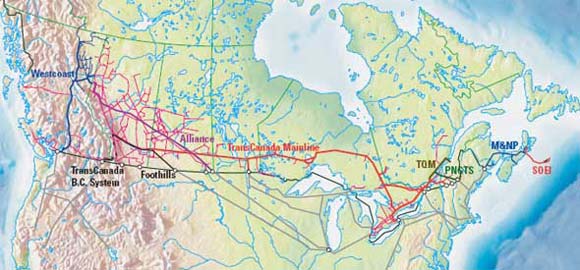
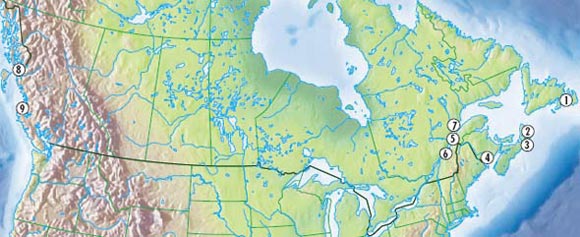
Canadians depend on this infrastructure for a safe, reliable, and efficient energy supply. The approximately 45 000 km of natural gas and oil pipelines regulated by the NEB are a key element in Canada's hydrocarbon transportation system (Figures 1.1 and 1.2). These include cross-country, natural gas, NGL, and crude oil and oil products pipelines.
Figure 1.1 - Oil Pipelines Regulated by the NEB
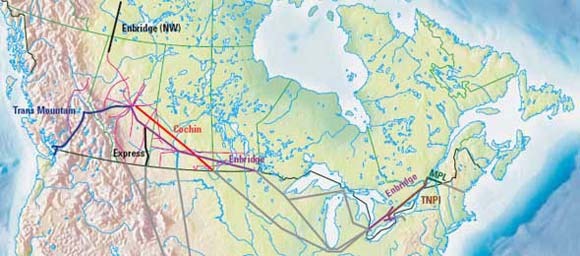
Figure 1.2 - Natural Gas Pipelines Regulated by the NEB
In line with its mandate to promote safety and security, environmental protection and efficient energy infrastructure and markets in the Canadian public interest[*], the Board has identified five goals that articulate its purpose and core objectives:
1. NEB-regulated facilities are safe and secure, and are perceived to be so.
2. NEB-regulated facilities are built and operated in a manner that protects the environment and respects the rights of those affected.
3. Canadians benefit from efficient energy infrastructure and markets.
4. The NEB fulfills its mandate with the benefit of effective public engagement.
5. The NEB delivers quality outcomes through innovative leadership and effective support processes.
To determine whether the goals are being achieved, the Board has established various measures and a system of monitoring for each goal. Each year, the Board also issues various reports that discuss these different aspects of Canadian energy infrastructure and activities. This report focuses largely on aspects of Goal 3, and provides an update on the Board's assessment of how well the Canadian pipeline system is working. This report marks the fourth consecutive year for this assessment and utilizes the system of monitoring and measurements for the performance of the transportation system that was established in previous years. For the pipeline transportation system to function efficiently and effectively, it must operate in a safe and environmentally acceptable manner, which relates to Goals 1 and 2. The Board reports annually on the performance of NEB-regulated pipelines in these areas in a companion report entitled, Focus on Safety and Environment - A Comparative Analysis of Pipeline Performance 2000-2006. The report was published in July 2008.
The Board believes that the following outcomes are important characteristics of a well functioning pipeline transportation system:
- there is adequate pipeline capacity in place to move products to consumers who need them;
- pipeline companies provide services that meet the needs of shippers at just and reasonable prices; and
- pipeline companies have adequate financial strength to attract capital on terms and conditions that enable them to effectively maintain their systems and build new infrastructure to meet the changing needs of the market.
In general, an efficient pipeline transportation system will have the ability to respond on a timely basis to changing market conditions. This may entail adjustments to pipeline capacity or enhancement of pipeline services.
To assess the extent to which these outcomes are achieved, the Board uses publicly available data for Group 1 regulated companies and Express Pipeline Limited Partnership (Express), the largest Group 2 company.[3] These companies represent the major NEB-regulated pipelines and provide a good view of the overall functioning of the pipeline transportation system. In addition, the Board uses throughput and capacity information received from the pipelines and input from the users of NEB-regulated pipelines. Although the majority of information presented in this report is an update and assessment for 2007, where available 2008 information is also provided. A listing of the companies regulated by the NEB, as of 31 December 2007, can be found in Appendix 1.
[3] For the purpose of the Board's financial regulation, pipeline companies are divided into two groups, Group 1 and Group 2. Historically, major oil and gas pipeline companies were designated as Group 1 and generally actively regulated by the NEB, and all other NEB-regulated pipelines were designated as Group 2 and subject to a lighter degree of regulation. However, since Express, some major pipelines have been designated Group 2.
This report should not be viewed as a regulatory decision. In this report the Board is not making a determination on regulatory matters such as the appropriate rate of return on equity that should be earned by pipeline companies. The factors used to assess the functioning of the transportation system are not necessarily the same as those that are applied in a regulatory proceeding.
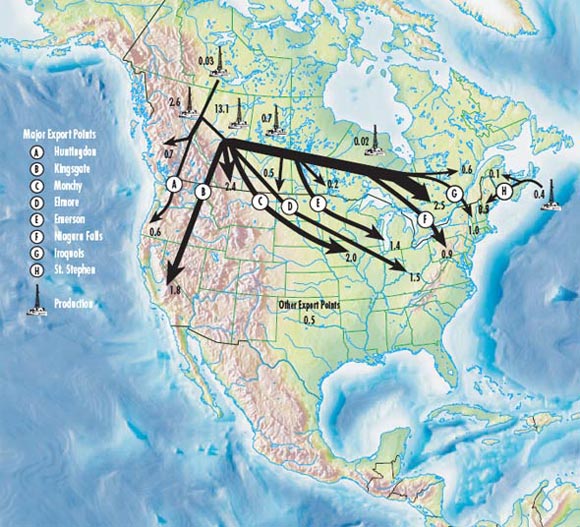
Figure 1.3 and Figure 1.4 provide an overview of the supply and disposition of crude oil and natural gas in Canada. More information on the supply and disposition of energy in Canada can be found in the Board's report entitled, Canadian Energy Overview 2007, published in May 2008.
Figure 1.3 - 2007 Supply and Disposition of Crude Oil (Thousand m³/d)
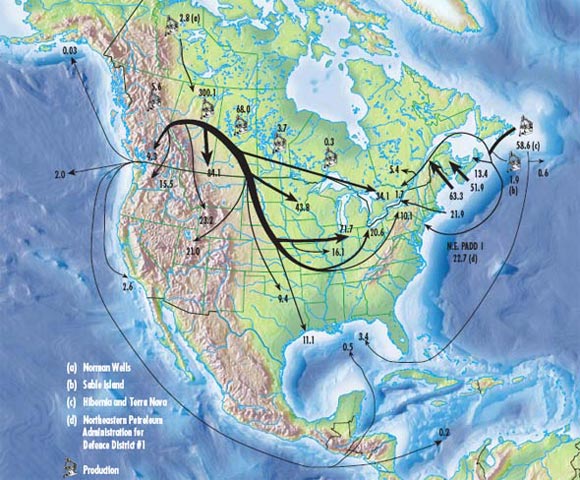
Figure 1.4 - 2007 Supply and Disposition of Natural Gas (Bcf/d)
2. Adequacy of Pipeline Capacity
A key measure of an energy market's operational efficiency is the ability of its pipeline system to adequately transport crude oil, refined products, natural gas and NGLs from producing to consuming regions as required.
This chapter will examine the following factors to assess the current adequacy of pipeline capacity:
- price differentials compared with firm service tolls for major transportation paths;
- capacity utilization on pipelines; and
- the degree of apportionment on major oil pipelines.
The Board has generally taken the view that some excess capacity on a pipeline is desirable. This may result in higher tolls for shippers; however, the costs associated with inadequate pipeline capacity can be far greater. Substantial revenue loss for producers and governments can result when producers are unable to move their oil and gas to market. In addition, excess capacity allows shippers the flexibility to access the appropriate markets with the right product, thereby maximizing their revenues. For example, in the case of oil transportation, if there is inadequate pipeline capacity to transport crude oil to the U.S. PADD V (West Coast), producers have the option of transporting crude oil to Ontario, PADD II (U.S. Midwest), southern PADD II (Cushing, Oklahoma), PADD III (U.S. Gulf Coast) or PADD IV (U.S. Rockies). As well, during periods when refineries are in turnaround (maintenance) in any of these locations, producers can deliver crude oil volumes to other markets, provided there is adequate pipeline capacity.
2.1 Price Differentials and Tolls
When there is adequate pipeline capacity between two market hubs, commodity prices will be connected and the price differential will be equal to, or less than, the transportation costs between the two points. As long as the price differential is less than the toll (plus fuel for natural gas pipelines), the market is indicating that there is adequate pipeline capacity between the two pricing points. In a market with adequate capacity, suppliers would generally direct their product to the market that nets the highest revenue back to the seller, thereby meeting that region's need for energy. Where inadequate capacity exists, the product cannot get to market, resulting in higher prices for downstream consumers or lower prices to producers, creating a higher differential in price between the two end points.
2.1.1 Price Differentials and Tolls on Oil Pipelines
Figure 2.1 illustrates the Canadian export price of light crude oil netted back for tolling charges to Edmonton, Alberta compared with the Edmonton par posted price. The two prices track closely, indicating that the market is working and that, overall, adequate pipeline capacity did exist in 2007 to transport western Canada supply.
Figure 2.1 - Light Sweet Crude Export Price vs. Edmonton Par
Figure 2.2 illustrates the Canadian export price of heavy crude oil netted back for tolling charges to Hardisty, Alberta compared with the Western Canada Select (WCS) price at Hardisty. The two prices track closely, indicating that the market is working and that, overall, adequate pipeline capacity did exist in 2007 to transport western Canada supply. Most of the small variation between the two prices can be explained by the quality difference between the average heavy oil exported and WCS.
Figure 2.2 - Heavy Crude Export Price vs. WCS at Hardisty
Light-heavy Price Differentials
The price differentials for crude oil are determined by a number of factors including availability of pipeline capacity, supply and demand fundamentals, seasonality and the grade (quality) of crude oil. Rising oil sands production is having an increasing impact on price differentials and the operation of oil pipelines. Oil sands crude oil is a heavier bitumen blend (heavy crude oil) and, unless upgraded, has a limited market because it requires specially equipped refineries to process it into useable refined products. This limited access exerts downward pressure on heavy crude oil prices and widens the light-heavy differential during certain times of the year.
Historically, the discussion on price differentials has typically revolved around heavy crude oil; however, with increased production of upgraded bitumen or light synthetic crude oil, the relative price differentials between synthetic crude oil, Canadian light crude oil, and other crude oil supplied to U.S. refineries is becoming an increasingly important issue. Largely as a result of increased synthetic crude oil production and limited pipeline capacity to downstream markets, price discounts have also been observed on Canadian synthetic and light crude oil. During periods of constrained supply because of planned and unplanned maintenance at upgraders, however, synthetic crude oil has traded at a premium to West Texas Intermediate (WTI).
Figure 2.3 illustrates the light-heavy differential as indicated by the difference or gap in the average price paid for Edmonton Par light crude oil and the posted price of Western Canadian Select (WCS), a heavy crude oil blend at Hardisty, Alberta. As illustrated, the differential has been wide and volatile. There was some narrowing between September 2006 and March 2007 largely in response to the reversal of the Spearhead and Mobil pipelines, which opened markets for heavy oil in Cushing, Oklahoma and the U.S. Gulf Coast, respectively.
Figure 2.3 - Canadian Crude Oil Prices and Differential
In 2007, the differential widened to the second highest level this decade, and in December rose to 45 percent or $40 per barrel. This was due to a combination of tight pipeline capacity and refinery problems in the U.S. that caused an over-supply of heavy crude oil in the market. Historically, the normal price differential between light and heavy crude oil in markets where western Canadian oil competes has been around 30 percent. In the first quarter of 2008, the light-heavy differential was 22 percent. This narrowing was a result of an increase in demand for heavier crude heading into the spring and summer months for the production of asphalt and higher demand in southern markets, including the U.S. Gulf Coast refineries which are able to process heavier crudes.
2.1.2 Price Differentials and Natural Gas Firm Service Tolls
In order to use price differentials as an indicator of the adequacy of natural gas pipeline capacity, there must be reasonably good pricing data available. Two examples of price differentials compared with firm service tolls are provided below - one for transportation on TransCanada PipeLines Limited (TransCanada or TCPL) Mainline and one for transportation on Westcoast Energy Inc. (Westcoast), now operating as Spectra Energy Transmission.
Figure 2.4 shows the price differential between Alberta and the Dawn, Ontario delivery point compared with the TransCanada firm service toll between the two points, including fuel costs. The price differential between Alberta and the Dawn delivery point is generally below the total cost of transportation (firm transportation plus fuel) via the TransCanada pipeline connecting these two markets. This indicates that pipeline capacity is adequate between these locations. As indicated by the variation in the price difference between the two locations, natural gas pricing is very responsive to relatively small changes in flow or demand. Times of exceptional natural gas demand in eastern markets, such as the summer heat waves of 2005 and 2006 that produced a strong demand for natural gas-fired power generation for air conditioning in eastern markets, or reduced supplies from the Gulf of Mexico in the months following hurricanes Katrina and Rita (August 2005 to January 2006), have resulted in short-term increases in the price differential. Conversely, mild weather and ample gas in storage can cause the price differential and the demand for gas and transportation services to moderate, such as occurred in the early part of the 2006/2007 winter heating season and in September 2007. In the fall of 2007, prices began to rise once again as the winter heating season commenced. The anticipation of cold weather, which results in increased heating demand, puts upward pressure on the price for natural gas throughout the first part of winter.
Figure 2.4 - Alberta-Dawn Price Differential vs TransCanada Toll and Fuel
Figure 2.5 shows the price differential between Compressor Station 2 on the Westcoast system and the export point at Huntingdon/Sumas, British Columbia compared with the firm service toll for transportation between the two locations (T-South or Southern Mainline), including fuel costs. Since January 2003, except for the peak winter months in recent years, the price differential has been lower than the cost of transportation, indicating that there has been adequate capacity in place. Overall, the comparison of price differential and natural gas firm service tolls shows that pipeline capacity between these markets is adequate at most times. However, natural gas pricing is volatile. Short-term increases in the price differential have been observed in recent years as a result of changes to market conditions such as hurricane-induced supply disruptions in the U.S., unpredictable weather-related demand, and availability of other transportation options during such periods.
Figure 2.5 - Sumas-Station 2 Price Differential vs. Westcoast T-South Toll and Fuel
Overall, the comparison of price differentials and natural gas firm service tolls indicates that pipeline capacity between these markets is adequate at most times. In general, the price differential between pricing points has been slightly lower than the cost of pipeline transportation (tolls) and fuel. However, natural gas prices can fluctuate in response to weather and other disruptions and can impact both price differentials and pipeline fuel costs. Pipeline tolls tend to be more constant. Figures 2.4 and 2.5 both indicate occasions where the price differential exceeded transportation (toll) and fuel costs. These events proved to be temporary and gas flows and prices moderated.
2.2 Capacity Utilization on Major Routes
Where adequate pricing data is not available at major receipt and delivery locations on pipeline systems, another measure of adequate capacity comes from directly comparing the throughput or flow on the pipeline with its capacity. The Board monitors capacity utilization for most of the large pipelines it regulates.
The following figures show pipeline average monthly throughput compared with capacity for some of the largest NEB-regulated pipeline systems.
2.2.1 Oil Pipelines
Determining the capacity and throughput on an oil pipeline can be complex as there are many factors to be considered including the type of product, product mix, type of batching and pipeline configurations.
The Enbridge system (Enbridge Pipelines Inc.) originates at Edmonton, Alberta and extends east across the Canadian prairies to the U.S. border near Gretna, Manitoba where it joins with the Lakehead system in the U.S. It is the largest crude oil pipeline in the world and the primary transporter of crude oil from western Canada to markets in eastern Canada and the U.S. Midwest. The Enbridge system also connects with pipelines that deliver crude oil to Cushing, Oklahoma and the U.S. Gulf Coast. The system consists of many lines transporting crude oil, NGLs and refined petroleum products. Figure 2.6 illustrates Enbridge throughput versus capacity out of western Canada. Since the third quarter of 2006, many of its lines have been operating at or near full capacity with some lines in apportionment (see Section 2.3). In 2007, Enbridge transported roughly 255 000 m³/d (1.6 MMb/d) of crude oil, petroleum products and NGLs. In the first quarter of 2008, Enbridge operated at about 88 percent of capacity.
Figure 2.6 - Enbridge Pipeline Throughput vs. Capacity
Trans Mountain Pipeline Inc. (TMI) transports crude oil and refined petroleum products from Edmonton, Alberta west to locations in British Columbia, Washington State and offshore. TMI's current capacity, assuming some heavy crude oil, is 41 300 m³/d (260 Mb/d). The pipeline has been operating at or near capacity for several years and on many occasions has been under apportionment (see Section 2.3). Figure 2.7 shows two capacities for the TMI pipeline; one assumes no shipments of heavy crude oil and the other assumes 15 percent heavy crude oil. When heavy crude oil is shipped, it reduces the capacity of the pipeline. On average, in 2007 approximately 25 percent of TMI's crude oil receipts at Edmonton were heavy crude oil. In the second quarter of 2007, the capacity on TMI increased by 5 600 m³/d (35 Mb/d) with the addition of the Pump Station Expansion Project.
Figure 2.7 - Trans Mountain Pipeline Throughput vs. Capacity
TMI announced in early 2008 that it would add an additional 4 000 m³/d (25 M/d) of incremental capacity on 1 May 2008 and another 2 400 m³/d (15 Mb/d) on 1 November 2008, increasing its total capacity to 48 000 m³/d (300 Mb/d). Originally, the looping of the pipeline was to be in-service in the fourth quarter 2008 for the entire 6 400 m³/d (40 Mb/d). The project was re-scoped and some of the additional capacity was added six months earlier than initially planned.
For most of 2007 and in January 2008, TMI was under apportionment. In the first quarter of 2008, the pipeline operated at about 80 percent of capacity. This was largely due to scheduled refinery maintenance on the west coast and unplanned outages at Edmonton refineries that reduced throughputs of refined petroleum products. Growing oil sands production, strong demand from refiners in Washington State and continuing growth in crude oil shipments off the Westridge Dock are contributing to apportionment on the TMI system.
Express has not been operating at its capacity of 44 900 m³/d (280 Mb/d) over the past several years due in part to apportionment downstream on the Platte Pipeline. In the first quarter of 2008, the pipeline operated at approximately 73 percent of capacity (Figure 2.8). Express is the only crude oil pipeline in western Canada that operates under long-term take-or-pay agreements with its shippers for a majority of its capacity.
Figure 2.8 - Express Pipeline Throughput vs. Capacity
Trans-Northern Pipelines Inc. (Trans-Northern or TNPI) transports refined petroleum products west from Montreal to Toronto and operates bi-directionally between Toronto and Oakville, Ontario. TNPI also transports refined products from Imperial Oil Limited's (Imperial) refinery at Nanticoke, Ontario east to Toronto. Figure 2.9 shows that in the first quarter of 2008, TNPI throughput averaged 33 900 m³/d (214 Mb/d) of petroleum products. The pipeline is generally operating at capacity.
Figure 2.9 - Trans-Northern Pipeline Throughput
The capacity of TNPI is difficult to calculate because it has multiple delivery locations and different capacities on each segment of the pipeline. For example, from Montreal to Farran's Point, the capacity is 21 000 m³/d (132 Mb/d); from Farran's Point to Belleville, the capacity is 11 500 m³/d (72 Mb/d); and, from Belleville to Toronto, the capacity is 10 000 m³/d (63 Mb/d).
2.2.2 Natural Gas Pipelines
Figure 2.10 compares the average monthly throughput on the TransCanada Mainline (which is approximately equal to the amount of gas flowing east on the Mainline from Saskatchewan) to the capacity of TransCanada's prairie line. This comparison illustrates that there has consistently been capacity in excess of throughput volumes over the time period shown. The excess capacity even persisted through the period of July 2005 to July 2006, which included two hotter-than-normal summers that produced strong demand for natural gas for power generation in eastern markets and greater demand for Canadian gas due to production losses in the U.S. stemming from the late summer hurricanes of 2005.
Figure 2.10 - TransCanada Mainline Throughput vs. Capacity
Overall, the indicator shows that there has been adequate pipeline capacity to move volumes to eastern markets. Excess capacity, which averaged 40 million m³/d (1.4 Bcf/d) between 2002 and 2006, provided an impetus for the TransCanada Keystone Pipeline project. In this initiative, TransCanada proposed to transfer Line 100-1 of the Mainline to TransCanada Keystone Pipeline GP Ltd. for conversion to oil service. This transfer and conversion was approved by the Board in 2007. It is anticipated that the line will be fully removed from gas service by September 2008 resulting in an annual average capacity reduction on the Mainline of approximately 14.2 million m³/d (0.5 Bcf/d).
Capacity utilization on the TransCanada Mainline was approximately 76 percent in 2007, with an excess capacity of 41.6 million m³/d (1.47 Bcf/d). Increased consumption of natural gas in Alberta, combined with a slip in Western Canada Sedimentary Basin (WCSB) production in the second half of the year by an average of about 11.3 million m³/d (0.4 Bcf/d) contributed to the lower throughput on pipelines leaving Alberta for eastern markets in 2007. Increased flows of natural gas from the Gulf of Mexico, including Liquefied Natural Gas (LNG) imports, helped to meet demand for gas in the U.S. Midwest and eastern markets. In 2007, average LNG imports into the U.S. were 60 million m³/d (2.1 Bcf/d), 14.2 million m³/d (0.5 Bcf/d) above imports in 2006.
The volumes shown in Figure 2.11 are the average monthly throughput on the Foothills Pipeline (Sask.) Ltd. (Foothills Sask.) pipeline compared with its capacity. This pipeline transports western Canadian gas supply to markets in the U.S. Midwest through a connection with the Northern Border Pipeline Ltd. (Northern Border) at Monchy, Saskatchewan. Foothills Sask. throughput has displayed distinct seasonal patterns in recent years, with annual average capacity utilization running at 83 percent in 2007, down from an average of 94 percent in 2003. Throughput on the Foothills Sask. pipeline runs fairly close to capacity in both the winter and the summer months to meet winter heating demand and to meet summer demand for power generation and storage injection. Throughput subsequently declines in the low-consumption spring and fall months.
Figure 2.11 - Foothills Sask. Throughput vs. Capacity at Monchy
Throughput on the Foothills Sask. system during the winter 2006-07 was 83 percent of capacity and although summer 2007 throughput was higher, at about 90 percent, it was lower than seen in previous years. Similar to the TransCanada Mainline, the combination of increased consumption of natural gas in Alberta and lower WCSB production resulted in less gas available to ship on the Foothills Sask. system in 2007.
Figure 2.12 compares the average monthly throughput on Westcoast's Southern Mainline with the capacity on this system between Station 2 and the export point at Huntingdon/Sumas, British Columbia. This figure shows the seasonal nature of throughput on the Southern Mainline with higher volumes being transported during the peak winter months and less during the summer. Contributing factors to the low flows on Westcoast in recent years include greater competition with production from the U.S. Rockies region for markets in the U.S. Pacific Northwest, mild winter weather, and increased hydro power generation in British Columbia and the U.S. Pacific Northwest. Flows, however, are up slightly in 2007 compared to 2006 due to increased weather-related demand and increased demand for natural gas for power generation in both California and the U.S. Pacific Northwest. Overall on the system, flows eastward from the WCSB have declined, while flows westward have increased slightly.
Figure 2.12 - Westcoast Mainline Throughput vs. Capacity
Figure 2.13 shows the average monthly capacity and throughput on the Foothills Pipe Line (South B.C.) Ltd.[4] (Foothills South B.C.) system, which primarily serves California. The annual average capacity utilization in 2007 was 68 percent, slightly higher than in previous years. There exists spare capacity on this pipeline to export gas through Kingsgate, British Columbia. California market players have transportation options enabling them to access supply from the Rocky Mountains, San Juan and Permian basins, in addition to the WCSB. This supply competition has reduced demand for imports from the WCSB at Kingsgate.
[4] TransCanada's BC System was integrated into Foothills Pipe Lines Ltd. in 2007. In first quarter 2007, the NEB approved the transfer of assets and finalized the revised tolls for 2007.
Figure 2.13 - Foothills South B.C. System Throughput vs. Capacity at Kingsgate
Figure 2.14 shows the average monthly throughput on the Alliance Pipeline (Alliance) system relative to physically available capacity. Alliance offers approximately 36.8 million m³/d (1.3 Bcf/d) of firm service capacity and makes any additional capacity available to its contracted shippers at minimal cost as Authorized Overrun Service (AOS). Available AOS levels are determined on a daily basis and may be used at the cost of fuel only. The total available capacity varies, depending on such factors as ambient temperature and compressor unit availability (as influenced by maintenance schedules). Alliance's total available capacity has essentially been fully utilized since the commencement of service, with all available firm service contracted on a long-term basis.
Figure 2.14 - Alliance Throughput vs. Capacity
Figure 2.15 compares the average monthly throughput and capacity on the Trans Québec & Maritimes pipeline (TQM). TQM delivers gas from the TransCanada Mainline at Saint-Lazare on the Ontario and Quebec border to Quebec City and the East Hereford, Quebec export point to New Hampshire. The figure illustrates the seasonality of natural gas consumption and the variable throughput on this pipeline. Each year, greater volumes are transported during the winter months when gas requirement for residential and commercial space heating is higher. Without abundant underground storage in the region, the pipeline system is designed to meet the winter requirement. In the summer, gas consumption and flows are typically much lower, resulting in spare capacity on the pipeline.
Figure 2.15 - Trans Québec & Maritimes Throughput vs. Capacity

Historically, the average annual capacity utilization of the TQM system was approximately 60 percent. In November 2006, the pipeline was expanded by about 12 percent or approximately 2.6 million m³/d (90 MMcf/d) to supply a new gas-fired power co-generation plant at Becancour, Quebec. Higher gas throughput resulting from the growing residential and commercial sectors and new demand from the Becancour plant helped to push average capacity utilization in 2007 up to about 66 percent. However, in late 2007, announced closures of key industries in the Becancour region will result in the mothballing of the Becancour Power Plant and likely lower throughput on the system in 2008.
Figure 2.16 compares the average monthly capacity and throughput on the Maritimes & Northeast Pipeline (M&NP) which delivers natural gas produced from offshore Nova Scotia and onshore New Brunswick to markets in Nova Scotia, New Brunswick and export markets in the U.S. Northeast via an export point at St. Stephen, New Brunswick.
Figure 2.16 - Maritimes & Northeast Pipeline Throughput vs. Capacity
In 2007, the recent trend to declining capacity utilization was reversed as gas production from Sable Island (offshore Nova Scotia) was boosted with the addition and consistent operation of a new compression facility. Also, production from the onshore McCully field in New Brunswick commenced mid-way through the year and has gradually increased to represent about 10 percent of the region's production. As a result, the capacity utilization on M&NP averaged about 80 percent in 2007.
2.3 Apportionment
Oil pipelines typically operate as common carriers, which require shippers to nominate volumes for delivery into a pipeline on a monthly basis without a long-term contract for pipeline capacity. When shippers nominate more oil or oil products in a given month than the pipeline can transport, shipper volumes are apportioned (reduced) based on the tariff in effect. Apportionment can be caused by factors such as growing supply, increased demand, pipeline reconfigurations and refinery maintenance. There are a few pipelines in Canada that operate all or part of the pipeline with long-term shipper take-or-pay agreements, including Express, Enbridge's Line 9 and TNPI.
Apportionment levels for Enbridge, TMI and Cochin (Kinder Morgan Cochin Pipeline Ltd.) are discussed below.
2.3.1 Enbridge
Enbridge has five pipelines that originate in Alberta. Line 1 transports NGLs, synthetic crude oil and refined petroleum products; Line 2 ships light crude oil; Lines 3 and 4 are dedicated to transporting heavy crude oil; and, Line 13 ships light crude oil. Line 13 terminates at Clearbrook, Minnesota while the other lines extend to Superior, Wisconsin where lines 5, 6, and 14 begin and provide service to the market hub of Chicago, Illinois.
Table 2.1 shows Enbridge throughput from March 2007 to March 2008 and that there was no apportionment on the system during this timeframe. In the fourth quarter of 2007, very high throughputs on the Enbridge system resulted in apportionment on Lines 5, 6 and 14 downstream of Superior, Wisconsin. On 28 November 2007, there was an explosion on Line 3 on the Enbridge Lakehead system downstream of Clearbrook, Minnesota which resulted in all Enbridge lines (1, 2, 3 and 4) being immediately shutdown. The explosion occurred during the repair of a small leak that had occurred on the line two weeks prior to the incident and resulted in fatal injuries to two workers. The incident resulted in Lines 1, 2 and 4 being minimally impacted, while Line 3 remained shutdown for three days for repairs. Prior to the incident, all lines were operating at capacity. In November there was seven percent apportionment announced downstream of Superior; however, as a result of the incident, apportionment was lifted. The NEB is working with the U.S. Department of Transportation Pipeline and Hazardous Materials Safety Administration (PHMSA) in order to learn from the investigation of this incident as the results may impact work processes in both the U.S. and Canada.
Table 2.1 - Enbridge Apportionment
| Mar-07 | Apr-07 | May-07 | Jun-07 | Jul-07 | Aug-07 | Sept-07 | Oct-07 | Nov-07 | Dec-07a | Jan-08 | Feb-08a | Mar-08 | |
|---|---|---|---|---|---|---|---|---|---|---|---|---|---|
| Apportionment | 0% | 0% | 0% | 0% | 0% | 0% | 0% | 0% | 0% | 7% | 0% | 3% | 0% |
| Throughput (10³m³/d) | 259.7 | 253.4 | 238.7 | 235.3 | 249.9 | 259.6 | 250.3 | 253.4 | 265.5 | 266.9 | 271.5 | 264.0 | 254.7 |
a) Lines 5, 6a and 14 - Operational factors resulted in apportionment being later lifted.
As noted, there was no apportionment on the Enbridge system in the first quarter of 2008; however, many of the lines have been either fully subscribed or operating at maximum capacity. In February of 2008 there was apportionment announced downstream of Superior, Wisconsin; however, this apportionment was revoked on 12 February. Capacity on the system is partly constrained since Enbridge can deliver up to 300 000 m³/d (1.9 MMb/d) to Superior but capacity out is currently only 234 600 m³/d (1.475 MMb/d). Enbridge is, however, able to transport more crude oil out of western Canada than can be delivered downstream of Superior because it makes deliveries to facilities along the pipeline route. For example, at Clearbrook, Minnesota it delivers crude oil into the Minnesota Pipeline where it is transported to the Flint Hills and Marathon Ashland refineries located in St. Paul, Minnesota.
Enbridge throughput fell slightly in the third quarter of 2007 as a result of unplanned refinery outages in the U.S. In the fourth quarter of 2007, the return of refineries from maintenance and Syncrude's Coker 8-3 from a 30-day shutdown resulted in increased throughputs on the line. In the first quarter of 2008, particularly the month of February, throughputs were down as a result of extreme cold temperatures in Alberta that impacted some oil sands operations. It is expected that increasing production from the oil sands in 2008 could contribute to further tightening of pipeline capacity on Enbridge.
Enbridge's Line 9 has a capacity of 38 150 m³/d (240 Mb/d) and transports crude oil from Montreal, Quebec to refineries located at Nanticoke and Sarnia, Ontario. There was no apportionment on Line 9 between March 2007 and March 2008. Shipments on Line 9 have been trending downward, particularly since the closure of Petro-Canada's refinery in Oakville, Ontario in the second quarter of 2005. In 2007, the reduction in throughput was a result of maintenance activity at Imperial's Sarnia and Nanticoke's refineries in the second quarter and an increase in deliveries of more competitively priced western Canadian crude oil. Brent crude oil, which is the price setter for light crude oil produced in the North Sea, traded at a premium to WTI in the first quarter of 2007 making western Canadian crude oil more competitive for refiners in Ontario.
In March 2007, Enbridge held an open season for Phase 1 of a two-phased expansion of the Spearhead pipeline which extends from the Chicago area (Griffith, Indiana) to Cushing, Oklahoma. The incremental 10 300 m³/d (65 Mb/d) would increase the pipeline's average annual capacity to 30 150 m³/d (190 Mb/d) and is expected to be completed in 2009. At that time, the origination point of the Spearhead pipeline will shift from Griffith, Indiana to Flanagan, Illinois. The expansion was initiated by industry because both the ExxonMobil Pipeline that transports crude oil to the U.S. Gulf Coast and the Spearhead Pipeline were over subscribed. This further demonstrates the need for oil sands producers to have diverse market options and for pipeline companies to be creative in meeting these needs.
In 2007, Enbridge filed a number of applications with the Board for expansions of existing infrastructure and new pipeline construction. In addition, several applications were filed in the U.S.
On 9 March 2007, Enbridge filed an application to transfer Enbridge Pipeline's Line 13 to Enbridge Southern Lights; remove Line 13 from southbound crude oil service; reverse the flow of Line 13 to transport diluent northward; expand Line 2; and, construct a new 505 km crude oil pipeline from Cromer, Manitoba to Clearbrook, Minnesota, to transport light sour crude oil. The NEB approved the application on 19 February 2008 and Governor in Council (GiC) approval was granted on 13 May 2008. Line 2 modifications and the LSr (Light Sour) Line are expected to be in-service by the end of 2008. Line 13 is expected to be completed in mid-2010.
On 30 May 2007, Enbridge filed an application with the Board to construct and operate the Canadian portion of the Alberta Clipper pipeline. The Alberta Clipper project is a new 1 607 km oil pipeline that will transport crude oil from Hardisty, Alberta to Superior, Wisconsin. The pipeline will have an initial capacity of 71 500 m³/d (450 Mb/d) with an estimated cost of $2 billion and an in-service date of December 2009. The Board approved the application on 22 February 2008 and GiC approval was granted on 13 May 2008.
On 28 June 2007, the NEB approved Enbridge's application for the Alida to Cromer Capacity Expansion (ACCE) Project with GiC approval granted on 5 September 2007. The ACCE Project consists of the construction of 60 km of pipeline to transport NGLs from Alida, Saskatchewan to Cromer, Manitoba. Following the construction of the new pipeline, the existing Enbridge Westpur pipeline from Alida to Cromer will be converted to transport crude oil rather than the NGLs it currently transports. The Board also approved the application to increase the maximum operation pressure to facilitate this change.
On 15 April 2008, the NEB approved Enbridge's application to upgrade its Line 4; at the time of writing, GiC approval was pending. Enbridge plans to extend its highest capacity line by 180 km, moving the origin of Line 4 from Hardisty, Alberta to Edmonton. The pipeline would match the future Line 4 capacity of 126 500 m³/d (796 Mb/d). The proposed in-service date is early 2009.
2.3.2 Trans Mountain Pipeline Inc.
Apportionment on TMI is calculated separately for deliveries to Burnaby, British Columbia (Domestic Destinations), Washington State pipeline-connected refineries (Export Destinations) and the Westridge Dock, as shown in Table 2.2 as Domestic, Export and Dock. Apportionment between March 2007 and March 2008 reflects continuing increases in oil sands supply, strong demand for Canadian crude oil in the Washington State area and increased shipments over the Westridge Dock. With weakness in the price of WTI and discounting of Canadian crude oil because of over-supply in the Cushing area, coupled with a lack of take away capacity in that region, producers may increasingly look to higher priced west coast and offshore markets for improved netbacks. In 2007, there were more than 20 tanker shipments off the Westridge Dock, largely because of price weakness in the U.S. Midwest (PADD II) and increasing interest in testing western Canadian crude oil in refineries located in Asia.
Table 2.2 - Trans Mountain Apportionment
| Mar-07 | Apr-07 | May-07 | Jun-07 | Jul-07 | Aug-07 | Sept-07 | Oct-07 | Nov-07 | Dec-07 | Jan-08 | Feb-08 | Mar-08 | |
|---|---|---|---|---|---|---|---|---|---|---|---|---|---|
| Apportionmenta | |||||||||||||
| Domestic | 0% | 10% | 0% | 0% | 0% | 0% | 0% | 3% | 0% | 0% | 0% | 0% | 0% |
| Export | 0% | 14% | 0% | 0% | 0% | 0% | 8% | 13% | 3% | 7% | 5% | 0% | 0% |
| Dockb | 0% | 7% | 56% | 87% | 100% | 100% | 100% | 100% | 100% | 100% | 100% | 0% | 0% |
| Throughput (10³m³/d) | 38.4 | 45.6 | 46.0 | 44.3 | 44.6 | 46.6 | 44.8 | 44.7 | 43.4 | 40.1 | 41.7 | 36.7 |
a) As per apportionment notices.
b) Dock numbers at 100% reflect full utilization.
Due to the unique nature of the shipments, volumes destined to the Westridge Dock are nominated and allocated based on vessel size. In April 2006, the NEB approved the inclusion of a Westridge Dock premium bid process in the TMI tariff for allocating capacity to the Westridge Dock. In the Board's decision, released on 20 July 2006, Kinder Morgan was directed to set up a deferral account for any Premiums received and refund the money to toll payers in the following calendar year, and to publish the aggregate bid premium information on a quarterly basis. The decision also approved the extension of the bid premium process until the start-up of the Pump Station Expansion project (PSE) which became operational in April 2007.
To accommodate the PSE capacity, the Board approved TMI's request to increase the allocation to each of its destinations by approximately one third, and an additional 1.7 percent to the Westridge Dock, with the approved allocations to remain in place until the start-up of TMI's Anchor Loop Expansion project.
In March 2008, TMI filed an application with the Board requesting approval of final 2008 tolls. As the proposed 2008 tolls did not include the premiums collected in 2007, the Board denied TMI's request and directed the company to submit either a toll that included the premium or an application to vary the Board's previous decision. In the same month, TMI submitted an application requesting approval of changes in its Rules and Regulation Tariff regarding capacity allocations and procedures to accommodate the 3 980 m³/d (25 Mb/d) of incremental pipeline capacity from Phase 1 of the Anchor Loop Expansion Project. The Board approved the requested revisions to the capacity allocations on a temporary basis and established a written process for submitting comments on the proposed allocations and procedures.
2.3.3 Cochin
In January 2007, Kinder Morgan Energy Partners purchased from BP Canada Energy Company (BP) the remaining approximately 50 percent of Cochin Pipeline that it did not already own. Prior to the purchase, BP operated the pipeline and owned just over 50 percent.
The Cochin pipeline is the largest and longest NGL pipeline in Canada. In the past, it has transported propane, ethane, ethylene and butane, although no butane has been shipped since 2002. Ongoing maintenance work on the pipeline has affected the available capacity; however, there has not been apportionment on Cochin since summer 2005 when the pipeline was forced to shut down for immediate repairs (Table 2.3).
Table 2.3 - Cochin Apportionment
| Mar-07 | Apr-07 | May-07 | Jun-07 | Jul-07 | Aug-07 | Sept-07 | Oct-07 | Nov-07 | Dec-07 | Jan-08 | Feb-08 | Mar-08 | |
|---|---|---|---|---|---|---|---|---|---|---|---|---|---|
| Apportionment | 0% | 0% | 0% | 0% | 0% | 0% | 0% | 0% | 0% | 0% | 0% | 0% | 0% |
| Throughput (10³m³/d) | 5.9 | 4.4 | 3.9 | 3.9 | 4.8 | 5.1 | 5.6 | 6.4 | 5.9 | 5.2 | 5.6 | 4.0 |
Since March 2006, Cochin has operated at a voluntary pressure reduction due to a defect found in the U.S. portion of the pipeline. This pressure restriction, not to exceed 900 psi, applied to the entire line from Fort Saskatchewan, Alberta to Windsor, Ontario and was to be in effect until the fall of 2007. In September 2007, this restriction was extended until 1 April 2008. Ethylene shipments, because of high vapour pressure, were suspended until further notice.
On 28 September 2007, Kinder Morgan announced that it would cease moving ethane on the Cochin system effective 1 October 2007 until 1 April 2008. This further extended the announcement made by Cochin on 8 February 2007 that it would be suspending delivery of ethane effective 31 March 2007, while pipeline integrity issues and the related capital expenditures are being evaluated.
2.4 Chapter Summary
Under the NEB's Goal 3, a well functioning pipeline transportation system has adequate pipeline capacity in place to move products to consumers who need them. The material discussed in this chapter indicates that, overall, adequate capacity did exist on major NEB-regulated pipelines in 2007.
Oil Pipelines
While capacity utilization indicators show that there was some spare capacity on selected oil and petroleum products pipelines in 2007, this was partially due to production facility outages reducing the amount of crude oil or products to be transported. Despite the production challenges in the oil sands industry in 2007 and early 2008, bitumen levels have increased over the previous year as problems were rectified and new expansions were brought on-line. The production growth in the oil sands and continued strong demand in the U.S. have resulted in very high utilization of capacity on Canadian oil pipelines. In addition, a slight recovery in conventional crude oil production in western Canada, North Dakota and PADD IV are challenging pipeline systems that operate at close to capacity or are in apportionment at times. Export prices for Canadian light and heavy crude oil in 2007 tracked domestic posted prices closely indicating that, although pipeline capacity was very tight and at times some systems were under apportionment, adequate capacity did exist, overall.
Strong growth in the production of heavier blends from the oil sands has impacted the light-heavy price differential, creating the need to develop new and expanded markets. In the fourth quarter of 2007, refinery outages both planned and unplanned, particularly in the key market of the U.S. Midwest, resulted in the differential widening to 40 percent. This widening also explains why there is an increase in heavy crude oil deliveries to offshore markets via the Westridge Dock. Additional pipeline capacity both to the west coast and to the U.S. Midwest should provide additional market outlets for Canadian heavy crude oil.
Natural Gas Pipelines
Overall, the examination of throughput and capacity on NEB-regulated natural gas pipelines shows that pipeline capacity is adequate across the country although there may be occasions of short-term limitation at some points depending upon markets, storage and seasonal shifts. The demand for natural gas varies seasonally and, as a result, the flow of natural gas and utilization of some Canadian pipelines can be variable. Where available, the use of storage helps to stabilize flows and allows pipeline capacity to be used more efficiently.
Pipeline utilization declined for most pipelines in 2007. Declining conventional supply from the WCSB, growing demand within western Canada, and competition from other supply basins, particularly in the western U.S., resulted in reduced flows on pipelines transporting gas from western Canada.
3. Looking Ahead - Proposed Pipelines
An efficient pipeline transportation system should have an ability to respond on a timely basis to changing market conditions. This may invite proposed adjustments to pipeline capacity or enhancement of pipeline services.
3.1 Oil Pipelines
Pipeline expansions and new pipeline construction are being driven by the continued high pace of oil sands development. High crude oil prices are making investments in the oil sands more attractive and Canada's stable political environment is proving to be a strong draw for companies. In 2007, there were a number of joint ventures announced between crude oil producers and U.S. refiners. These arrangements secure markets for Canadian crude oil production and are helping the industry to decide which pipeline projects to support to connect those markets. Market conditions could evolve whereby it would become more economical for refineries located in Ontario that currently take western Canadian crude oil to take more. Refiners in Quebec that do not currently have access could receive western Canadian crude oil through the re-reversal of Enbridge's Line 9, which currently transports crude oil from Montreal to Sarnia. In addition, refineries in PADD I (U.S. Northeast) could also access western Canadian crude if Line 9 is reversed along with a portion of the Portland to Montreal Pipeline which currently operates only in northbound service.
In November 2007, TransCanada filed an application with the Board to expand and extend the Keystone Pipeline. If approved, TransCanada would expand the pipeline's capacity to 94 000 m³/d (590 Mb/d) and extend the U.S. portion from the Nebraska/Kansas border to Cushing, Oklahoma. The current Keystone Pipeline, which was approved by the Board in September 2007 with GIC approval granted on 27 November 2007, has a capacity of 69 000 m³/d (435 Mb/d) and will transport crude oil from Hardisty, Alberta to Wood River and Patoka, Illinois. The Keystone pipeline is jointly owned by TransCanada and ConocoPhillips Pipeline Company.
In 2007, many oil pipeline systems were at or near capacity and at times were under apportionment. As a result of these circumstances, a number of proposals emerged to provide additional pipeline capacity to transport crude oil and to provide additional supplies of diluent required to support growing oil sands operations. This additional pipeline capacity, if approved, will enhance access to markets and increase market penetration of Canadian crude oil. In the short term, however, weak refinery margins, reflecting slowing demand for refined petroleum products in the U.S., could affect refinery investments.
Table 3.1 provides a summary of the numerous proposals to expand or construct new oil pipeline capacity. These proposals include pipelines to transport western Canadian crude oil to the west coast for delivery to Washington State and offshore markets, to the U.S. Midwest and southern PADD II and to the U.S. Gulf Coast. These also include proposals to provide new sources of diluent required for growing oil sands production. It is estimated that together these pipeline projects comprise over $23 billion in capital investment.
In addition to the pipelines described in Table 3.1, TransCanada has announced that it may develop a pipeline proposal to ship crude oil to the U.S. Gulf Coast.
Table 3.1 - Announced and Proposed Canadian Oil Pipelines and Expansions
Pipeline |
Potential Filing Date |
Capacity Increase (Mb/d) |
Proponents' Estimated Completion Date |
Market |
|---|---|---|---|---|
Kinder Morgan |
Approved in Oct 2006 |
25 |
|
PADD V |
TMX2 Expansion TMX3 Expansion |
n/a - Open Season unsuccessful |
100 300 |
2011 2012 |
PADD V Offshore/Far East |
Kinder Morgan |
n/a |
400 |
2012 |
PADD V |
Enbridge Gateway |
n/a |
400/150 |
Between 2012 and 2014 |
PADD V |
TransCanada |
n/a |
400 |
4Q2012 |
California |
Enbridge Line 9 reversal |
213 |
2010 |
eastern Canada |
|
Enbridge Line 5 Expansion |
50 |
3Q2008 |
eastern Canada, PADD I, PADD II |
|
Chinook Pipeline - Maple Leaf (Kinder Morgan & TEPPCO) |
n/a |
440 |
3Q2010 |
U.S. Gulf Coast |
Texas Access Pipeline (TAP) (Enbridge & Exxon Mobil) |
n/a |
445 |
Mid-2011 |
U.S. Gulf Coast |
ExxonMobil/Enbridge |
96 |
2009 |
U.S. Gulf Coast |
|
Enbridge Southern Lights |
Approved 19 February 2008 |
180 |
L2 - 3Q2008 |
Alberta |
TCPL (Keystone) Expansion |
435 |
4Q2009 |
Southern PADD II and PADD III |
As illustrated in Figure 3.1, pipeline capacity is expected to be tight in 2008; however, Kinder Morgan's recent announcement to re-scope its Anchor Loop project to add incremental capacity of 4 000 m³/d (25 Mb/d) on 1 May 2008 and the additional 2 400 m³/d (15 Mb/d) on 1 November will provide some relief, particularly in the second and third quarter of 2008. Beyond 2008, announced pipeline projects exceed forecast supply. It is expected that not all projects will proceed in the proposed timeframes.
Figure 3.1 - Proposed Pipeline Projects and NEB Forecast of Crude Oil Supply
* Total current crude oil pipeline capacity out of the WCSB assuming maximum heavy oil volumes.
** Pump station expansion of 35 Mb/d by 2007 and looping 40 Mb/d by 3Q2008. TMX North would expand capacity by an additional 400 Mb/d but is not shown here.
*** Keystone could be expanded by 155 Mb/d and extended to Cushing, Oklahoma by 4Q2010.
**** [Net crude oil capacity increase of 47 Mb/d by 4Q2008.
3.2 Natural Gas Pipelines
In the coming years, it is expected that North American demand for natural gas will continue to outpace the growth in North American supplies. In Canada, conventional natural gas supply is starting to decline encouraging the development of unconventional gas such as coalbed methane, tight gas and shale gas, LNG imports and interest in the frontier regions to meet growing demand. Significant natural gas demand growth in Canada will mainly be driven by oil sands development in Alberta and new gas-fired electrical generation in Ontario, which will help meet growing electricity demand and displace existing coal-fired electricity generation. Across North America, the major areas of supply expansion are in unconventional gas in the Rockies, the Gulf Coast and Appalachia. There are several projects in the U.S. aimed at connecting these sources and LNG imports to the existing pipeline system.
Table 3.2 summarizes the announced proposals for new NEB-regulated pipelines. In 2007, there were only two newly announced pipeline projects, both of which are designed to gather natural gas produced in British Columbia and transport it to connect with existing pipeline infrastructure in Alberta. There was also notable progress with previously announced projects in eastern Canada following regulatory approvals for the Deep Panuke Pipeline offshore Nova Scotia and the Brunswick Pipeline in New Brunswick. Development of the Deep Panuke Pipeline to move natural gas produced offshore Nova Scotia was initiated following regulatory approvals and final commercial decisions to proceed with the Deep Panuke gas project. In New Brunswick, the Emera Brunswick Pipeline designed to connect the Canaport LNG terminal to the M&NP Mainline was approved and commenced construction in 2007. It is expected to be in-service in late 2008.
Table 3.2 - Canadian Natural Gas Pipeline Proposals
Pipeline |
Location |
Capacity Increase/decrease (Bcf/d) | Proponents' Estimated Completion Date |
Market Impacted |
|---|---|---|---|---|
TransCanada Pipelines Limited and TransCanada Keystone GP Ltd. (Keystone) |
Saskatchewan, Manitoba |
-0.5 |
2009/10 |
Transfer and conversion of gas pipeline assets to oil transportation service |
Mackenzie Gas Project |
Mackenzie Delta, Northwest Territories to Alberta |
1.2 |
2014 |
North America |
Emera Brunswick Pipeline |
New Brunswick |
0.85 |
2008 |
Atlantic Canada, Northeastern U.S. |
EnCana - Deep Panuke Pipeline |
Nova Scotia |
0.3 |
2010 |
Atlantic Canada, Northeastern U.S. |
SemCAMS Redwillow ULC |
British Columbia, Alberta |
0.07 |
Late 2009 |
western Canada |
TransCanada PipeLines Limited/TransQuebec & Maritimes - Rabaska extension |
Québec |
0.5 |
2011+ |
central Canada, Northeastern U.S. |
Spectra Energy Transmission (Westcoast) |
British Columbia |
0.22 |
2009 |
western Canada |
Liquefied Natural Gas
To meet growing North American demand, it is expected that natural gas from the global LNG market will become an increasingly important component of North America supply. Proven reserves of natural gas worldwide are about 20 times larger than the proven natural gas reserves of North America. Continued development of liquefaction capacity in producing regions and growth in the global LNG shipping fleet will enable North American markets to access greater LNG supply in the world market.
In anticipation of growing natural gas requirements in North America, there are numerous proposals to expand existing U.S. terminals and construct new LNG receiving facilities in North America, including several proposed projects in Canada as summarized in Figure 3.2. Grassy Point LNG, by Newfoundland LNG Ltd., was the only new LNG proposal put forth in 2007. The proposal is for an LNG storage and trans-shipment terminal for northeastern United States and Canadian LNG importers and providers, rather than an import facility. The Canaport LNG facility is currently the only facility under construction.
Figure 3.2 - Proposed Canadian LNG Projects
Location |
Terminal |
Proponents |
Capacity |
Proponents' Estimated On-Stream Date |
|---|---|---|---|---|
1. Placentia Bay, Newfoundland |
Grassy Point LNG |
Newfoundland LNG Ltd. |
LNG storage & transshipment |
2010 |
2. Point Tupper, Nova Scotia |
Statia LNG |
Statia Terminals Canada Partnership |
0.5 |
n/a |
3. Goldboro, Nova Scotia |
Maple LNG |
4Gas and Suntera Canada Ltd. |
1.0 |
2010 |
4. Saint John, New Brunswick |
Canaport LNG |
Repsol YPF and Irving Oil |
0.8 |
2008 |
5. Rivière-du-Loup, Québec |
Gros Cacouna LNG |
Petro-Canada and TransCanada Pipelines Ltd. |
0.5 |
2012 |
6. Québec City, Quebec |
Rabaska |
Gaz Métro, Enbridge and Gaz de France |
0.5 |
2011 + |
7. Saguenay, Quebec |
Énergie Grande-Anse |
Saguenay Port Authority and Énergie Grande-Anse Inc. |
1.0 |
2012 |
8. Bish Cove, British Columbia |
Kitimat LNG |
Galveston LNG |
1.0 |
2010/11 |
9. Texada Island, British Columbia |
Texada Island LNG |
WestPac LNG Corporation |
0.5 |
n/a |
The expected introduction of LNG close to Canadian markets has also heightened the awareness of end-users and distributors to the potential issues related to gas composition and quality. Natural gas from non-traditional sources (including LNG) has the potential to have a different chemical composition or energy content and could affect operational safety, efficiency or equipment performance, for example. Consequently, pipelines will need to work closely with their customers to establish gas quality standards and monitoring processes to ensure compatibility with existing equipment and end-use operation.
In 2007 there were several changes in project details - most notably in the expected on-stream dates for a number of announced projects. The on-stream dates of many projects have been delayed as tighter global LNG supply, capital cost pressures, excess North American re-gasification capacity and world-wide natural gas economics have put a strain on the development of LNG import projects in North America.
3.3 Chapter Summary
Under the NEB's Goal 3, a well functioning pipeline transportation system should have an ability to respond on a timely basis to changing market conditions. This may invite proposed adjustments to pipeline capacity or enhancement of pipeline services. The material discussed in this chapter indicates that the pipeline transportation system is responding to the opportunities and challenges associated with the evolution of oil and gas markets.
Oil Pipelines
Oil sands development continues to fuel expansion and construction of new pipelines to deliver crude oil to both traditional and new markets. Crude oil pipeline capacity out of western Canada continues to be tight and at this time there is an inherent lack of flexibility in the system. The numerous pipeline applications filed and approved in 2007 and the possibility of a number of others yet to be filed, however, indicate that the market expects pipeline capacity to increase gradually to meet expected growth in supply. In addition, it is likely that crude oil producers will look for opportunities to enter into supply agreements with downstream refineries to solidify markets for their production.
Natural Gas Pipelines
In comparison to previous years, 2007 showed less new natural gas pipeline activity for NEB-regulated facilities, mainly due to stagnating or declining conventional production and less robust economics. Only two new pipeline proposals emerged, both to gather and connect natural gas produced in British Columbia to existing pipeline infrastructure in Alberta. Previously announced pipeline projects are all aimed at connecting new supply to the North American market.
The potential changes in Canada's natural gas supply and demand dynamics have important implications for both existing pipeline transportation systems and proposed new pipeline and LNG projects. Facilities that connect significant new gas supply from new sources such as the north and LNG or significant changes in regional demand (e.g. oil sands in Alberta and electricity generation in Ontario) have the potential to influence markets and alter the utilization and gas flow on existing pipelines. In turn, these changes may impact the tolls and associated costs for using those pipelines. For example, the introduction of new gas supply in eastern Canada could result in greater utilization or flow reversals in regional pipelines and may also affect the flow of supply from traditional sources and pipelines. Similarly, greater demand in Alberta or Ontario can alter the flow and availability of natural gas to adjacent regions. Such changes are part of the normal evolution of markets.
4. Pipeline Tolls and Shipper Satisfaction
The Board utilizes a number of indicators to assess whether pipeline companies are providing services that meet the needs of shippers at stable and reasonable prices (tolls). This includes monitoring the stability of pipeline tolls as indicated through year-to-year variations in a benchmark toll for each of the major NEB-regulated pipelines, direct shipper feedback received through response to the NEB's annual survey on pipeline services, and via formal complaints and informal discussions with shippers and stakeholders. In addition, the frequency and acceptance of negotiated toll settlements and the development of new or enhanced pipeline services are also important indicators that there is alignment between the interest of pipeline companies and their shippers.
Until the mid 1990s, the predominant method of regulation was cost-of-service. Under this approach, companies came before the Board, often annually, to determine the amount of revenue the pipeline company was allowed to recover through its tolls. Proceedings to determine the cost of service and tolls are generally adversarial and time consuming, requiring legal counsel and presentation of expert witnesses.
4.1 Negotiated Settlements
To improve the effectiveness of the regulatory process and encourage market solutions, the Board has supported the use of negotiated settlements since the mid-1980s as an alternative to toll hearings. In September 1988, the Board issued its first Guidelines for Negotiated Settlements. These guidelines were subsequently updated in August 1994 and revised again in June 2002 to provide flexibility when addressing contested settlements.
As shown in Figure 4.1, all of the major pipelines regulated by the Board were operating under negotiated settlements during 2007, with the exception of TQM which filed a partial settlement for the years 2007 to 2009. The settlement excludes cost of capital items. In December 2007, TQM filed an application for approval of the cost of capital that would be utilized by TQM in the calculation of final tolls to be charged for services provided in 2007 and 2008. TQM's application will be the subject of a public hearing commencing in September 2008. In January 2008, M&NP and its shippers successfully negotiated a one-year toll settlement for 2008. Westcoast and its shippers are currently in negotiations on tolls for 2008.
Figure 4.1 - Negotiated Settlements Timeline
All of these negotiated settlements have resulted in a reduction in the regulatory burden for parties, reducing the time spent in hearings and the associated costs. They have also contributed to a better alignment of interests between pipeline companies and their shippers.
4.2 Pipeline Tolls Index
Stable and reasonable tolls are a key concern for shippers making them an indicator of the pipeline transportation system's efficiency. The Board tracks year-to-year variations in the benchmark tolls for the major pipelines it regulates as they may vary for a number of reasons. For example, a significant expenditure to modify or expand a system to meet shippers' needs could increase or decrease toll levels depending on the specific circumstances. Falling throughput or contract demand leading to lower capacity utilization could lead to a significant toll increase. The following section reviews variations and trends of some NEB-regulated pipeline since 2001.
4.2.1 Oil Pipeline Tolls
The benchmark tolls for Enbridge, TMI, TNPI and Express and the gross domestic product (GDP) deflator, normalized to 2001, are shown in Figure 4.2.[5]
[5] The benchmark tolls are: Enbridge Edmonton to International Border near Chippewa; TMI Edmonton to Burnaby; TNPI Oakville to Montreal; and Express 15-year.
Figure 4.2 - NEB-Regulated Oil Pipeline Benchmark Tolls
* Enbridge toll shown here does not include terminal and tankage fees.
The Enbridge benchmark tolls have mostly risen over the period, growing at a faster pace than the GDP deflator between 2001 and 2006. The tolls increased most in 2004 and 2006. Tolls in 2007 are little changed from 2006. The increase in 2004 was primarily due to lower capacity utilization as throughput did not fill the capacity expansion. Higher fixed costs spread across relatively lower volumes resulted in higher tolls.
TMI's benchmark toll rose steadily from 2001 to 2003 then declined until experiencing a moderate increase in 2007. In 2004, the benchmark toll dropped primarily because of the disposition of deferrals for 2003 higher revenue. TNPI and Express' benchmark tolls moved roughly in line with the GDP deflator from 2001 to 2007.
4.2.2 Natural Gas Pipeline Tolls
In Figure 4.3, the benchmark tolls[6] are shown for TransCanada's Mainline, Westcoast, Foothills (Sask. Zone 9), the TransCanada B.C. System (B.C. System), TQM, M&NP, Alliance, and the GDP deflator,[7] normalized to the year 2001.[8]
[6] The benchmark tolls are: TransCanada Eastern Zone; Westcoast T-South Export; Foothills (Sask. Zone 9); B.C. System Postage Stamp; TQM Saint Lazare to Trois-Rivières; M&NP Postage Stamp; and Alliance monthly demand toll.
[7] The implicit GDP deflator for 2007 is an estimate using actual data for the first half of the year and data estimated by Informetrica for the second half of the year.
[8] Differing pipeline distances add to the challenges in comparing tolls between individual pipelines. Some normalization is required. Here the tolls are normalized only with respect to their own changes over time. The year of normalization is arbitrary.
Figure 4.3 - NEB-Regulated Natural Gas Pipeline Benchmark Tolls
TransCanada's benchmark tolls tracked the GDP deflator fairly closely from 2001 to 2004. However, in 2005 and 2006, the toll fell, primarily due to increased contract demand and although it has increased for 2007, it is still below the 2000 level.
Westcoast's tolls increased modestly until 2004 then increased by over 18 percent because of decontracting of firm service. Reductions in volume in 2006 caused a further 33 percent increase in that year's tolls. In 2007, tolls appear to be holding steady at near 2006 values.
TQM is presently using an interim toll equal to the 2006 toll. Foothills' benchmark toll increased in 2006 because of lower volumes and the end of a ten-year period for deferred tax payback in 2005. The 2007 toll is slightly lower than the 2006 level.
The B.C. System benchmark toll in 2007 was near the 2001 level.[9] M&NP's benchmark toll has increased slightly in 2007. The benchmark toll for Alliance has returned to earlier levels after a drop in 2006.
[9] B.C. System was amalgamated into Foothills South B.C. (Zone 8) effective 1 April 2007.
4.2.3 Comparison of Natural Gas and Oil Pipeline Tolls
Figure 4.4 shows the simple averages of the gas and oil benchmark pipeline tolls indices (reported in Figures 4.2 and 4.3) with the GDP deflator.[10] From 2001 to 2007, oil pipeline tolls increased on average more than gas pipeline tolls, with the net increase over this period roughly matching the GDP deflator. This is attributable in part to expansions occurring on the oil pipeline systems in recent years. Gas pipeline tolls have been relatively stable over this period and have not risen as much as the GDP deflator.
[10] These simple averages are for those pipelines where data was available in each year with no adjustments made for the relative volume, capacity or length of the individual pipelines.
Figure 4.4 - Oil and Natural Gas Pipeline Benchmark Tolls
4.3 Shipper Satisfaction
4.3.1 NEB Pipelines Services Survey
The Board conducted its fourth annual Pipeline Services Survey in early 2008 to obtain direct feedback from the shippers of major NEB-regulated pipeline and midstream companies on the quality of service provided by those pipelines. The Board also used this survey to obtain feedback from shippers on the Board's regulatory performance with respect to tolls and tariffs.
This year, the survey was again conducted through the Board's web-based survey tool and included a new question concerning the Board's publications on energy markets and pricing.
For each survey received, shippers completed one response which reflects their company's corporate views on the services provided by the pipeline and midstream company being surveyed and on the services provided by the Board. The overall response rate for the survey was 30 percent, an increase over last year's rate of 27 percent. As well, the number of surveys sent out this year was 621, approximately 100 more than last year.
After analyzing the survey responses, the Board published a summary of the aggregate results on its website. They included the industry average and distribution of responses for each question and a summary of major themes. In addition, the Board provided each company and its shippers with detailed company-specific results including the average rating and distribution of responses for each question as well as the verbatim comments received from shippers, with the names of the respondents excluded.
The Board will meet with each pipeline company to discuss their survey results and their plans for responding to those results.
Appendix 2 provides the aggregate scores on all survey questions. Link to complete report on the aggregate results.
Pipeline Services
Figure 4.5 shows the aggregate results for the survey question that asked shippers to rate their satisfaction with the overall quality of service provided by their pipeline/midstream companies. This year, the industry average score of 3.40 was lower than the score of 3.60 in last year's survey (1 indicates 'very dissatisfied' and 5 indicates 'very satisfied'). Approximately 60 percent of the respondents gave their company a rating of satisfied or very satisfied on overall quality of service, compared to 65 percent last year. Based on these results, the Board is able to conclude that shippers still appear reasonably satisfied with the services provided by pipeline/midstream companies.
Figure 4.5 - Shipper Satisfaction on Pipeline Quality of Service
The three areas with the highest scores in this year's survey were:
- timeliness and accuracy of invoices and statements;
- physical reliability of pipeline operations; and
- timeliness and usefulness of commercial information.
The three areas with the lowest scores in this year's survey were:
- the level of tolls in relation to transportation and midstream services received;
- exhibiting an attitude of continuous improvement and innovation; and
- being accessible and responsive to shippers issues and requests.
Feedback on the Board
The 2008 survey indicated that shipper satisfaction with the Board has increased over last year. Approximately 70 percent of shippers are either satisfied or very satisfied with the Board's performance with creating an appropriate regulatory framework and 60 percent of shippers are either satisfied or very satisfied with the Board's processes to resolve disputes. Both of these results were higher than in the 2007 survey. Two areas for improvement noted by shippers were for the Board to be more collaborative with its stakeholders and, as noted last year, to provide effective regulatory processes that are more accessible to stakeholders and yield more timely decisions. Both of these areas are addressed in the Board's 2008-2011 Strategic Plan.
With respect to the new question in the survey, the Board notes that a majority of shippers are satisfied with the public information provided by the NEB on energy markets.
4.3.2 Formal Complaints
If shippers are unable to resolve concerns with the pipeline, they can bring a formal complaint to the Board. Depending on the nature of the complaint, it could be dealt with through appropriate dispute resolution (ADR), a formal complaint process before the Board or, in some cases, the parties may be able to negotiate a solution to the concern. There were two shipper complaints during the past year that involved the Board.
Goreway Distributor Delivery Area
In its RH-1-2006 Decision, the Board approved TransCanada's application to implement two new Short Notice Services intended mainly to meet the needs of gas-fired power generators in Ontario. As part of its decision, the Board approved TransCanada's proposal that separate Firm Transportation - Short Notice (FT-SN) service delivery areas be created and used only for the delivery of gas under FT-SN contracts.
In March 2007, TransCanada filed an updated List of Receipt and Delivery Points for its Mainline system. The updated list incorporated the Goreway delivery point as a new Distributor Delivery Area (DDA) in the Central Delivery Area (CDA). Following this filing, the Board received letters from Enbridge Gas Distribution Inc., Goreway Station Partnership, Union Gas Limited (Union), the Canadian Association of Petroleum Producers and the Industrial Gas Users Association expressing concerns with TransCanada's filing. Both Enbridge and Union stated that they did not believe that TransCanada had the authority based upon the RH-1-2006 Decision to designate the Goreway CDA as delivery point for non-short notice services.
In September 2007, the Board issued its decision on the matter. The Board was not persuaded that a separate DDA for non-short notice services was justified and it approved the designation of the Goreway delivery point within the Goreway CDA for Firm Transportation Short Notice Service only.
PPM Energy Canada Ltd. (PECL)
In October 2007, Alliance filed an application for new tolls effective 1 January 2008. Subsequently, PECL filed an objection to Alliance's proposed 2008 tolls stating that the costs that Alliance seeks to recover through its tolls are not reasonable and prudent and, therefore, the proposed tolls are not just and reasonable. At the time of writing, this matter was still before the Board.
4.4 Chapter Summary
Under the NEB's Goal 3, in a well functioning pipeline transportation system, pipeline companies provide services that meet the needs of shippers at just and reasonable prices.
The following specific observations are made in this chapter:
- Pipeline companies and shippers were able to resolve the majority of their toll and tariff issues through the negotiated settlement process.
- Pipeline tolls remain relatively stable on average although fluctuations in throughput or contract demand levels can cause tolls to vary.
- Shippers in 2007 were again reasonably satisfied with the services provided by pipeline/midstream companies, although the ratings were somewhat lower than in previous years.
- There were two formal shipper complaints last year that involved the Board.
Based on these observations, the Board concludes that pipeline/midstream companies are providing services that meet the needs of shippers at stable and reasonable tolls. The slight decrease in the 2008 survey scores does indicate that there are a few areas where pipeline companies have the opportunity to improve their level of service to shippers. Shippers are also reasonably satisfied with the Board's role in the regulation of tolls and tariffs, although there is always room for improvement in the Board's processes.
5. Pipeline Financial Integrity
The tolls discussed in the previous chapter are designed to recover capital and operating costs of the pipeline and the charges associated with servicing debt, plus provide a return to the common equity investor. The financial aspects of pipeline companies, such as debt and equity, are important to maintaining their systems, attracting capital to build new infrastructure and meeting the market's evolving needs effectively. The following sections review and discuss a number of the factors that are relevant to the pipeline transportation system's financial integrity, starting with the area over which the Board has the most direct influence.
In previous years, the Board has also taken into account the views of the members of the investment community in considering the financial integrity of the pipeline system. Because of the TQM cost of capital proceeding, which is currently before the Board,[12] this topic was not discussed with the investment community this year.
[11] RH-1-2008
5.1 Common Equity
A common equity ratio is defined as the percentage of common equity in a company's capital structure. The market sees this ratio as related to a company's financial risk. Higher common equity ratios increase the likelihood of a company being able to meet its financial obligations, including debt service.
Deemed Common Equity Ratios
When the Board approves a Group 1 pipeline company's tolls for a specified time period, it typically also approves a return on equity (ROE) and a common equity ratio for the regulated entity. Since parent companies often have a variety of business lines consolidated into one capital structure, an appropriate common equity must be determined or deemed for the NEB-regulated assets.[12] Alternatively, some Group 1 pipeline companies may successfully negotiate a comprehensive tolls settlement with their shippers that includes capital structure and ROE. In these instances, the Board still considers the overall settlement for approval.
[12] A deemed common equity ratio is a notional capital structure used for rate-making purposes that may differ from a company's actual capital structure.
Table 5.1 shows the deemed common equity ratio for some NEB Group 1 pipeline companies. The deemed common equity ratios for TransCanada Mainline, Westcoast Transmission, and Foothills were increased between 2002 and 2007. TQM's deemed common equity ratio is still under review at the time of writing. The market considers increases to be positive, lowering the financial risk of the pipeline companies.
Table 5.1 - Deemed Common Equity Ratios
2002 |
2006 |
2007 |
2008 |
|
|---|---|---|---|---|
Alliance |
30 |
30 |
30 |
30 |
Foothills |
30 |
36 |
36 |
36 |
M&NP |
25 |
25 |
29.27 |
31.18 |
TQM* |
30 |
30 |
** |
** |
TransCanada Mainline |
33 |
36 |
40 |
40 |
Westcoast Transmission |
30 |
35 |
36 |
*** |
* TQM's common equity ratio was specified in its negotiated settlement that expired on 31 December 2006.
** Presently under review, Hearing order RH-1-2008.
*** In negotiation.
Return on Common Equity
For NEB-regulated pipeline companies, ROE, the return on the equity portion of the rate base, is approved by the Board and determined either through adjudication or negotiation. A higher ROE is typically preferred by investors.
The Board establishes an approved ROE annually using a formula outlined in RH-2-94. It is applicable to all regulated pipelines except for those with alternative rates approved by the Board. Achieved ROEs may vary from NEB-approved levels for various reasons such as throughput changes, incentives, profit-sharing mechanisms and cost variances.
Table 5.2 shows the achieved ROE for several NEB-regulated pipeline companies from 2003 to 2007 as well as the ROE approved by the NEB in accordance with the RH-2-94 Formula.[13] As per their respective negotiated settlements, Enbridge, TMI and Trans-Northern are not required to submit their Financial Surveillance Reports (with achieved ROEs) to the NEB, therefore, these pipeline companies are not included in Table 5.2. Alliance and M&NP, which are included but are not subject to the RH-2-94 Formula, have negotiated ROEs with their shippers.[14] Westcoast's Field Services Division, also not subject to the ROE Formula, is financially regulated on a complaint basis as described in the Framework for Light-handed Regulation (RHW-1-98). Its tolls for gathering and processing services are negotiated individually with shippers. In their negotiated settlements, TransCanada and TQM use the RH-2-94 Formula as a basis for determining ROE and then allow incentives, resulting in some variation from the Formula rate.
[13] The formula used to determine the ROE for certain NEB-regulated pipelines, established in the RH-2-94 Proceeding, and later amended to eliminate rounding.
[14] These settlements were subsequently approved by the Board. Alliance's settlement sets its ROE at 11.25 percent over this period. M&NP has a base return on equity of 12 percent for 2007. Up to and including 2006, their base rate of return was 13 percent with incentive potential.
Table 5.2 - Achieved ROEs and the RH-2-94 Formula ROE
2003 |
2004 |
2005 |
2006 |
2007 |
|
|---|---|---|---|---|---|
Transmission |
|||||
Alliance |
11.25 |
11.25 |
11.25 |
11.25 |
11.25 |
Foothills** |
9.79 |
9.56 |
9.56 |
9.30 |
8.67 |
M&NP |
12.31 |
13.75 |
14.31 |
14.68 |
12.15 |
TQM |
10.21 |
9.84 |
9.92 |
8.99 |
**** |
TransCanada B.C. System |
8.21 |
8.51 |
9.46 |
8.47 |
*** |
TransCanada Mainline |
10.18 |
10.18 |
9.66 |
8.92 |
9.13 |
Westcoast Transmission* |
12.93 |
10.28 |
10.82 |
9.16 |
8.35 |
RH-2-94 Formula |
9.79 |
9.56 |
9.46 |
8.88 |
8.46 |
Midstream |
|||||
Westcoast Field Services* |
6.76 |
11.63 |
12.48 |
10.46 |
7.28 |
* Excluding CWIP (construction work in progress) and, in the case of Transmission, deferrals.
** As of 2005, Foothill's achieved ROE equals the NEB's approved ROE supplemented by the Incentive Return and Other (IRO).
*** As of 1 April 2007 the B.C. System was incorporated into Foothills Zone 8.
**** Presently under review.
Source: NEB Surveillance and Annual Reports
The RH-2-94 Formula produced an ROE of 8.46 percent for 2007 and 8.71 percent for 2008. Settlements using the RH-2-94 Formula as the allowed ROE have varying degrees of incentives that enable pipelines to earn more than the Formula ROE. As a result of the various incentives, most Group 1 pipelines have achieved actual ROEs that are greater than their allowed ROEs.
In the case of Alliance, the ROE is fixed for an extended period. The ROE for M&NP is no longer fixed and has been changing with the last two settlements from 13 percent to 12 percent in 2007. Westcoast Transmission and Westcoast Field Services failed to earn the formula return in 2007.
Figure 5.1 shows the difference between achieved ROEs and NEB-approved ROEs for TransCanada Mainline, the B.C. System, TQM, the Westcoast Transmission System, M&NP, Foothills and Alliance.[15] From 2003 to 2007, these pipeline companies have met or exceeded their NEB-approved ROEs 83 percent of the time. This stability and predictability of returns is positive for both bondholders and equity investors. In many cases, pipeline companies have met or outperformed their approved levels through cost reductions, incentives and profit sharing mechanisms.
[15] Foothills and Alliance's achieved ROEs are equal to their approved ROEs by their settlement.
Figure 5.1 - Variance from NEB-Approved ROE - 2003 to 2007
Source: NEB Surveillance Quarterly and Annual Reports. Includes TransCanada Mainline and B.C. System, TQM, Westcoast Transmission System, and M&NP, as well as Foothills and Alliance who earn precisely their allowed ROE.
5.2 Financial Ratios
Financial ratios, based on financial statement information, can be useful when describing a company's performance and financial integrity. The evaluation of a financial ratio is most meaningful when the ratio of a particular company is compared with a benchmark or industry standard over time. A variety of ratios can be used to evaluate a company's liquidity, operating performance, growth potential, and risk. Care must be exercised in the collection and interpretation of these financial ratios as reported financial information may pertain to a parent company and include non-regulated assets and/or assets from different industries.
Financial risk is the risk inherent in a company's use of debt and other obligations where fixed payments are used. It differs from business risk which is the risk attributed to the nature of a particular business activity and, for pipelines, typically includes supply, market, regulatory, competitive and operating risks. Financial risk increases as the proportion of debt increases relative to shareholders equity. An increase in debt may obligate a company to make larger fixed payments in the future. From a bondholder's perspective, a company with above average financial risk could have problems making interest payments. From an equity holder's perspective, a company's level of debt coverage gives some indication of the sustainability and value of the equity, and possible ability to pay dividends. A company's financial risk may be described by ratios such as interest coverage, fixed-charges coverage and cash flow-to-total debt and equivalents.
The following sections specifically outline and discuss certain ratios relating to the financial risk of certain companies with NEB-regulated pipelines.
Interest and Fixed-Charges Coverage Ratios
An interest coverage ratio describes a company's ability to make interest payments and repay its debt obligations. It is defined as Earnings Before Interest and Taxes (EBIT) divided by interest charges. A fixed-charges coverage ratio also describes the ability to make interest payments and repay debt obligations as well as some of the other types of fixed payments a company is obligated to make. It is defined as earnings before interest, fixed charges and taxes divided by interest and fixed charges. Higher ratios indicate a higher likelihood the company will meet its obligations and may indicate there is unused borrowing capacity.
The fixed-charges coverage ratios for some NEB-regulated pipeline companies, as calculated by the Dominion Bond Rating Service (DBRS), are shown in Figure 5.2. Complete data is not available consistently for all companies - Enbridge Mainline is shown separately from the consolidated company Enbridge Inc. and TMI information is no longer available on a stand-alone basis, therefore its new owner, Kinder Morgan Inc., is shown as a separate entry also. The average fixed-charges coverage ratio to June 2007 is 2.49, which is a five percent average increase year-over-year since 2002 for these four companies.[16] The fixed-charges coverage ratios for 2006 and the first half of 2007 continue the trend of stable to improving ratios since 2002.
[16] The data is limited for 2007 at the time of this publication, therefore this average includes only TransCanada, M&NP, Westcoast and Enbridge Inc.
Figure 5.2 - Fixed-Charges Coverage Ratios
Source: DBRS
N.B. There was no fixed-charges coverage ratio reported for TMI for 2006.
Cash Flow-to-Total Debt and Equivalents Ratio
The cash flow-to-total debt and equivalents ratio is another way of describing a company's ability to meet its debt obligations and fixed payments. It is defined as operating cash flow divided by total debt and debt equivalents.[17] Again, higher ratios indicate an increased likelihood of a company being able to meet its obligations and indicate that it has greater borrowing capacity.
[17] The annual cash flow over a balance sheet item is expressed as a factor 'Times'. Typically it is converted to a percentage.
The cash flow-to-total debt and equivalents ratios for some NEB-regulated pipeline companies, as calculated by DBRS, are shown in Figure 5.3. As earlier noted, this ratio is not available for all pipeline units. The average cash flow-to-total debt and equivalents ratio for these companies was 17 percent for the partial year ending June 2007, an increase from the year before.[18] Kinder Morgan's cash flow-to-debt and equivalents ratio was low in 2005 due to their purchase of Terasen Inc. but it rebounded in 2006 when their debt load was reduced through the transfer of Trans Mountain Pipeline to Kinder Morgan Energy Partners, L.P. On average, the cash flow-to-debt and equivalents ratio for these pipeline companies has grown from 2002 to 2007.
[18] This calculation differs from the 2007 report as data for TQM, which was included in last year's report, was not available at the time of publication. Using only the companies that have data available for this year, the average is 17 for 2007, up from 14.6 for 2006 and up notably from 12.2 in 2002.
Figure 5.3 - Cash Flow-to-Total Debt and Equivalent Ratios
Source: DBRS
5.3 Credit Ratings
In Canada, pipeline credit ratings are determined by three major independent credit rating agencies, Dominion Bond Rating Service (DBRS), Standard & Poor's (S&P), and Moody's. Credit ratings provide an assessment of the probability a debt issuer will live up to its obligations and, as such, are an indication of the financial integrity of the rated company. A company's credit rating generally reflects the consolidated operations of the entire company, not just the regulated portion. Consequently, the credit ratings for companies such as Enbridge, TransCanada and Westcoast, which have both regulated and non-regulated operations, may be influenced by their non-regulated operations. In addition, the credit ratings for a business unit may be influenced to some extent by a parent company. Credit ratings are somewhat subjective in that a company's ratings are the expert opinion of the credit rating agency, which may result in different ratings by different agencies. See Appendix 3 for a comparison of the rating scales for DBRS, S&P, and Moody's.
DBRS
According to its website, in assigning a credit rating to a particular company, DBRS attempts to consider all meaningful factors that could impact the risk of maintaining timely payments of interest and principal in the future. Key credit considerations will vary from industry to industry nevertheless, some of the common factors considered for most ratings are: core profitability, asset quality, strategy and management strength, and the financial and business risk profiles.
The following specific factors are also considered for pipelines when deriving their credit ratings: regulatory factors, competitive environment, supply and demand considerations, and regulated versus non-regulated activities. The credit ratings for most Group 1 pipeline companies are shown in Table 5.3 and indicate ratings have remained stable from 2002 to the present, varying from A(low) to A(high).
Table 5.3 - DBRS Credit Rating History
Pipeline |
2003 |
2004 |
2005 |
2006 |
2007 |
Current |
|---|---|---|---|---|---|---|
Alliance |
A (low) |
A (low) |
A (low) |
A (low) |
A (low) |
A (low)/Stable |
Enbridge Pipelines |
A (high) |
A (high) |
A (high) |
A (high) |
A (high) |
A (high)/neg |
Expressa |
A (low) |
A (low) |
A (low) |
A (low) |
A (low) |
A (low)/Stable |
M&NP |
A |
A |
A |
A |
A |
A/Stable |
TQM |
A (low) |
A (low) |
A (low) |
A (low) |
A (low) |
A (low)/Stable |
TransCanada |
A |
A |
A |
A |
A |
A/Stable |
Trans Mountain |
A (low) |
A (low) |
A (low) |
repaid |
repaid |
repaid |
Trans-Northern |
NR |
NR |
A(low) |
A (low) |
A (low) |
A (low)/Stable |
Westcoastb |
A (low) |
A (low) |
A (low) |
A (low) |
A (low) |
A (low)/Stable |
a) Senior secured
b) Unsecured debentures
NR Not rated
Standard & Poor's
S&P indicates that its credit rating reflects a borrower's capacity and willingness to meet its financial commitments on a timely basis. S&P bases its ratings on the overall creditworthiness of a consolidated company. Therefore, the rating of a wholly-owned subsidiary, in the absence of meaningful ring-fencing measures, generally reflects the creditworthiness of the parent.
In S&P's rating methodology, a company rated 'A' has strong capacity to meet its financial commitments but is somewhat more susceptible to the adverse effects of changes in circumstances and economic conditions than companies in higher-rated categories. A company rated 'BBB' has adequate capacity to meet its financial commitments. However, adverse economic conditions or changing circumstances are more likely to lead to a weakened capacity of the company to meet its financial commitments.
S&P credit ratings for several Group 1 pipeline companies are shown in Table 5.4. The table illustrates that ratings have remained stable from 2003 to the present, varying from 'BBB+' to 'A-'. The credit rating on the long-term debt of Westcoast Energy Inc. was upgraded to 'BBB+' in January 2007 from 'BBB'. This was based on a change in ownership at the parent company level in January 2007 when Duke Energy Corporation completed the spin-off of its natural gas business (including Westcoast) to Spectra Energy Corporation, a new publicly traded company. Also, a negative outlook on TransCanada's credit rating had been in place since December 2002, initially associated with TransCanada's significant acquisition of a partnership position in Bruce Power in February 2002. S&P revised this outlook in April 2007 from 'negative' to 'stable' noting TransCanada's 2006 acquisition of ANR and its investment in the Keystone oil pipeline project provided a stabilizing offset to a declining rate base and lower ROE from its traditional business.
Table 5.4 - S&P Credit Rating History
Pipeline |
2003 |
2004 |
2005 |
2006 |
2007 |
Current |
|---|---|---|---|---|---|---|
Enbridge Pipelines |
A-/Stable |
A-/Stable |
A-/Stable |
A-/Stable |
A-/Stable |
A-/Stable |
M&NPa |
A/Stable |
A/Stable |
A/Stable |
A/Stable |
A/Stable |
A/Stable |
TQM |
BBB+/Stable |
BBB+/Stable |
BBB+/Stable |
BBB+/Stable |
BBB+/Stable |
BBB+/Stable |
TransCanada |
A-/Watch Neg |
A-/Watch Neg |
A-/Neg |
A-/Neg |
A-/Stable |
A-/Stable |
Trans Mountain |
BBB/Stable |
BBB/Stable |
BBB/Stable |
debt repaid |
debt repaid |
debt repaid |
Westcoastb |
BBB+/Stable |
BBB+/Stable |
BBB/Watch Neg |
BBB/Stable |
BBB+/Stable |
BBB+/Stable |
a) Senior secured
b) Unsecured debentures
Moody's
According to Moody's, its credit analysis focuses on the fundamental factors and key business drivers relevant to an issuer's long-term and short-term risk profile. The foundation of Moody's methodology rests on two basic considerations:
- the risk to the debt holder of not receiving timely payment of principal and interest on the specific debt security; and
- a comparison of the level of risk with that of all other debt securities.
Like S&P, Moody's focuses its ratings on the overall creditworthiness of the consolidated entity. In so doing, Moody's measures the ability of an issuer to generate cash in the future, thus its primary focus is on the predictability of future cash generation. This determination is built on an analysis of the individual issuer and of its strengths and weaknesses compared to those of its peers worldwide. An examination of factors external to the issuer is also conducted, including industry or country level trends that could impact the entity's ability to meet its debt obligations. Of particular concern is the ability of management to sustain cash generation in the face of adverse changes in the business environment.
The rating histories for several Group 1 pipeline companies are provided in Table 5.5. All of Moody's ratings place these pipelines in the investment grade category, ranging from 'medium grade' to 'upper-medium grade'.
Table 5.5 - Moody's Credit Rating History
Pipeline |
2003 |
2004 |
2005 |
2006 |
2007 |
Current |
|---|---|---|---|---|---|---|
Alliancea |
A3 |
A3 |
A3 |
A3 |
A3 |
A3 |
Enbridge Inc. |
A3 |
A3 |
A3 |
A3 |
Baa1 |
Baa1 |
Expressb |
Baa1 |
Baa1 |
Baa1 |
Baa1 |
Baa1 |
Baa1 |
M&NPb |
A1 |
A1 |
A2 |
A2 |
A2 |
A2 |
TransCanadaa |
A2 |
A2 |
A2 |
A2 |
A2 |
A2 |
a) Unsecured debentures
b) Senior secured
In March 2007, Moody's downgraded the ratings on the senior unsecured debt of Enbridge Inc. from A3 to Baa1. Moody's stated the one notch downgrade was based on concerns relating to the company's weak financial profile, the complexity of its organizational and capital structure, and the scope and financial impact of the company's substantial organic growth plans.
In April 2008, Moody's placed TransCanada under review for possible downgrade due to rising levels of business risk following the announcement of TransCanada's purchase of the 2 480 megawatt Ravenswood power generating station in New York.
5.4 Chapter Summary
Under the NEB's Goal 3, a desired outcome is that pipeline companies have adequate financial strength to attract capital on terms and conditions that enable them to effectively maintain their systems and build new infrastructure to meet the changing needs of the market.
The observations made in this chapter may be summarized as follows:
- fixed-charges and cash flow-to-total debt and equivalents coverage ratios are stable;
- deemed common equity ratios have increased since 2002;
- achieved ROEs have, in most cases, been greater than their NEB-approved levels; and
- credit ratings continue to be investment grade.
The Board is presently considering the cost of capital of one pipeline, TQM, whose application questions the appropriateness of the current RH-2-94 Formula to its system. In view of these circumstances, the Board did not seek direct input from the investment community on the ability of Canadian pipelines to attract financial capital. Accordingly, this report does not draw conclusions on whether, at present, NEB-regulated companies have adequate financial strength to attract capital on reasonable terms and conditions.
6. Conclusions
Under the NEB's Goal 3, which was noted in Chapter 1, the following outcomes are seen as important characteristics of a well functioning pipeline transportation system:
- there is adequate pipeline capacity in place to move products to consumers who need them;
- pipeline companies provide services that meet the needs of shippers at just and reasonable prices; and
- pipeline companies have adequate financial strength to attract capital on terms and conditions that enable them to effectively maintain their systems and build new infrastructure to meet the changing needs of the market.
Based on the material discussed in this report, the Board believes that the Canadian pipeline transportation system continues to work effectively. The specific conclusions are, as follows:
- Capacity is tight on oil pipelines. While there is some spare capacity on some oil pipelines systems, there were periods of apportionment in 2007. The market's view is that additional capacity is required to accommodate growing supply and to provide greater market flexibility. This is best demonstrated by the number of announced and proposed pipelines and expansions to both traditional markets and new markets such as the U.S. Gulf Coast and offshore Asia and California.
There is adequate capacity in place on existing natural gas pipelines. Most NEB-regulated gas pipelines have some excess capacity, even during the peak winter season. Pipeline utilization declined for most pipelines in 2007. Stagnating or declining conventional supply from the WCSB, growing demand within western Canada, and competition from other supply basins, particularly in the western U.S., resulted in reduced flows on pipelines transporting gas from western Canada. - Shippers continue to indicate that they are reasonably satisfied with the services provided by pipelines. The results of the NEB Pipeline Services Survey again rate the physical reliability of pipeline operations highly, while satisfaction with the level of tolls was again identified as the main area of concern for shippers.
- With respect to financial strength, common equity, fixed-charges coverage and cash flow-to-total debt and equivalents ratios are stable and credit ratings continue to be investment grade. The issue of financial soundness and ability to attract capital by NEB-regulated pipelines is not addressed further in this year's report as the matter of ROE is currently before the Board in the Trans Québec & Maritimes Pipeline Inc. hearing (RH-1-2008).
As identified in Chapter 3, there are a significant number of pipeline proposals being pursued to deliver anticipated volumes of oil and natural gas to new and growing markets. The challenge for the pipeline industry is to put appropriate capacity in service corresponding with changes in production and market requirements. For this to happen there must be adequate and predictable lead times to achieve sufficient market support from amongst competing proposals, seek regulatory approvals, and if and when these are obtained, arrange financing, mobilize labour and materials, and construct facilities.
A key component and ongoing challenge from the NEB's perspective is to provide a fair and effective process that engages Canadians meaningfully in the discussion related to determining the necessity and public convenience of industry proposals. The Board recognizes that this report represents only a snapshot in time and does not include a comparison with or to pipeline transportation systems in other jurisdictions. As part of its mandate, the Board will continue to monitor the effectiveness of the transportation system and will continue to meet with parties to gain an understanding of all perspectives on this issue. The Board welcomes feedback on the measures and conclusions in this report and also welcomes suggestions for improvements to future reports.
The Board thanks those companies and organizations that directly or indirectly provided the information found in this report, including those that actively participated in the Pipeline Services Survey.
Appendix 1 - Group 1 and Group 2 Pipelines
Regulated by the NEB (as of 31 December 2007)
Group 1 Oil and Products
Kinder Morgan Cochin Pipe ULC
Enbridge Pipelines Inc.
Enbridge Pipelines (NW) Inc.
Trans Mountain Pipeline Inc.
Trans-Northern Pipelines Inc
Group 1 Natural Gas
Alliance Pipeline Ltd.
Foothills Pipe Lines Ltd.
Gazoduc Trans Québec & Maritimes Inc.
Maritimes & Northeast Pipeline
Management Ltd.
TransCanada PipeLines Limited
TransCanada PipeLines Limited, B.C. System
Westcoast Energy Inc.
Group 2 Oil and Products
Amoco Canada Petroleum Company Ltd.
Aurora Pipe Line Company
Berens Energy Ltd.
BP Canada Energy Company
Dome Kerrobert Pipeline Ltd.
Dome NGL Pipeline Ltd.
Enbridge Pipelines (Westspur) Inc.
Ethane Shippers Joint Venture
Express Pipeline Limited Partnership
Genesis Pipeline Canada Ltd.
Glencoe Resources Ltd.
Husky Oil Limited
Imperial Oil Resources Limited
ISH Energy Ltd.
Kaiser Exploration Ltd.
Montreal Pipe Line Limited
Murphy Oil Company Ltd.
NOVA Chemicals (Canada) Ltd.
PanCanadian Kerrobert Pipeline Ltd.
Paramount Transmission Ltd.
Penn West Petroleum Ltd.
Plains Marketing Canada, L.P.
PMC (Nova Scotia) Company
Pouce Coupé Pipe Line Ltd. as agent and general partner of the
Pembina North Limited Partnership Provident Energy Pipeline Inc.
Renaissance Energy Ltd.
SCL Pipeline Inc.
Shell Canada Products Limited
Spectra Energy Empress L.P.
Sun-Canadian Pipe Line Company
Taurus Exploration Canada Ltd.
Yukon Pipelines Limited
1057533 Alberta Ltd.
Group 2 Natural Gas
AltaGas Pipeline Partnership
Apache Canada Ltd.
ARC Resources Ltd.
Bear Paw Processing Company (Canada) Ltd.
BP Canada Energy Company
Burlington Resources Canada (Hunter) Ltd.
Canada Border Services Agency
Canadian-Montana Pipe Line Corporation
Canadian Natural Resources Limited
Centra Transmission Holdings Inc.
Champion Pipeline Corporation Limited
Chief Mountain Gas Co-op Ltd.
County of Vermilion River No. 24 Gas Utility
Crescent Point Resources Ltd.
Delphi Energy Corporation
Devon Canada Corporation
DR Four Beat Energy Corp.
Echoex Energy Inc.
EnCana Border Pipelines Limited
EnCana Corporation
EnCana Ekwan Pipeline Inc.
EnCana Oil & Gas Co. Ltd.
EnCana Oil & Gas Partnership
Enermark Inc.
ExxonMobil Canada Properties
Fletcher Challenge Petroleum Inc.
Forty Mile Gas Co-op Ltd.
Huntingdon International Pipeline Corporation
Husky Oil Operations Ltd.
Kaiser Exploration Ltd.
KEYERA Energy Ltd.
Many Islands Pipe Lines (Canada) Limited
Marauder Resources West Coast Inc.
Mid-Continent Pipelines Limited
Minell Pipeline Limited
Murphy Canada Exploration Company
Murphy Oil Company Ltd.
Nexen Inc.
Niagara Gas Transmission Limited
NuVista Energy Ltd.
Omimex Canada, Ltd.
Paramount Transmission Ltd.
Peace River Transmission Company Limited
Pengrowth Corporation
Penn West Petroleum Ltd.
Petrovera Resources Ltd.
Pioneer Natural Resources Canada Inc.
Portal Municipal Gas Company Canada Inc.
Profico Energy Management Ltd.
Renaissance Energy Ltd.
Shiha Energy Transmission Ltd.
Spectra Energy Midstream Canada L.P.
St. Clair Pipelines Management Inc.
Suncor Energy Inc.
Sword Energy Limited
Talisman Energy Inc.
Taurus Exploration Canada Ltd
True Energy Inc.
Union Gas Limited
Vault Energy Inc.
Vector Pipeline Limited Partnership
Wolstitmor Joint Venture|
1057533 Alberta Ltd.
2193914 Canada Limited
Commodity Pipelines
Abitibi-Consolidated Company of Canada
E.B. Eddy Forest Products Ltd.
Fraser Papers Inc. (Canada)
Genesis Pipeline Canada Ltd.
Penn West Petroleum Ltd.
Souris Valley Pipeline Limited
Appendix 2 - Pipeline Services Survey Aggregate Results
Below are the aggregate responses for each question in the survey. Respondents were asked to rate their satisfaction with the services they receive on a scale of 1 to 5, where 1 indicates 'very dissatisfied' and 5 indicates 'very satisfied'. See the Board's website for the complete details.
- How satisfied are you with the physical reliability of the pipeline company's operations?
Pipeline Services Survey - Question 1 1 2 3 4 5 Average 12 21 14 77 33 3.62 - How satisfied are you with the quality, flexibility and reliability of the pipeline company's transactional systems (nominations, bulletin boards, reporting, contracting, etc.)?
Pipeline Services Survey - Question 1 1 2 3 4 5 Average 10 19 17 89 20 3.58 - How satisfied are you with the timeliness and accuracy of the pipeline company's invoices and statements?
Pipeline Services Survey - Question 1 1 2 3 4 5 Average 12 12 9 97 25 3.72 - How satisfied are you with the timeliness and usefulness of operations information (outages, available capacity, scheduled maintenance, flows, etc.) provided by the pipeline company?
Pipeline Services Survey - Question 1 1 2 3 4 5 Average 8 30 19 86 14 3.40 - How satisfied are you with the timeliness and usefulness of commercial information (tolls, service changes, new services, contract information, etc.) provided by the pipeline company?
Pipeline Services Survey - Question 1 1 2 3 4 5 Average 3 15 36 88 13 3.60 - How satisfied are you with the degree to which the pipeline company demonstrates an attitude of continuous improvement and innovation?
Pipeline Services Survey - Question 1 1 2 3 4 5 Average 15 28 10 61 14 3.19 - How satisfied are you with the accessibility and responsiveness of the pipeline company to shipper issues and requests?
Pipeline Services Survey - Question 1 1 2 3 4 5 Average 16 31 25 64 20 3.26 - How satisfied are you that the pipeline company works towards fair and reasonable solutions when resolving issues?
Pipeline Services Survey - Question 1 1 2 3 4 5 Average 7 34 32 69 14 3.31 - How satisfied are you with the suite of services offered by the pipeline company?
Pipeline Services Survey - Question 1 1 2 3 4 5 Average 5 17 46 76 7 3.41 - How satisfied are you with the level of this pipeline company's tolls in relation to the transportation services your company receives?
Pipeline Services Survey - Question 1 1 2 3 4 5 Average 7 29 59 57 1 3.11 - How satisfied are you with the collaborative processes (negotiations or task force meetings) utilized by this pipeline company?
Pipeline Services Survey - Question 1 1 2 3 4 5 Average 4 27 44 50 13 3.30 - How satisfied are you that the current negotiated settlement agreement or tariff arrangements work well to provide fair outcomes?
Pipeline Services Survey - Question 1 1 2 3 4 5 Average 3 17 53 65 7 3.39 - How satisfied are you with the OVERALL quality of service provided by the pipeline company over the last calendar year?
Pipeline Services Survey - Question 1 1 2 3 4 5 Average 10 29 27 80 16 3.4 - On an overall basis, has the pipeline company's quality of service in the last year:
Pipeline Services Survey - Question 14 Improved 19 12 Remained the Same 110 69 Decreased 31 19 Total 160 100% - What are the things that this pipeline company does well?
- What are the things that this pipeline company could do better?
- How satisfied are you that the NEB has established an appropriate regulatory framework in which negotiated settlements for tolls and tariffs can be reached?
Pipeline Services Survey - Question 1 1 2 3 4 5 Average 5 5 35 93 9 3.65 - When toll and tariff matters are not resolved through settlement, how satisfied are you with the Board's processes to resolve disputes?
Pipeline Services Survey - Question 1 1 2 3 4 5 Average 3 7 43 64 15 3.61 - What could the Board be doing to improve its processes through which tolls and tariffs are determined?
- Overall Quality of Service (Importance Rating) (see Figure 4.5).
- How satisfied are you with the public information provided by the NEB on energy markets?
Pipeline Services Survey - Question 1 1 2 3 4 5 Average 4 2 49 76 11 3.62
Appendix 3 - Debt Rating Comparison Chart
This chart provides a comparison of the rating scales used by DBRS, Standard and Poor's (S&P), and Moody's when rating long-term debt.
Standard & Poor's provides a Rating Outlook that assesses the potential direction of a long-term credit rating over the intermediate to longer term. A 'Positive' outlook means a rating may be raised; a 'Negative' outlook means that a rating may be lowered; and a 'Stable' outlook means a rating is not likely to change.
| Credit Quality | DBRS | S&P | Moody's |
|---|---|---|---|
Investment Grade |
|||
Superior/High grade |
AAA |
AAA |
Aaa |
AA (high) |
AA+ |
Aa1 |
|
AA |
AA |
Aa2 |
|
AA (low) |
AA- |
Aa3 |
|
Good/Upper Medium |
A (high) |
A+ |
A1 |
A |
A |
A2 |
|
A (low) |
A- |
A3 |
|
Adequate/Medium |
BBB (high) |
BBB+ |
Baa1 |
BBB |
BBB |
Baa2 |
|
BBB (low) |
BBB- |
Baa3 |
|
Non-Investment Grade |
|||
Speculative |
BB (high) |
BB+ |
Ba1 |
BB |
BB |
Ba2 |
|
BB (low) |
BB- |
Ba3 |
|
Highly speculative |
B (high) |
B+ |
B1 |
B |
B |
B2 |
|
B (low) |
B- |
B3 |
|
Very highly speculative |
CCC |
CCC |
Caa1 |
CC |
CC |
Caa2 |
|
C |
C |
Caa3 |
|
D |
D |
Ca |
|
C |
|||
Note: DBRS and S&P ratings in the CCC category and lower also have subcategories 'high/+' and 'low/-' and the absence of 'high/+' and 'low/-' designation indicates the rating is in the "middle" of the category.
- Date modified: