Canadian Pipeline Transportation System - Energy Market Assessment
Canadian Pipeline Transportation System - Energy Market Assessment [PDF 3304 KB]
April 2014
Copyright/Permission to Reproduce
ISSN 2292-6895
Table of Contents
- List of Figures
- List of Tables
- Units
- Acronyms and Abbreviations
- Foreword
- Executive Summary
- 1. What The Board Measures
- 2. Supply and Disposition of Canadian Oil and Natural Gas
- 3. Pipeline Capacity and Utilization
- 3.1 Oil and Liquids
- 3.1.1 Oil and Liquids Pipelines Capacity Utilization and Apportionment
- 3.1.2 Oil Price Differentials and Tolls
- 3.2 Natural Gas
- 3.2.1 Natural Gas Pipelines Capacity Utilization
- 3.2.2 Natural Gas Price Differentials and Firm Service Tolls
- 4. Services at Reasonable Prices (Tolls)
- 4.1 Pipeline Tolls Index
- 4.2 Negotiated Settlements and Toll Proceedings
- 4.3 Formal Complaints
- 5. Ability to Attract Capital
- 5.1 Common Equity and Return on Equity
- 5.2 Financial Ratios
- 5.3 Credit Ratings
- Appendix 1 – Oil Pipeline Utilization and Apportionment
- Appendix 2 – Gas Pipeline Utilization
- Appendix 3 – Benchmark Tolls
- Appendix 4 – Settlements, Toll Proceedings and Complaints
- Appendix 5 – Financial Integrity
- Appendix 6 - Group 1 and Group 2 Pipeline Companies
List of Figures
- Figure 2.1 2012 Supply and Disposition of Canadian Crude Oil
- Figure 2.2 2012 Supply and Disposition of Canadian Natural Gas
- Figure 3.1 Major Oil Pipelines Regulated by the NEB
- Figure 3.2 Light Sweet Crude Edmonton Par Price vs. Light Sweet Export Price and Louisiana Light
- Figure 3.3 Western Canada Select vs. Heavy Crude Export Price and Mexican Maya
- Figure 3.4 Canadian and U.S. Crude Oil Pipelines and Proposals
- Figure 3.5 Major Natural Gas Pipelines Regulated by the NEB
- Figure 3.6 Alberta-Dawn Price Differential vs. TransCanada Toll
- Figure 3.7 Sumas-Station 2 Price Differential vs. Westcoast Toll
- Figure 4.1 Benchmark Oil Pipeline Tolls 2008-2013
- Figure 4.2 Natural Gas Benchmark Tolls 2008-2013
- Figure A1.1 Enbridge Pipeline System Configuration – 2013
- Figure A1.2 Enbridge Mainline Throughput vs. Design Capacity
- Figure A1.3 Enbridge Apportionment in the U.S. (percent)
- Figure A1.4 Trans Mountain Pipeline Throughput vs. Capacity
- Figure A1.5 Trans Mountain Apportionment (percent)
- Figure A1.6 Express Pipeline Throughput vs. Capacity
- Figure A1.7 Keystone Throughput vs. Capacity
- Figure A1.8 Trans Northern Throughput
- Figure A1.9 Cochin Throughput vs. Capacity
- Figure A2.1 Westcoast T-South Throughput vs. Capacity
- Figure A2.2 Westcoast Alberta Throughput vs. Capacity
- Figure A2.3 Alliance Pipeline Throughput vs. Capacity
- Figure A2.4 NGTL System Map
- Figure A2.5 NGTL Upstream James River Throughput vs. Capacity
- Figure A2.6 NGTL North and East Flows Throughput vs. Capacity
- Figure A2.7 NGTL Eastern Gate Throughput vs. Capacity
- Figure A2.8 Foothills B.C. Throughput vs. Capacity
- Figure A2.9 Foothills Saskatchewan Throughput vs. Capacity
- Figure A2.10 TransCanada Mainline System Map
- Figure A2.11 TransCanada Mainline Prairies Segment Throughput vs. Capacity
- Figure A2.12 TransCanada Northern Ontario Line Throughput vs. Capacity
- Figure A2.13 TransCanada Eastern Triangle Throughput vs. Capacity
- Figure A2.14 TransCanada Mainline at Niagara Throughput vs. Capacity
- Figure A2.15 TransCanada Mainline at Iroquois Throughput vs. Capacity
- Figure A2.16 Trans Quebec & Maritimes Pipeline Throughput vs. Capacity
- Figure A2.17 TQM Pipeline East Hereford Throughput vs. Capacity
- Figure A2.18 Maritimes & Northeast Pipeline Throughput vs. Capacity
- Figure A2.19 M&NP St. Stephen Daily Throughput
- Figure A2.20 Emera Brunswick Pipeline Throughput vs. Capacity
- Figure A3.1 Enbridge Mainline Benchmark Toll
- Figure A3.2 Trans Mountain Benchmark Toll
- Figure A3.3 Trans-Northern Benchmark Toll
- Figure A3.4 Express Benchmark Toll
- Figure A3.5 TransCanada Mainline Benchmark Toll
- Figure A3.6 Alliance Benchmark Toll
- Figure A3.7 Foothills Benchmark Toll
- Figure A3.8 NGTL Benchmark Toll
- Figure A3.9 Westcoast Benchmark Toll
- Figure A3.10 M&NP Benchmark Toll
- Figure A3.11 KM Cochin Benchmark Toll
- Figure A4.1 Negotiated Settlements Timeline
- Figure A5.1 Variance from NEB-Approved ROE - 2007 to 2012
- Figure A5.2 Fixed-Charges Coverage Ratios
- Figure A5.3 Cash Flow-to-Total Debt and Equivalent Ratios
List of Tables
Units
| Mb/d | Thousand barrels per day |
| MMb/d | Million barrels per day |
| Bcf | Billion cubic feet |
| Bcf/d | Billion cubic feet per day |
| m3 | Cubic metres |
| m3/d | Cubic metres per day |
| km | Kilometres |
Acronyms and Abbreviations
| Alliance | Alliance Pipeline Ltd. |
| Board | National Energy Board |
| BP Canada | BP Canada Energy Company |
| Brent | North Sea Brent |
| Cenovus | Cenovus Energy Inc. |
| Centra | Centra Transmission Holdings Inc. |
| Cochin | Kinder Morgan Cochin Pipeline ULC’s pipeline |
| Dawn | Dawn natural gas trading hub in southwestern Ontario |
| DBRS | Dominion Bond Rating Service |
| Dock | Westridge Dock |
| Dome | Dome NGL Pipelines Ltd. |
| Enbridge | Enbridge Pipelines Inc. |
| Express | Express Pipeline Ltd. |
| Express L.P. | Express Pipeline Limited Partnership |
| Foothills | Foothills Pipe Lines Ltd. |
| Foothills Saskatchewan | Foothills Pipeline (Sask.) Ltd. |
| Foothills (South B.C.) | Foothills Pipeline (South B.C.) Ltd. |
| Imperial | Imperial Oil Limited |
| Keystone | TransCanada Keystone Pipeline |
| Keystone GP | TransCanada Keystone Pipeline GP Ltd. |
| Kinder Morgan | Kinder Morgan Canada Inc. |
| LNG | Liquefied Natural Gas |
| M&NP | Maritimes & Northeast Pipeline Management Ltd. |
| M&NP L.P. | Maritimes & Northeast Pipeline Limited Partnership |
| Murphy | Murphy Oil Company Ltd. |
| NEB | National Energy Board |
| NEB Act | National Energy Board Act |
| NGTL | Nova Gas Transmission Ltd. |
| NOL | Northern Ontario Line segment of the TransCanada Mainline |
| NOVA Chemicals | Nova Chemicals (Canada) Corporation Limited |
| ROE | Rate of Return on Common Equity |
| S&P | Standard & Poor's |
| Sable | Sable Offshore Energy Project |
| Tariff 119 | NEB Tariff 119 |
| T-South or Southern Mainline | Westcoast's Southern Mainline (Zone 4) |
| TNPI | Trans-Northern Pipelines Inc. |
| TQM | Trans Québec & Maritimes Pipeline Inc. |
| TransCanada | TransCanada Pipelines Ltd. |
| Trans Mountain | Trans Mountain Pipeline Inc. |
| U.S. | United States |
| WCSB | Western Canada Sedimentary Basin |
| Westcoast | Westcoast Energy Inc. |
| WTI | West Texas Intermediate |
Foreword
The National Energy Board (NEB or Board) is an independent federal regulator. The Board’s purpose is to promote safety and security, environmental protection and efficient infrastructure and markets in the Canadian public interest1 within the mandate set by Parliament for the regulation of pipelines, energy development, and trade.
The Board’s main responsibilities include regulating the construction and operation of interprovincial and international oil and natural gas pipelines, international power lines, and designated interprovincial power lines. Furthermore, the Board regulates tolls and tariffs for the pipelines under its jurisdiction. With respect to the specific energy commodities, the Board regulates the export of natural gas, oil, natural gas liquids and electricity, and the import of natural gas. Additionally, the Board regulates oil and natural gas exploration and development on frontier lands and offshore areas not covered by provincial or federal management agreements.
For oil and natural gas exports, the Board’s role is to evaluate whether the oil and natural gas proposed to be exported is surplus to reasonably foreseeable Canadian requirements, having regard to the trends in the discovery of oil or gas in Canada.2 The Board monitors energy markets, Canadian energy requirements, and trends in the discovery of oil and natural gas to support its responsibilities under Part VI of the National Energy Board Act (the NEB Act). The Board periodically publishes assessments in support of its ongoing market monitoring. In this assessment, the Board assesses the economic functioning of the Canadian pipeline transportation system.
The Canadian Pipeline Transportation System assessment offers a snapshot in time of NEB regulated pipelines. It does not include a comparison with, or to, pipeline transportation systems in other jurisdictions. In this review, the Board used publicly available data for the major NEB-regulated pipelines3 and throughput and capacity data provided by the pipelines to June 2013. The information in this assessment is an update for the period since the assessment was last published in 2009.
This assessment does not indicate whether any application filed with the Board will be approved or denied. The Board takes decisions on specific applications based on the evidence before it at that time. If a party wishes to rely on material from this assessment in any regulatory proceeding before the Board, it may submit the material, just as it may submit any public document. Under these circumstances, the submitting party in effect adopts the material and could be required to answer questions about it.
[1] The public interest is inclusive of all Canadians and refers to a balance of economic, environmental, and social considerations that change as society's values and preferences evolve over time.
[2] Section 118 of the National Energy Board Act: On an application for a licence to export oil or gas, the Board shall satisfy itself that the quantity of oil or gas to be exported does not exceed the surplus remaining after due allowance has been made for the reasonably foreseeable requirements for use in Canada, having regard to the trends in the discovery of oil or gas in Canada.
[3] Appendix 6 lists the pipeline companies regulated by the NEB as of December 2013.
Executive Summary
Energy is critical to Canada's economy and Canadians’ well-being. In 2012, Canada produced over 537 000 cubic meters per day (3.38 million barrels per day) of crude oil and almost 400 million cubic meters per day (13.9 billion cubic feet per day) of natural gas. Most of this energy was shipped by pipeline from western provinces to markets in other provinces or the United States (U.S.) as shown in Figures 2.1 and 2.2.
The Board regulates the construction and operation of pipelines by balancing and integrating all aspects of the Canadian public interest, including social, economic and environmental considerations, when making a decision or recommendation. The NEB’s regulatory framework is designed to promote safety, security, environmental protection and efficient energy infrastructure and markets.
In support of its regulatory role, the Board actively monitors energy markets and produces neutral, independent, fact based energy information for Canadians. These products increase the transparency of Canadian energy markets and support Canadian energy literacy. This report provides information about the major pipelines regulated by the Board, and assesses the economic functioning of the pipeline transportation system. The NEB believes that well-functioning, competitive markets efficiently balance supply and demand.
Canadians depend on pipeline transportation systems to deliver natural gas, natural gas liquids, crude oil, and petroleum products across Canada. These pipelines deliver energy safely, reliably and efficiently, connecting markets in North America and the world. The Board regulates approximately 73 000 kilometres (km) of pipelines which transported over $134 billion worth of energy products in 2013 at an estimated transportation cost of $7.1 billion.
Structural Changes Unfolding
An economically efficient pipeline transportation system effectively responds to changing market conditions. Since 2007, oil and gas markets have changed dramatically. Technological advances made it possible to economically produce vast quantities of oil and gas from tight and shale formations in Canada and the United States. Additionally, oil sands production has grown steadily. Existing oil pipelines are generally full, new oil pipeline projects are underway, and more oil has been moving by rail. New sources of U.S. natural gas are entering Canada through Ontario, reducing throughput on TransCanada’s Mainline from Alberta to markets in the east. Energy markets have been responding to these changes. Some adjustments happen quickly, while other adjustments take time.
Tolls increased notably on the TransCanada and Enbridge Mainlines; however, tolls on most pipelines were stable from 2008 to 2012. Pipeline companies and shippers resolved the majority of their toll and tariff issues in negotiated settlements. The Board resolved some issues through adjudicated toll proceedings or the complaint process. Financial ratios have remained stable and credit ratings have continued to be investment grade for the Canadian pipeline sector.
1. What the Board Measures
This assessment provides information about the major pipelines the Board regulates, and assesses the economic functioning of the pipeline transportation system. In a well-functioning pipeline transportation system:
- Available pipeline capacity moves products to consumers (Chapter 3)
- Services meet shippers’ needs at just and reasonable prices (Chapter 4)
- Pipeline companies can attract capital to build and expand their systems (Chapter 5)
An efficient pipeline transportation system effectively responds to changing market conditions. Since 2007 oil and gas markets have changed dramatically. Technological advances made it possible to economically produce vast quantities of oil and gas from tight and shale formations in Canada and the United States, and oil sands production increased. Although energy markets continually shift and evolve, this structural change will have long-term impacts on the industry. Energy markets have been responding to these changes. Some adjustments happen quickly, for example when pipelines introduce new transportation services. Other adjustments take time, for example it may take years to plan, seek approval for and build new pipeline facilities.
2. Supply and Disposition of Canadian Oil and Natural Gas
Figure 2.1 2012 Supply and Disposition of Canadian Crude Oil
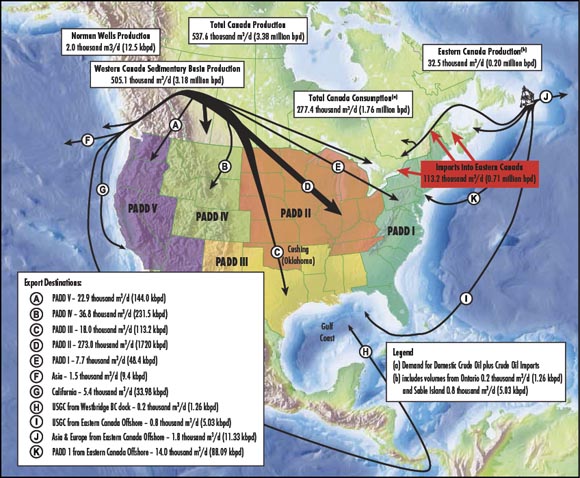
In 2012, Canada produced over 537 000 cubic meters per day (m3/d) or 3.38 million barrels per day (MMb/d) of crude oil, most of which was shipped via pipeline from western provinces to markets in other provinces or the U.S. (See Figure 2.1)
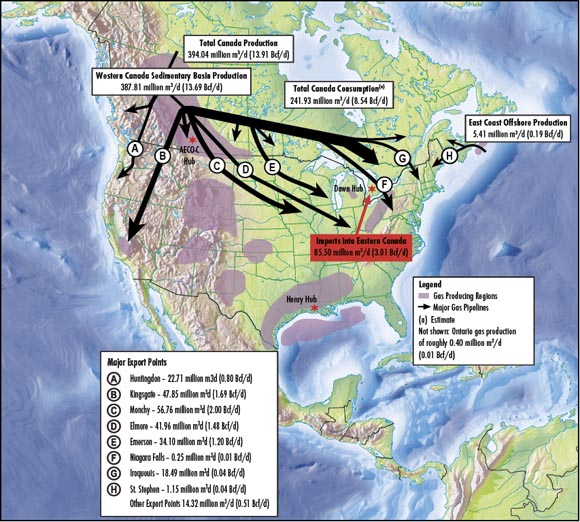
Canadian natural gas production averaged almost 400 million m3/d or 13.9 billion cubic feet per day (Bcf/d). The vast majority originated in Western Canada and was transported by pipelines to consumers in other parts of Canada and the U.S. as shown in Figure 2.2.
Figure 2.2 2012 Supply and Disposition of Canadian Natural Gas
3. Pipeline Capacity and Utilization
To assess pipeline capacity and utilization the Board studies two things. First, the Board examines how full pipelines are and the degree of oil pipeline apportionment (which is discussed in section 3.1.1). Determining the capacity on a pipeline is complex. Capacity varies with ambient temperature on gas pipelines and, for both oil and gas pipelines, is affected by maintenance, pressure reductions, etc. Additional factors must be considered for oil pipelines including the type of product, product mix, type of batching and pipeline configurations. For example, a pipeline can transport more light crude oil than heavy crude oil. Throughput measures how much product a pipeline actually transports, which the Board compares to the pipeline’s capacity. Apportionment is an indication that shippers would have moved more product on a given pipeline if it had more capacity. See Appendix 1 for detailed information on oil pipeline utilization and apportionment and Appendix 2 for detailed information on gas pipeline utilization.
Second, the Board compares the difference in the price of a commodity in two markets with the tolls for major transportation paths between those markets. Canadian gas and oil producers receive a netback price which is determined by the price of the product in a certain market, minus the cost of moving product to that market. For oil, the netback is based on world oil prices for a comparable type of oil. Reference prices in North America are set relative to West Texas Intermediate (WTI) at Cushing, Oklahoma and, for offshore crude oil, North Sea Brent (Brent). If pipeline capacity is unconstrained, the markets which provide the highest netbacks will receive more supply, pushing prices lower in that market. Markets providing the lowest netbacks will receive less supply, pushing prices upward in that market. If this trend continued, the price differential between the two markets would become equal to the cost of transportation between the two markets. Accordingly, comparing the price differentials between two markets and the transportation tolls provides information about the amount of available pipeline capacity.
If pipelines have spare capacity, tolls may become higher if the costs are shared by the remaining shippers. Tolls are the cost of moving a product from one location to another, and the price differential is the benefit of moving a product. Shippers will want to move their product to another market if the price differential is higher than the toll. If the price differential is lower than the toll they may still move the product for a variety of reasons, for example if the shipper holds firm transportation contracts or in order to meet consumer demand.
The costs associated with constrained pipeline capacity can be significant. If pipelines are full, shippers cannot move additional product to more profitable markets by pipeline. These constraints can cause price differentials to grow as the oversupply in one market continues to drive prices lower in that market. Producers and governments may forego substantial revenue in such circumstances.
3.1 Oil and Liquids
3.1.1 Oil and Liquids Pipelines Capacity Utilization and Apportionment
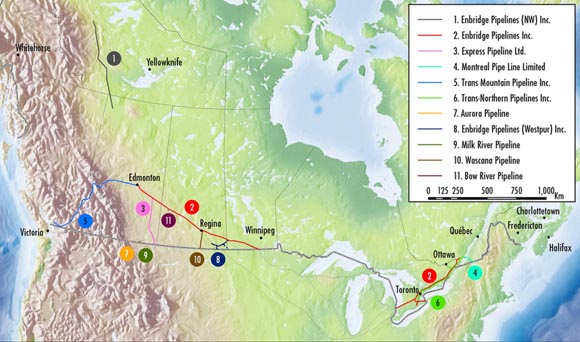
Figure 3.1 shows the major oil pipelines regulated by the National Energy Board. Some oil pipelines operate as common carriers: each month, shippers nominate volumes for delivery into the pipeline. In a given month, if shippers nominate more volume than the pipeline can transport then each shipper’s nominated volume is apportioned or reduced by the same percentage. Apportionment can be driven by growing oil supply, increased oil demand, pipeline reconfigurations and reduced pipeline capacity. Recently Enbridge and Trans Mountain significantly apportioned volumes.
Some oil and petroleum products pipelines had spare capacity; however, overall capacity out of Canada was constrained as indicated by significant apportionment on the Enbridge and Trans Mountain systems. Rapid growth in Western Canadian oil sands and U.S. tight oil production created a surplus of oil in the mid-continent since 2011, exacerbated by limited pipeline capacity to coastal markets. Oil pipeline capacity has recently been added out of Western Canada; however, constraints on connecting pipelines and capacity reductions on major lines limited capacity from 2010 to 2013. See Appendix 2 for detailed information on oil pipeline use and apportionment.
Rail became an increasingly important alternative method for transporting western Canadian crude oil to higher value markets. From January through November 2013, an average of 19 585 m3/d or 123 thousand barrels per day (Mb/d) of crude oil was exported to the U.S. by rail. Most of this oil, 17 217 m3/d (108 Mb/d), went to PADD I and PADD III. During the same period of time, 20 444 m3/d (129 Mb/d) travelled by pipeline to PADD I and PADD III. (See Figure 2.1 for the locations of PADD I and PADD III.)
Figure 3.1 Major Oil Pipelines Regulated by the NEB
3.1.2 Oil Price Differentials And Tolls
As a result of tight pipeline capacity, North American crude oil prices were discounted compared to global crude oils, especially in Western Canada.
Figure 3.2 Light Sweet Crude Edmonton Par Price vs. Light Sweet Export Price and Louisiana Light
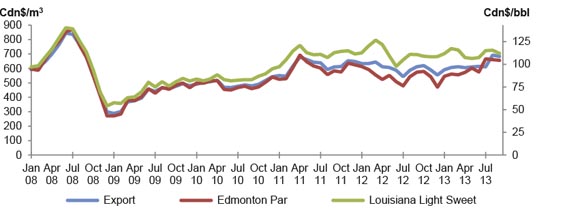
Figure 3.2 compares the netback export price of light crude oil from Edmonton, Alberta (the blue line) with the posted price of Edmonton Par (the red line) and the price of Louisiana Light Sweet at the Gulf Coast (the green line). When pipeline capacity from Edmonton to the U.S. Gulf Coast is adequate, these prices should be similar as they were prior to 2010. Due to capacity constraints from 2010 on, Canadian prices were discounted compared to Louisiana Light Sweet - especially in 2012 and early-2013.
Figure 3.3 Western Canada Select vs. Heavy Crude Export Price and Mexican Maya
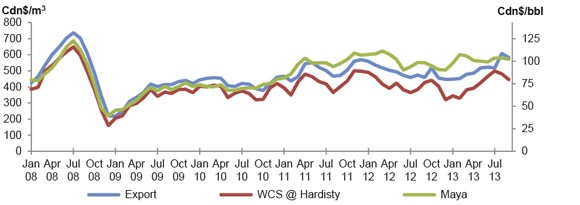
To look at prices for heavy crude oils, figure 3.3 shows Western Canada Select prices at Hardisty, Alberta (the red line) and Canadian netback export prices (the blue line) versus Maya in the U.S. Gulf Coast (the green line). Price differences began to widen after 2010 and continued to do so in 2012 and 2013. As was the case for light crude oil, thisindicates constrained pipeline capacity to move heavy crude oil to export markets.
By December 2012, WTI was discounted $22 per barrel compared to Brent4. Edmonton Par was further discounted $12 per barrel (therefore $34 less than Brent). In February 2013, the Western Canadian Select discount from WTI reached $40 per barrel5. Canadian and U.S. Midcontinent crude oil prices began to increase in the second half of the year with new pipeline takeaway capacity from Cushing, increased crude-by-rail volumes, and fewer refineries undergoing maintenance. However, going into the winter season discounts began to increase again.
The price discounts on Canadian crude oils greatly exceed the cost of pipeline transportation between the markets, and generally exceed the cost of rail transportation. The tolls to ship oil from Edmonton/Hardisty to Cushing are about $5 to $6.55 per barrel, depending on type of oil and which pipeline systems are used. It costs approximately another $3 per barrel to reach the Gulf Coast from Cushing; however, some of these lines require long term committed contracts. Rail costs are roughly double or triple the pipeline tolls.
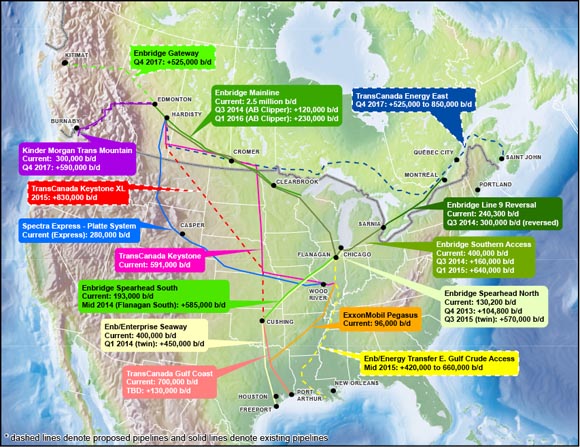
Price differentials that are higher than tolls provide an incentive to apply to build new pipeline capacity, but it takes many years from the time a pipeline is conceived of to the time it may be put into service. Figure 3.4 shows the many proposed pipelines that are in various stages of development, including the proponents’ proposed in-service dates. These proposals are evidence of the market responding to the recent constraints in oil pipeline capacity.
Figure 3.4 Canadian and U.S. Crude Oil Pipelines and Proposals
3.2 Natural Gas
3.2.1 Natural Gas Pipelines Capacity Utilization
Comparing throughput to capacity on NEB-regulated natural gas pipelines shows pipeline capacity is available across the country and most natural gas pipelines are well used. On the TransCanada Mainline, throughput has been declining on the Prairies and Northern Ontario segments. Natural gas produced from the U.S. Rockies region and U.S. shale gas plays, such as the Marcellus, increasingly competes with Canadian supply delivered on TransCanada’s Mainline into key markets such as Ontario, the U.S. Midwest and the U.S. Northeast. This new supply displaces gas which TransCanada’s Mainline transports from the Western Canadian Sedimentary Basin (WCSB) to these markets. Additionally, low gas prices reduced production in the WCSB and more natural gas production was absorbed in Alberta’s oil sands industry, decreasing the overall availability of WCSB gas for export. An average of 29 percent of the capacity on the Prairies segment and 38 percent of the capacity on the Northern Ontario segment was used in the first nine months of 2013.
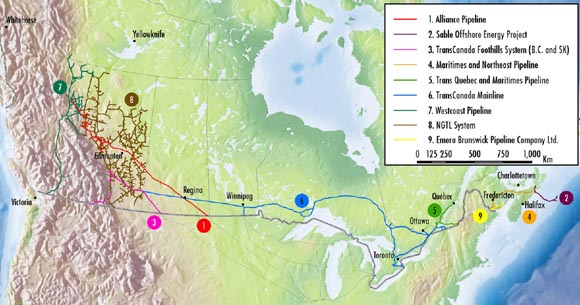
Figure 3.5 Major Natural Gas Pipelines Regulated by the NEB
3.2.2 Natural Gas Price Differentials and Firm Service Tolls
Figure 3.5 shows the major natural gas pipelines regulated by the National Energy Board. Tolls on some natural gas pipelines have increased due to declining use of the pipelines from 2010 to 2012, notably on the TransCanada Mainline. As less gas was shipped from Western Canada on TransCanada’s Mainline, tolls increased for remaining customers. The firm transportation toll (and fuel costs) between Alberta and Dawn increased by 73 percent, from an average of $1.25/GJ in 2006 to an average of $2.16/GJ in the first half of 2013. Following the RH-003-2011 proceeding, the Board approved new tolls, which decreased the toll on the NIT to Dawn path to $1.64/GJ starting in July 2013.
Figure 3.6 Alberta-Dawn Price Differential vs. TransCanada Toll
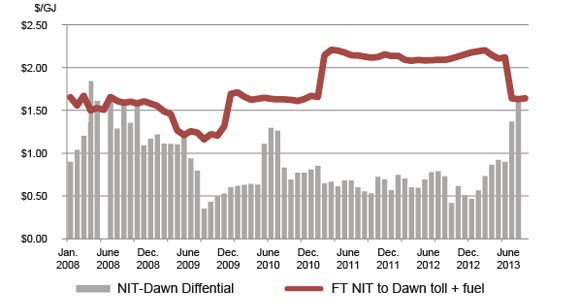
Figure 3.6 shows the price differential compared with the firm tolls on NGTL and the TransCanada Mainline between the NIT hub in Alberta and the Dawn hub in southern Ontario. While the price differential fluctuated, it was generally well below the total cost of transportation6 indicating pipeline capacity is unconstrained between the hubs. The price differential between the NIT and Dawn hubs increased in the summer of 2013 to approximately equal the firm transportation toll between the two hubs. In the fall of 2013, the price differential between the NIT and Dawn hubs again decreased below the toll level.
Figure 3.7 Sumas-Station 2 Price Differential vs. Westcoast Toll
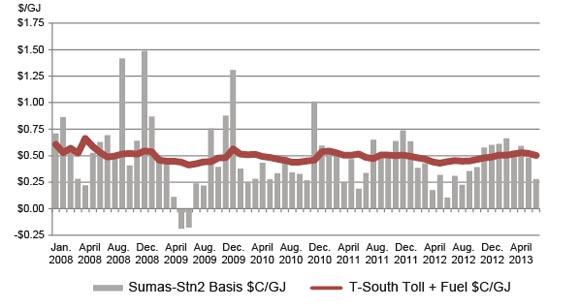
On other pipelines price differentials were closer to the tolls. For, example Figure 3.7 shows the price differential on Westcoast’s Southern Mainline (T-South) pipeline compared with the toll for transportation. Except for peak winter months, the price differential has been close to the7 toll, indicating adequate capacity exists on this pipeline.
Exceptions may be seen during winter peaks or other periods of high demand which can temporarily increase price differentials between certain markets. A price differential much lower than tolls may indicate pipeline capacity is underutilized. However, prices are influenced by an array of supply and demand dynamics at the production and market ends of the pipeline, as well as variable transportation costs between markets. Overall, with increased natural gas production in North America and more pipeline interconnections between new supply areas and markets, price differentials between hubs in general in North America have been decreasing.
[4] Historically, WTI has traded at a slight premium to Brent.
[5] Historically, Western Canadian Select has been discounted around $18 from WTI, a reflection of pipeline tolls and Western Canadian Select being heavy and sour.
[6] Firm transportation toll plus fuel on the TransCanada Mainline.
[7] Firm service toll for transportation, including fuel costs between Compressor Station 2, near Chetwynd, B.C., and the export point located near Huntington, B.C
4. Services At Reasonable Prices (Tolls)
Ideally pipeline companies provide services that meet the needs of shippers at stable and reasonable prices (tolls). To assess this, the Board monitors the stability of pipeline tolls and the nature and frequency of negotiated toll settlements versus litigated toll proceedings. The Board also considers formal complaints.
4.1 Pipeline Tolls Index
Stable and reasonable tolls are a key concern for shippers. With cost of service regulation, large expenditures can increase or decrease tolls depending on the impacts on throughput. Often, lower throughput or revenues lead to higher tolls as the pipeline’s costs are shared by the remaining shippers on the system.
Figure 4.1 Benchmark Oil Pipeline Tolls 2008-2013

Figure 4.1 shows changes in oil pipeline tolls, normalized to 2008 levels. The dashed black line is the GDP deflator which is one measure of the rate of inflation. Most tolls have been relatively stable over the last decade, tracking closely with changes in GDP. However, the tolls on the Enbridge system (the red line) have increased significantly in recent years largely due to costs for the Southern Access Project, Southern Lights Replacement Capacity, the Line 4 Extension, and Enbridge Alberta Clipper Pipeline.
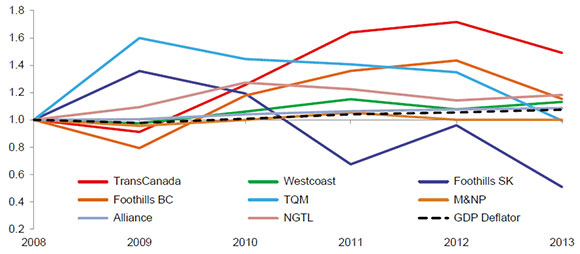
Figure 4.2 shows changes in natural gas pipeline tolls compared to the GDP Deflator. It illustrates that TransCanada’s tolls have increased more in recent years than tolls on other natural gas pipelines. While tolls on other pipelines varied from 2008 to 2013, most were more closely aligned with the GDP deflator from 2012-2013. This indicates tolls charged in 2013 are similar to the tolls charged five years ago. The exception was Foothills Saskatchewan, as discussed in Appendix 3, which contains detailed information on benchmark tolls by pipeline.
Figure 4.2 Natural Gas Benchmark Tolls 2008-2013
4.2 Negotiated Settlements and Toll Proceedings
Pipeline companies and shippers resolved most toll and tariff issues with negotiated settlements. Major pipelines regulated by the Board have operated under negotiated settlements during all or a portion of the last five years. The Board adjudicated contentious toll and tariff applications that were not resolved through negotiation and issued decisions on nine toll-related matters between 2008 and 2013. Many of these proceedings focused on specific issues other than overall tolls. Examples of the topics adjudicated by the Board include: the integration of two pipeline systems; a surcharge for certain financing costs; a new toll structure in response to dramatic market changes including new gas supply; firm service on an oil pipeline; and designation of a priority destination. See Appendix 4 for details of settlements, toll proceedings and complaints.
Abandonment Funding
The Board has been dealing with this ongoing toll-related matter for several years. In 2009, the Board directed that all NEB-regulated companies would begin setting aside funds to cover future pipeline abandonment costs in five years. An underlying principle was that pipeline companies, and not landowners, are liable for the costs and financing of pipeline abandonment. Collectively, all NEB-regulated pipelines will need to collect $7.2 billion dollars to fund the future costs of pipeline abandonment based on current estimates.
Most companies have many years to fund these future costs. In 2013, companies filed their plans to accumulate the money for pipeline abandonment, as well as their mechanism for protecting that money. Many of these filings propose trust funds, and provide information on investment policies. Many companies included a plan for collecting from shippers any extra funds needed to cover future abandonment costs. Following Board decisions on these filings, companies will report on the funds they have set aside starting in 2015. Regular updates and revisions will be required on the estimated amount of funds needed and set aside. As pipelines approach the end of their useful lives, companies should provide more detailed revisions and increasingly consult with landowners.
4.3 Formal Complaints
Shippers can file a complaint with the Board if they are unable to resolve concerns with a pipeline on toll, tariff or access matters. The Board received nine formal shipper complaints from 2009 to mid-2013. The complaints involved: treatment of costs for additional facilities; requiring a pipeline to receive natural gas liquids; an incentive toll that could apply to only one shipper; allocation of receipt point capacity; interpretation of what is acceptable third party verification for tenders; tariff provisions including the level of tolls for committed versus uncommitted service; providing facilities for receiving oil and the toll for service on those replacement facilities; a refusal to provide service for blended acid gas; and calculation of tolls. See Appendix 4 for additional details.
5. Ability to Attract Capital
Financial ratios have remained stable and credit ratings have continued to be investment grade for the Canadian pipeline sector even throughout the financial crisis. Appendix 5 contains detailed information on the financial integrity of Board-regulated pipelines.
5.1 Common Equity and Return on Equity
A common equity ratio is the percentage of common equity in a company's capital structure. Higher common equity ratios increase the likelihood that a company can meet its financial obligations, including repaying debt. The Board typically approves a Group 18 Pipeline’s return on equity (ROE) and a common equity ratio9 along with its tolls through either adjudication or after reviewing a negotiated settlement. From 2008 through 2012, NEB-regulated natural gas pipeline companies were deemed by the Board to have common equity ratios between 30 and 40 percent depending on the pipeline’s circumstances.
The ROE actually earned by a company may vary from the NEB-approved levels for various reasons such as throughput changes, incentives, profit-sharing mechanisms and cost variances. As a result of the various incentives, most Group 1 pipelines have achieved actual ROEs that are greater than their allowed ROEs. In 2012, achieved ROEs varied from 9.36 percent to 11.5 percent. The exception was Westcoast Field Services, which is in the gathering and processing business. It earned 19.25 percent.
5.2 Financial Ratios
Financial ratios examine a company's performance and financial integrity, based on information from its financial statements10. The evaluation of financial ratios is most meaningful when a company’s ratio is compared with an industry standard over time. The fixed-charges coverage ratio and the cash flow to total debt ratio both measure a company’s ability to meet its debt obligations and fixed payments. Higher ratios indicate a higher likelihood the company will meet its obligations and may indicate greater borrowing capacity. From 2006 to 2011, these ratios remained fairly constant or increased for most NEB-regulated companies examined.
5.3 Credit Ratings
In Canada, pipeline credit ratings are usually determined by three independent credit rating agencies: Dominion Bond Rating Service (DBRS), Standard & Poor's (S&P), and Moody's. Because a company's ratings are the expert opinion of the credit rating agency, they are somewhat subjective and different agencies may provide different ratings for the same company. Credit ratings assess the probability a debt issuer will live up to its obligations and therefore indicate the financial integrity of the rated company. Credit ratings for NEB-regulated pipelines and pipeline owners continued to be investment grade between 2007 and 2012.
[8] Group 1 and Group 2 pipelines are listed in Appendix 6.
[9] The Board may deem a common equity ratio which is a notional capital structure used for rate-making purposes that may differ from a company's actual capital structure.
[10] A variety of ratios can be used to evaluate a company's liquidity, operating performance, growth potential, and risk. Care must be exercised in the interpretation of these financial ratios as reported financial information may pertain to a parent company and include non-regulated assets and/or assets from different industries.
Appendix 1 – Oil Pipeline Utilization and Apportionment
Enbridge Pipelines Inc. (Enbridge)
The Enbridge Mainline system is Canada’s largest transporter of crude oil, with 2 306 km of crude pipeline delivering on average more than 2.2 million barrels per day of crude oil and liquids. It originates at Edmonton, Alberta and extends east across the prairies to the Canada-U.S. border near Gretna, Manitoba where it joins with Enbridge’s Lakehead System. It re-enters Canada at Sarnia, Ontario and extends east to Montreal, although oil flows westward from Montreal to Westover. Figure A1.1 from Enbridge depicts the system’s configuration. The Lakehead system also connects with pipelines that deliver crude oil to Cushing, Oklahoma and the U.S. Gulf Coast.
The Enbridge Mainline has six lines exiting Western Canada. Five lines originate in Alberta and terminate in Superior, Wisconsin:
- Line 1 transports natural gas liquids, synthetic crude oil and refined petroleum products, with a capacity of 37 600 m3/d (237 Mb/d). The refined products are delivered upstream of Superior, leaving only natural gas liquids and synthetic crude oil landing into the Superior tank farm.
- Lines 2 and 3 ship light crude oil and condensates, with capacities of 70 300 m3/d (442 Mb/d) and 62 000 m3/d (390 Mb/d), respectively.
- Line 4 and Line 67 (known as Alberta Clipper) transport heavy crude oil, with capacities of 126 500 m3/d (796 Mb/d) and 71 400 m3/d (450 Mb/d), respectively
The sixth line, Line 65, ships up to 29 500 m3/d (186 Mb/d) light and medium crude oil from Cromer, Saskatchewan to Clearbrook, Minnesota.
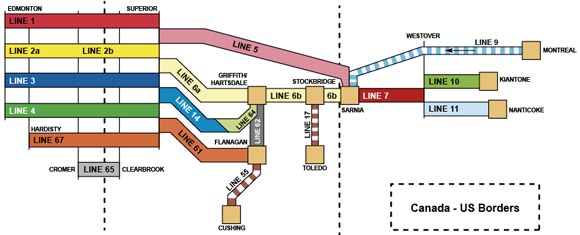
Figure A1.1 Enbridge Pipeline System Configuration – 2013
The Enbridge Mainline and Lakehead systems combined are designed to export about 397 400 m3/d or 2.5 MMb/d. However, capacity constraints on sections of the U.S. system have reduced the actual crude oil capacity out of Western Canada to Superior to about 302 000 m3/d (1.9 MMb/d). Figure A1.2 illustrates Enbridge Mainline throughput versus export capacity. In 2012, throughput averaged 283 000 m3/d (1.8 MMb/d) which decreased slightly in the first half of 2013 to 281 000 m3/d (1.77 MMb/d).
Line 6B transports crude oil and liquid petroleum products from Griffith, Indiana to Sarnia, Ontario. In July 2010 it ruptured in Michigan, spilling an estimated 3100 cubic metres (m3) or 19,500 barrels of heavy crude oil. Line 6B was taken out of service for nine weeks and has been operating at reduced pressure since the spill. Line 6A leaked an estimated 970 m3 (6,100 barrels) after an incident in September 2010. The line was shut down for eight days and has been operating at reduced pressure since the spill. Portions of Line 6A have been replaced, and the project to replace all of Line 6B and restore it to its full 41 300 m3/d (260 Mb/d) design capacity may be completed by mid-2014.
Figure A1.2 Enbridge Mainline Throughput vs. Design Capacity
Line 9 has a capacity of 38 200 m3/d (240 Mb/d), and transports oil from Montreal, Quebec to refineries at Sarnia, Ontario. Shipments on Line 9 decreased for several years, and in July 2012 Enbridge received Board approval to reverse the flow of the pipeline between Sarnia and North Westover station in Ontario. The design capacity of the reversed Line 9 would be 26 858 m3/d (169 Mb/d). The in-service date was fall 2013. In November 2012, Enbridge filed an application with the NEB to reverse the section of Line 9 stretching from North Westover to Montreal (known as Line 9B) and to expand the capacity of the entire Line 9 to approximately 47 680 m3/d (300 Mb/d).
Figure A1.3 Enbridge Apportionment in the U.S. (percent)
The Southern Lights pipeline came into service in July 2010. It extends west from Manhattan, Illinois to Edmonton, Alberta. It has a capacity of 28 600 m3/d (180 Mb/d) and transports light hydrocarbons (diluents) from the Chicago area for use in blending Alberta’s bitumen and heavy oil production. Due to growing requirements for diluent imports into Alberta, Enbridge is pursuing an expansion of Southern Lights.
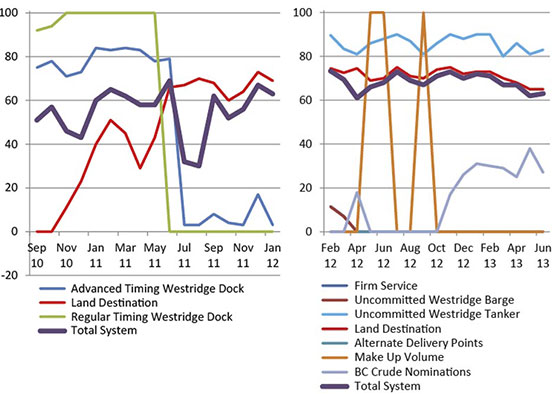
Apportionment on Enbridge
Apportionment on the Enbridge Mainline system generally occurs downstream of Superior. Enbridge apportionment announcements in the U.S. are shown in Figure A1.3. Enbridge Line 5 from Superior to Sarnia has consistently been under apportionment since September 2010.
Trans Mountain Pipeline ULC (Trans Mountain)
The Trans Mountain pipeline, owned by Kinder Morgan Inc., transports crude oil, and refined and semi-refined petroleum products west from Edmonton, Alberta to locations in both British Columbia and Washington State. Crude oil is also shipped to offshore markets via Trans Mountain’s Westridge Dock in Burnaby, B.C.
When heavy crude oil is shipped, it reduces the capacity of the pipeline. Figure A1.4 shows two capacities for the Trans Mountain pipeline; one assumes no shipments of heavy crude oil and the other assumes 20 percent heavy crude oil. Trans Mountain’s current capacity, assuming 20 percent heavy crude oil, is 47 600 m3/d (300 Mb/d). Approximately 26 percent, 21 percent, and 23 percent of Trans Mountain’s deliveries were heavy crude oil in 2010, 2011, and 2012, respectively.
Figure A1.4 Trans Mountain Pipeline Throughput vs. Capacity
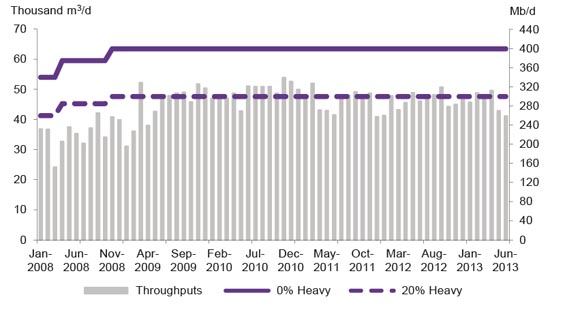
The pipeline has been under apportionment for the past several years. In 2012, average throughput on Trans Mountain was 46 160 m3/d (290 Mb/d). For the first half of 2013, throughput averaged 47 200 m3/d (297 Mb/d).
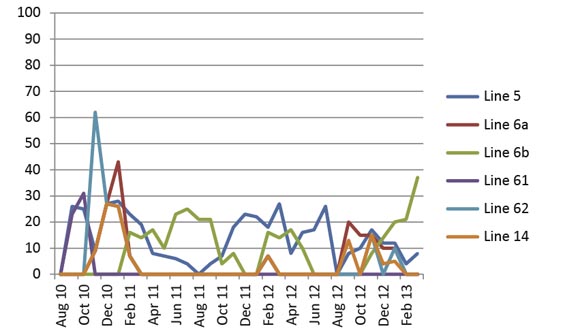
Capacity on the Trans Mountain pipeline system is allocated based on delivery destination – either to land destinations in B.C. and Washington State or to the Westridge Dock in Burnaby, B.C.
Apportionment on Trans Mountain
Figure A1.5 Trans Mountain Apportionment (percent)
In 2007, the Board approved an amended formula for allocating capacity to domestic and export destinations. Previously, dock capacity was allocated to shippers based upon a lottery. Dock nominations are now apportioned based on a monthly bid premium process. Shippers bid a premium above the pipeline toll to secure full tanker or barge cargoes from the Westridge dock. The highest total bids, considering bid premium and volume, are successful. Dock nominations that are submitted two days in advance have priority over regular timing nominations for dock and pipeline capacity allocation. Land nominations take priority over regular timing dock nominations as well. If land nominations meet or exceed their capacity allocation, 100 percent of regular timing dock nominations will be apportioned.
In December 2011, the Board approved Trans Mountain’s request for Firm Service with respect to the Westridge dock. By granting the approval, 4 300 m3/d (27 Mb/d) of capacity was reallocated from land destinations to the Westridge dock, making the total capacity for land destinations 35 000 m3/d (221 Mb/d) and Westridge dock 12 600 m3/d (79 Mb/d). Under the new system, 8 600 m3/d (54 Mb/d) is subject to firm commitments, while the remaining 4 000 m3/d (25 Mb/d) is available for uncommitted volumes. Uncommitted dock volumes are now divided into two subcategories: tankers and barges. Firm Service shippers are required to nominate committed volumes two days in advance, as this dictates the amount of uncommitted capacity available. The previously determined bid process for advanced and regular uncommitted dock nominations was maintained. The new allocation with Firm Service was implemented in February 2012. Figure A1.5 shows the apportionment on the Trans Mountain Pipeline system as announced under the two different methodologies.
Express Pipeline Ltd. (Express)
Figure A1.6 Express Pipeline Throughput vs. Capacity
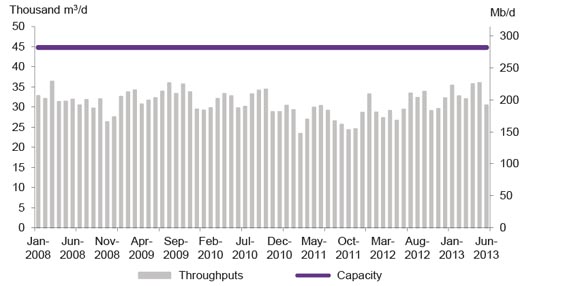
The Express Pipeline System consists of two pipelines, Express and Platte. The Express Pipeline originates in Hardisty, Alberta and transports crude oil to markets in the Rocky Mountain region including Montana, Wyoming, Utah and Colorado. The pipeline connects with the Platte Pipeline at Casper, Wyoming for deliveries to refineries located in Kansas and Illinois. In March 2013, Kinder Morgan sold its share of the Express Pipeline System to Spectra Energy, which now has full ownership. Express operates under long-term firm service contracts with its shippers for a majority of its capacity.
Express has a design capacity of 44 900 m3/d (280 Mb/d). However, due to capacity constraints on the Platte system, increasing competition for capacity from Bakken tight oil production, and limited market demand in the Rockies, the practical Canadian export capacity is approximately 31 800 m3/d (200 Mb/d). Figure A1.6 illustrates the throughput and capacity for Express. In 2012, throughput averaged 30 390 m3/d (191 Mb/d). In the first half of 2013, throughput averaged 33 740 m3/d (212 Mb/d).
Trans Canada Keystone Pipeline (Keystone)
Commercial operations commenced for the first phase of Keystone in July 2010. At that time, Keystone provided 69 000 m3/d (435 Mb/d) of capacity from Hardisty, Alberta to the Wood River and Patoka market hubs in the U.S. Midwest. The second phase of Keystone became operational in February 2011, extending the system to Cushing, Oklahoma and adding 24 800 m3/d (156 Mb/d) of capacity. This brings the total system export capacity to 93 800 m3/d (591 Mb/d). Keystone operates under long-term contracts with its shippers for the majority of its capacity.
Figure A1.7 Keystone Throughput vs. Capacity
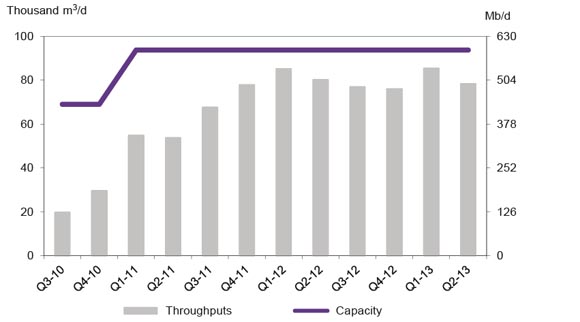
Figure A1.7 illustrates the gradual increase of utilization through 2010 and 2011. Throughput was lower in the second quarter of 2011 in part due to voluntary curtailments on the system. During this period, maintenance was performed to address faulty equipment that contributed to releases at two pumping stations on the U.S. portion of the line. In 2012, throughput averaged 80 300 m3/d (505 Mb/d), approximately 85 percent of capacity. In the first half of 2013, throughput averaged 81 850 m3/d (515 Mb/d), or 87 percent capacity.
Trans-Northern Pipelines Inc. (TNPI)
TNPI transports refined petroleum products west from Montreal to Toronto (with deliveries to the Ottawa area and other locations) and operates bi-directionally between Toronto and Oakville, Ontario. TNPI also transports refined products from Imperial Oil Limited's refinery at Nanticoke, Ontario east to Toronto. In October 2010, the Board put a system-wide pressure reduction of 80 percent of maximum operating pressure in place in response to its assessment of TNPI’s integrity management plan. The restriction is still in effect on parts of the system.
Figure A1.8 Trans Northern Throughput

Figure A1.8 shows that TNPI throughput averaged 30 500 m3/d (192 Mb/d) of petroleum products in 2012, and 32 200 m3/d (203 Mb/d) in the first half of 2013. The throughput shown is the volumes for all shippers delivered on the TNPI system which has multiple delivery locations and different capacities on each segment of the pipeline. For example, from Montreal to Farran’s Point the capacity is 21 000 m3/d (132 Mb/d); from Farran’s Point to Belleville the capacity is 11 500 m3/d (72 Mb/d); and, from Belleville to Toronto the capacity is 10 000 m3/d (63 Mb/d).
Natural Gas Liquids Markets Developments
Kinder Morgan Cochin Pipeline ULC
Figure A1.9 Cochin Throughput vs. Capacity

Kinder Morgan’s Cochin Pipeline (Cochin) is the largest and longest natural gas liquids pipeline in Canada. The 3000 km pipeline runs from Fort Saskatchewan, Alberta to Windsor, Ontario. It leaves Canada at the international border near Elmore, Saskatchewan and travels through seven U.S. states. Cochin has access to underground propane storage terminals at Fort Saskatchewan, Regina and Windsor, and interconnects with the Windsor-Sarnia Pipeline to allow the transfer of propane to Sarnia, Ontario.
In 2006, a defect was discovered in the U.S. portion of the pipeline and since 2007, Cochin has operated under a voluntary pressure reduction to 4137 kPa (600 psi) in Western Canada, limiting the effective capacity of the pipeline to about 11 130 m3/d (70 Mb/d) as shown in Figure A1.9, which is below the design capacity of 15 900 m3/d (100 Mb/d). Since 2007, Cochin has transported only propane from Canada as the transport of higher vapour pressure products such as ethane and ethylene was suspended after the discovery of the defect. Starting in April 2012, Cochin began service from Conway, Kansas and received near Iowa City, Iowa for ethane-propane mix which has a lower vapour pressure than pure ethane or ethylene.
In August 2012, Kinder Morgan applied to the Board for approval to reverse the western leg of the Cochin Pipeline. Citing a trend of declining natural gas output, and thus declining propane production, and a growing need for condensate for bitumen blending in Alberta, Kinder Morgan Cochin proposed reversing the Cochin for westbound service from Kankakee County in Illinois to Fort Saskatchewan, Alberta. An open season that closed in May 2012 resulted in 15 900 m3/d (100 Mb/d) of binding shipper commitments for a minimum 10-year period. The Board approved the Cochin Reversal Project which is scheduled to begin westbound shipments of condensate in the second quarter of 2014.
Vantage Pipeline
The Board approved the Vantage Pipeline project in January 2012, and the U.S. Department of Energy issued a Presidential Permit for the project in July 2013. The Vantage Pipeline will allow for the importation of ethane from Hess Corporation’s natural gas processing plant in Tioga, North Dakota through Saskatchewan to the interconnect with the Alberta Ethane Gathering System near Empress, Alberta. It will then carry the imported ethane for use in the manufacturing of ethylene by Alberta’s petrochemical industry. The Vantage Pipeline is approximately 700 km long, with 570 km in Saskatchewan, 130 km in North Dakota and 3 km in Alberta, and will have the capacity to transport 6 300 m3/d (40 Mb/d) [expandable to 9 500 m3/d (60 Mb/d) with the addition of two pump stations]. It is expected to go into service in early-2014.
Appendix 2 – Gas Pipeline Utilization
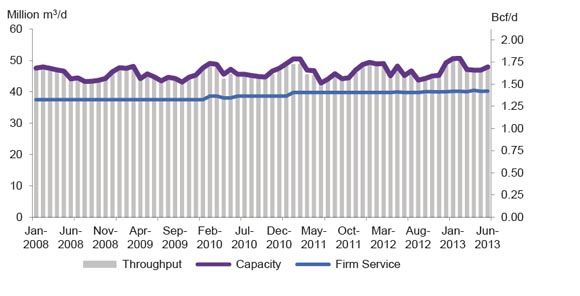
Westcoast Energy Inc. (Westcoast)
Figure A2.1 Westcoast T-South Throughput vs. Capacity
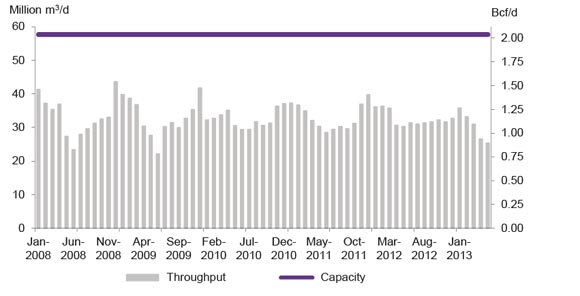
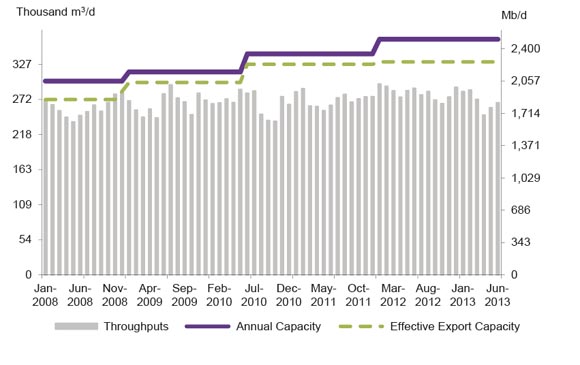
Figure A2.1 shows average monthly throughput on the southern leg of Westcoast’s natural gas pipeline system. The system extends from points in the Yukon Territory, the Northwest Territories, Alberta and B.C. to the Canada-U.S. border near Huntingdon, B.C. Westcoast’s pipeline connects to Northwest Pipeline in the U.S., which supplies natural gas to the U.S. Pacific Northwest market. Throughput on the Westcoast system (measured at Station 2 near Chetwynd, B.C.) averaged 32.5 million m3/d (1.1 Bcf/d) in 2012. For the first five months of 2013, throughput averaged 30.3 million m3/d (1.1 Bcf/d). Average capacity utilization was 57 percent in 2011, 56 percent in 2012, and 53 percent in the first half of 2013.
Figure A2.2 Westcoast Alberta Throughput vs. Capacity
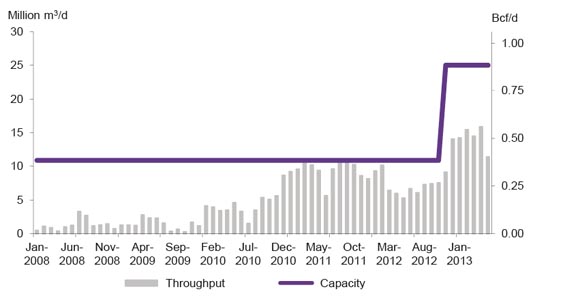
Figure A2.2 shows average monthly throughput exported from the northern area of the Westcoast system to the Nova Gas Transmission Ltd. System (NGTL) at two points in Alberta: Nova Gordondale and Sunset/Groundbirch. In 2012, throughput averaged 7.9 million m3/d (0.29 Bcf/d). In November 2012, the Sunset/Groundbirch interconnection with NGTL was commissioned, increasing export capacity to Alberta to 25 million m3/d (0.88 Bcf/d). For the first five months of 2013, throughput averaged 14.3 million m3/d (0.5 Bcf/d).
Alliance Pipeline Ltd. (Alliance)
Figure A2.3 Alliance Pipeline Throughput vs. Capacity
The Alliance pipeline transports liquids-rich natural gas from northeastern B.C. and northwestern Alberta to a pipeline hub in the area of Chicago, Illinois. The system draws from 52 receipt points, largely concentrated near the upstream end of the system.
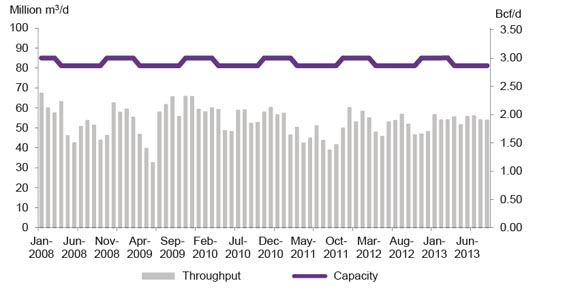
Figure A2.3 shows the average monthly throughput and capacity on the Alliance system. Alliance offers 39.7 million m3/d (1.4 Bcf/d) of firm service capacity. Additional capacity of up to a maximum of 10% of their contract quantity may be used by firm shippers at the cost of fuel only under Authorized Overrun Service. The total available capacity varies with ambient temperature and compressor unit availability (due to maintenance). Capacity has been contracted on a long-term basis and essentially fully utilized since the pipeline was put into service in December 2000. For the first six months of 2013, throughput averaged 47.9 million m3/d (1.7 Bcf/d) with capacity utilization of approximately 99 percent.
Nova Gas Transmission Ltd.
The Nova Gas Transmission Ltd. system (NGTL) consists of more than 25 000 km of natural gas pipeline, associated compression and other facilities located in Alberta and Northeastern B.C. NGTL has over 1100 receipt points and over 300 major delivery points. In 2012, approximately 103 billion m3 or 3,645 billion cubic feet (Bcf) was delivered on NGTL. Of that, 39 percent was delivered within Alberta and B.C.; 32 percent was delivered to systems supplying U.S. Midwest markets; 18 percent was delivered to systems supplying Pacific Northwest and California markets; and 11 percent was delivered to systems supplying Eastern Canada and U.S. northeast.
Figure A2.4 NGTL System Map

NGTL is divided into three project areas: Peace River, North & East, and Mainline as shown in Figure A2.4. Throughput information for Upstream James River, North & East Flows, and Eastern Gate correspond to those areas, respectively.
Figure A2.5 shows the average monthly throughput from the Peace River area entering NGTL upstream of James River. Natural gas from this area enters NGTL from receipt points located predominantly in Northwestern Alberta and Northeastern B.C. Since 2008, throughput upstream of the James River area has been increasing due to growing natural gas supply entering the NGTL from the Horn River and Montney supply areas in Northeastern B.C. via the Horn River and Groundbirch pipelines.
For the first six months of 2013, throughput averaged 179 million m3/d (6.3 Bcf/d), with average capacity utilization of 82 percent. Capacity increased in late 2011 from approximately 180 million m3/d (6.35 Bcf/d) to approximately 200 million m3/d (7.15 Bcf/d), then to approximately 218 million m3/d (7.7 Bcf/d) in late 2012 with the commissioning of additional compressor stations.
Figure A2.5 NGTL Upstream James River Throughput vs. Capacity
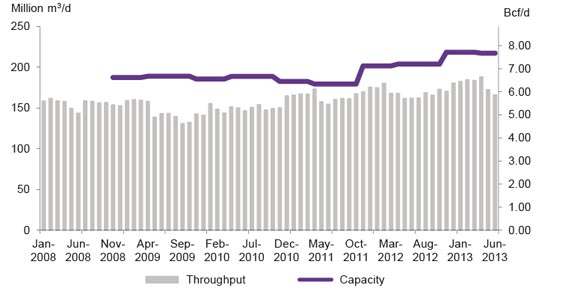
Figure A2.6 NGTL North and East Flows Throughput vs. Capacity
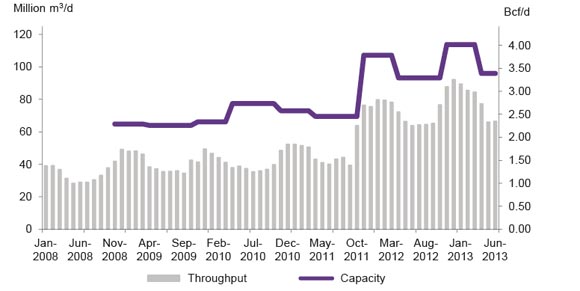
Figure A2.6 shows throughput versus capacity on the North and East areas of NGTL which captures intra-Alberta flows including natural gas used for oil sands operations in northern Alberta. Throughput averaged 78 million m3/d (2.8 Bcf/d) for the first six months of 2013. Capacity utilization averaged 73 percent in 2012 and 74 percent in the first six months of 2013.
Figure A2.7 NGTL Eastern Gate Throughput vs. Capacity
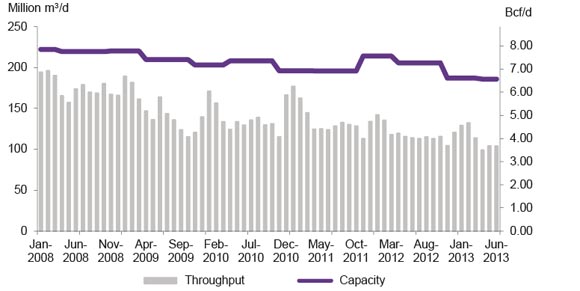
Figure A2.7 shows throughput versus capacity at NGTL’s Eastern Gate which interconnects with TransCanada’s Mainline at Empress, and the Foothills Pipe Lines Ltd. (Foothills) Saskatchewan system at the Alberta-Saskatchewan border (McNeill). For the first six months of 2013, throughput at Eastern Gate averaged 113.7 m3/d (4.0 Bcf/d). Capacity utilization averaged 68 percent in 2011, 58 percent in 2012 and 61 percent in the first six months of 2013.
Declining throughput since 2008 is largely attributed to lower demand at the Empress receipt point for long-haul transportation to eastern markets.
Foothills Pipe Lines Ltd.
Figure A2.8 Foothills B.C. Throughput vs. Capacity
Foothills pipeline system is approximately 1,240 km in length and transports natural gas from an interconnect with NGTL near Caroline in central Alberta, through areas in B.C. and Saskatchewan. Four zones make up the Foothills system. Zone 6 includes segments of Foothills Alberta located between Caroline and McNeill. Zone 7 includes the segment between Caroline and the Alberta-B.C. border. Zone 8 includes facilities between the Alberta-B.C. border and the Kingsgate export point in B.C. Zone 9 includes the facilities between McNeill and the Monchy export point in Saskatchewan. The Foothills B.C. system transports natural gas from the WCSB to a point on the Canada-U.S. border near Kingsgate, B.C. At the border, Foothills B.C. connects to the Gas Transmission Northwest system, which serves markets in the Pacific Northwest, California and Nevada.
Figure A2.8 shows the average monthly throughput on the Foothills B.C. system. For the first nine months of 2013, throughput on Foothills B.C. pipeline at the Alberta/B.C. border averaged 54 million m3/d (1.9 Bcf/d). The average pipeline capacity utilization was 59 percent in 2011, 62 percent in 2012, and 66 percent in the first nine months of 2013. Spare capacity is related to competing pipelines supplying the California market. U.S. natural gas supply from the Rocky Mountains, as well as the San Juan and Permian basins, compete with supply from the WCSB in California markets.
Throughput on the Foothills B.C. pipeline has remained relatively steady throughout the last five years, but throughput decreased slightly in 2011. This happened primarily due to the commissioning of the Ruby pipeline, a 1,086 km long natural gas transmission system that connected natural gas production in the Rocky Mountains with markets in Northern California. The Ruby pipeline competed directly with Foothills B.C. Throughput increased in 2012, as natural gas from the WCSB was competitively priced against Rockies production in Northern California markets. In 2013, natural gas purchased in the WCSB and delivered to Northern California markets continued to be competitively priced against Rockies production, resulting in higher throughput for the first half of 2013 compared with 2012. In 2013, increased Canadian exports to the California market came from higher demand for natural gas for power generation due to below average hydro levels and nuclear outages.
Figure A2.9 Foothills Saskatchewan Throughput vs. Capacity
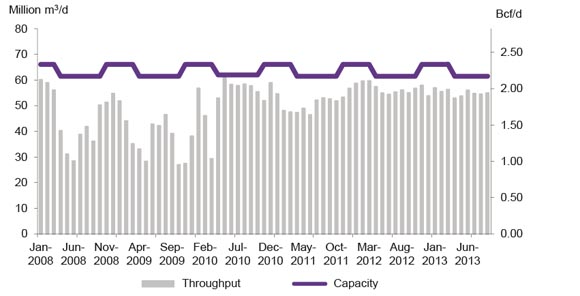
The Foothills Saskatchewan system transports natural gas from the WCSB to the Canada/U.S. border near Monchy, Saskatchewan. It connects to the Northern Border pipeline, which serves markets in the U.S. Midwest. Figure A2.9 shows monthly throughput at the Saskatchewan/U.S. border averaged 55 million m3/d (1.9 Bcf/d) in the first nine months of 2013. Average capacity utilization was 80 percent in 2011, 89 percent in 2012, and 87 percent in the first nine months of 2013.
From 2008 to 2010, throughput was high during peak demand periods in the winter months for winter heating demand and in the summer months to meet demand for power generation and storage injection. Throughput declined in the low-consumption spring and autumn months. Spare capacity during this time was related to increased supply competition from competing pipelines in the U.S. Midwest. In May 2008, the western leg of the Rockies Express pipeline in the U.S. became operational. This pipeline added 50.1 million m3/d (1.8 Bcf/d) of pipeline capacity to the U.S. Midwest and reduced requirements for Canadian gas into the region.
Starting in 2010, throughput on Foothills Saskatchewan increased and no longer displayed distinct seasonal patterns. Throughput increased due to the U.S. Midwest offering higher netbacks to WCSB producers compared with other markets, such as the U.S. Northeast, where growing Marcellus production displaced increasingly uncompetitive Canadian natural gas supply. Throughput on the Foothills Saskatchewan system again decreased slightly in early 2011, once the Bison pipeline was commissioned. The 487 km Bison pipeline transports natural gas from the Powder River Basin in Wyoming to an interconnection with the Northern Border pipeline in North Dakota. The pipeline has a capacity of 12 million m3/d (0.4 Bcf/d) and competes directly with the Foothills Saskatchewan pipeline. However, in 2012 throughput on the Foothills Saskatchewan pipeline increased. Displacement of Canadian supply to U.S. Midwest markets did not materialize owing to the commissioning of the Bison pipeline. Throughout 2012 and into 2013, throughput on the Bison pipeline remained low, due to flat production in the Powder River Basin and competition from other pipelines out of the Rockies.
TransCanada Pipelines Ltd. (TransCanada)
The 14,100 km TransCanada Mainline extends from a point just inside the Alberta border, across Saskatchewan, Manitoba and Ontario, and through a portion of Quebec. It connects to various downstream Canadian and international pipelines as shown in Figure A2.10.
Figure A2.10 TransCanada Mainline System Map
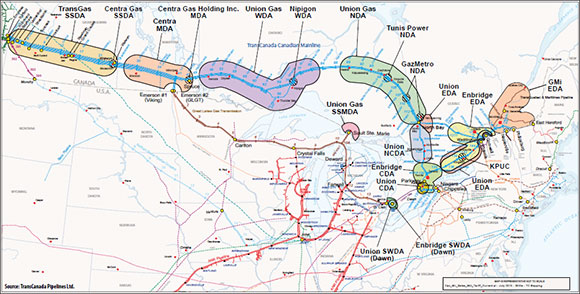
Figure A2.11 shows the average monthly throughput on the Prairies segment of the TransCanada Mainline. The Prairies segment extends from the Alberta/Saskatchewan border to compressor station 41, located near Île-des-Chênes, Manitoba, and from compressor station 41 south to a point on the Canada-U.S. border near Emerson, Manitoba. The Prairies segment connects to the Great Lakes Gas Transmission and Viking Gas Transmission systems which operate in the U.S.
Figure A2.11 TransCanada Mainline Prairies Segment Throughput vs. Capacity

Throughput on the Prairies segment averaged 57 million m3/d (2.0 Bcf/d) in the first nine months of 2013. The average utilization of the Prairies segment was 45 percent in 2011, 34 percent in 2012, and 29 percent for the first nine months of 2013, demonstrating spare capacity.
In the mid-2000s, excess capacity provided the impetus for TransCanada’s Keystone Pipeline project. With this initiative, TransCanada transferred Line 100-1 of its Mainline to TransCanada Keystone Pipeline GP Ltd (Keystone) for conversion to oil service. The Board approved this transfer and conversion in 2007 and construction began in 2008. The closure of Line 100-1 began in July 2008 and resulted in an average capacity reduction on the Mainline of approximately 14 million m3/d(0.5 Bcf/d) by the end of 2008.
Natural gas delivered into the U.S. northeast on competing pipelines has displaced gas coming from the WCSB on TransCanada’s Mainline. In 2008 and 2009, the Rockies Express pipeline began operations, delivering approximately 45 million m3/d (1.6 Bcf/d) to U.S. midwestern and U.S. northeastern markets which were traditional TransCanada Mainline markets. In 2009, the Emera Brunswick Pipeline also began operations, transporting re-gasified LNG from the Canaport LNG terminal in New Brunswick, further displacing TransCanada Mainline volumes into the U.S. Northeast market. However, the biggest factor was rising Marcellus production. According the U.S. Energy Information Agency, natural gas production in the northeastern United States rose from 2.1 billion cubic feet per day (Bcf/d) in 2008 to 12.3 Bcf/d in 2013.11 Significant new pipeline capacity was built in the U.S. during this period to transport new Marcellus production to markets. In November 2012, U.S. pipeline additions resulted in Marcellus volumes flowing into Ontario, reversing TransCanada’s Niagara export point to an import point, and further displacing the need for long-haul volumes through the Prairies segment.
The supply of natural gas available for transportation to eastern markets also decreased from 2008 to 2013. WCSB natural gas production decreased from 444 million m3/d(15.7 Bcf/d) in 2008 to 387 million m3/d (13.6 Bcf/d) in 2013 because gas prices were too low to support enough drilling to offset declines from existing production. Meanwhile demand for natural gas in Alberta increased from 2.5 Bcf/d to 4.1 Bcf/d. Natural gas-fired installed electricity generation capacity increased from 4.9 GW to 6.3 GW. Demand for natural gas for oil sands production, including requirements for electricity cogeneration, increased from 31 million m3/d (1.11 Bcf/d) in 2008 to 44 million m3/d (1.55 Bcf/d) in 2012.
Throughput was also lower as a result of changes in the contracting practices of the TransCanada Mainline shippers. As the price difference between the Alberta and Ontario (Dawn) markets narrowed, the profit from moving gas from Alberta to eastern markets decreased. Some shippers, particularly those in Quebec and Ontario, switched to alternative supply sources and they no longer needed long-haul transportation contracts originating in Alberta. De-contracting increased tolls for the remaining shippers, further exacerbating the weak economics of sending WCSB natural gas to eastern markets.
Figure A2.12 TransCanada Northern Ontario Line Throughput vs. Capacity

Figure A2.12 shows the average monthly throughput on the Northern Ontario Line (NOL) segment of the TransCanada Mainline which connects with the Prairies segment and depends on supply from the WCSB. The NOL extends east of Mainline compressor station 41, located near, near Île-des-Chênes, Manitoba, to Station 116 near North Bay, Ontario and contains facilities that interconnect Sault Ste-Marie, Ontario with the Great Lakes Gas Transmission system. South of Station 116, the NOL interconnects with the Eastern Triangle segment of the Mainline.
For the first nine months of 2013, throughput on the NOL segment averaged 39 million m3/d (1.4 Bcf/d). This represents an increase of 12 percent from the same time period in 2012. The average utilization of the NOL segment was 37 percent in 2011, 35 percent in 2012 and 38 percent for the first nine months of 2013. Throughput on the NOL has declined due to the same factors that have decreased throughput on the Prairies segment of the TransCanada Mainline. However, throughput on the NOL increases significantly in the winter months, as demand for home heating increases.
The Eastern Triangle segment of the TransCanada Mainline extends from past Station 116 located near North Bay, Ontario to southeastern and southwestern extremities of the system, supplying Ontario and Quebec markets, as well as export markets.
Figure A2.13 TransCanada Eastern Triangle Throughput vs. Capacity
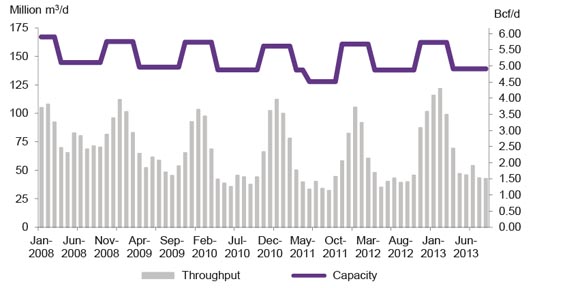
Figure A2.13 shows average monthly throughput on the Eastern Triangle segment. Throughput on the Eastern Triangle is measured as the sum of all TransCanada deliveries north of and including Parkway (TransCanada Mainline interconnect with the Union Gas system) and east of Station 116 (from the TransCanada Northern Ontario Line segment).
Throughput on the Eastern Triangle segment of the TransCanada Mainline averaged 70.9 million m3/d (2.5 Bcf/d) for the first nine months of 2013. The average capacity utilization of the Eastern Triangle segment was 41 percent in 2011, 42 percent in 2012 and 48 percent in the first nine months of 2013. Higher utilization in 2013 occurred due to below average winter temperatures in early 2013 and higher demand for natural gas for home heating.
Throughput on the Eastern Triangle segment of the TransCanada Mainline exhibits a seasonal pattern of higher throughput in the winter season to meet home heating demand. During the shoulder season, throughput decreased from 2008 to 2013. Lower shoulder season throughput resulted from displacement of WCSB gas in the U.S. Northeast markets, primarily with Marcellus shale gas supply. This resulted in lower throughput on the Eastern Triangle, as regional Marcellus production met U.S. Northeast demand, decreasing reliance on storage capacity in Ontario and transportation capacity on the Eastern Triangle segment of the Trans Canada Mainline.
Figure A2.14 TransCanada Mainline at Niagara Throughput vs. Capacity

The Niagara export point on the TransCanada Mainline is located near Niagara Falls, Ontario. In the U.S., the Mainline connects with the Tennessee Gas Pipeline system, which prior to November 2012, transported natural gas from the Mainline to markets in the U.S. Northeast. Figure A2.14 shows the average monthly throughput on the TransCanada Mainline at Niagara. Between 2008 and 2009, throughput at the export point averaged 17 million m3/d (0.6 Bcf/d). Between January 2010 and October 2012, throughput decreased, averaging 2.7 million m3/d (100 MMcf/d) as growing production in the U.S. displaced the need for Canadian imports.
In November 2012, additional facilities enabled the reversal of the natural gas flow so that Niagara could become an import point. Throughput at the time averaged 0.2 million m3/d (less than 7 MMcf/d) with a utilization rate of less than 1 percent. For the first six months of 2013, throughput at the import point averaged 12 million m3/d (0.4 Bcf/d), which is its capacity. The Tennessee Gas Pipeline system now delivers Marcellus shale gas to the TransCanada Mainline to serve markets in Ontario and Quebec. This supply may be re-exported at points further east on the TransCanada Mainline.
Figure A2.15 TransCanada Mainline at Iroquois Throughput vs. Capacity
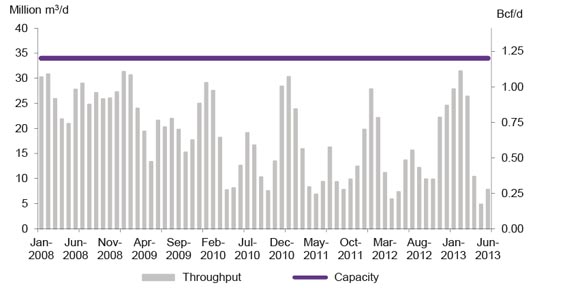
Figure A2.15 shows average monthly throughput on the TransCanada Mainline at the Iroquois export point near Iroquois, Ontario. This is where the Mainline connects with the Iroquois Gas Transmission System, which supplies natural gas to markets in the U.S. Northeast. Throughput at the Iroquois export point averaged 18 million m3/d (0.67 Bcf/d) for the first six months of 2013. This represents a utilization rate of 53 percent, compared to 43 percent during the same period in 2012. Throughput increased during this period due to below average temperatures in the U.S. Northeast, resulting in higher prices as demand increased for home heating. The higher prices pulled additional supply to Iroquois from the Dawn and NIT hubs. For several days, natural gas at regional markets in the U.S. Northeast and Canada traded at over $30/MMBtu, approximately 10 times higher than shoulder season prices of 2013.
Trans Quebec and Maritimes Pipeline Inc.
Figure A2.16 Trans Quebec & Maritimes Pipeline Throughput vs. Capacity

The Trans Québec & Maritimes Pipeline Inc. system (TQM) extends from an interconnection with the TransCanada Mainline system near Saint Lazare, Québec, to a point near Québec City in the Municipality of Lévis on the south shore of the St. Lawrence River. TQM also extends from Terrebonne, north of Montreal, to a point on the Canada-U.S. border near East Hereford, Québec. The TQM pipeline connects at the international border to the Portland Natural Gas Transmission System, which supplies natural gas to the U.S. Northeast market, primarily Vermont, New Hampshire, Maine and Massachusetts.
Figure A2.17 TQM Pipeline East Hereford Throughput vs. Capacity
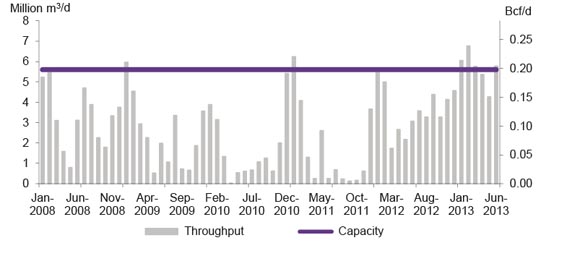
Figure A2.16 above shows average monthly throughput on TQM. Throughput averaged 13.4 million m3/d (470 MMcf/d) in 2012, up 16 percent from 2011. The average utilization of TQM in 2012 was 57 percent. For the first six months of 2013, throughput averaged 16.0 million m3/d (564 MMcf/d) with utilization of 68 percent. Throughput was higher during this period due to increased demand from U.S. Northeast markets experiencing periods of below average temperatures.
As Figure A2.17 shows, throughput on the TQM pipeline at East Hereford averaged 3.6 million m3/d (127 MMcf/d) in 2012, which is more than double the 2011 average of 1.7 million m3/d (60 MMcf/d). Average utilization was 30 percent in 2011, 64 percent in 2012 and 100 percent in the first half of 2013. Through the first half of 2013, throughput averaged 5.65 million m3/d (200 MMcf/d). Higher throughput was related to increasing regional demand in the U.S. Northeast and the Maritimes, particularly during the winter season.
Maritimes & Northeast Pipeline LP.
The Maritimes & Northeast Pipeline LP system (M&NP), commissioned in 1999, transports natural gas produced offshore Nova Scotia from the Sable Offshore Energy Project (Sable) and the Deep Panuke project, as well as from the McCully gas field in New Brunswick. M&NP extends from Goldboro, Nova Scotia, through New Brunswick to a point on the Canada-U.S. border near St. Stephen, New Brunswick. In the U.S., M&NP continues through Maine and New Hampshire into Massachusetts. It interconnects with Portland Natural Gas Transmission System, Tennessee Gas Transmission, and Algonquin Gas Transmission.
Figure A2.18 Maritimes & Northeast Pipeline Throughput vs. Capacity
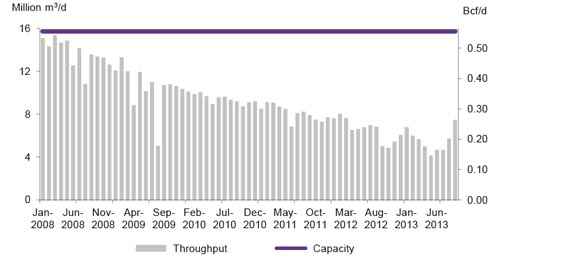
Figure A2.18 shows average monthly throughput on M&NP averaged 5.5 million m3/d (188 MMcf/d) for the first nine months of 2013, down 19 percent from the same period in 2012. The average capacity utilization was 51 percent in 2011, 41 percent in 2012 and 35 percent during the first nine months of 2013.
Overall, decreasing throughput on M&NP is related to declining Sable production. Two of the five gas fields that comprise Sable have been offline, decreasing supply to M&NP. Venture has been offline since October 2012, while South Venture was offline from October 2012 to June 2013. Starting in November 2012, throughput slightly increased on M&NP, due to additional supply coming in from the U.S. as an import. M&NP has ability to flow gas bi-directionally when required, bringing gas to Canada. This additional supply can come from Canaport in New Brunswick, or from the interconnect with Portland Natural Gas Transmission System. Throughput increased further in August 2013 when the second Nova Scotia offshore natural gas facility, Deep Panuke, was commissioned.
Figure A2.19 M&NP St. Stephen Daily Throughput
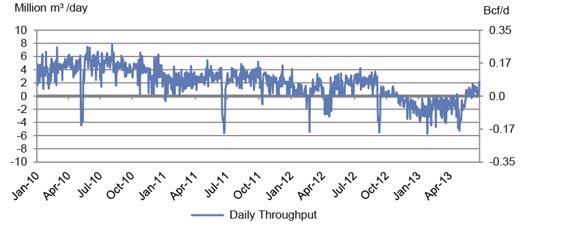
Figure A2.19 shows the daily throughput on M&NP at the St. Stephen export point. Traditionally, the Maritimes market was a net-exporter of natural gas to the U.S. In recent years however, with domestic production decreasing and domestic demand increasing, the Maritimes market is a net-importer of natural gas at certain times of the year. During these periods, the flow of natural gas on M&NP reverses and natural gas is transported northwards to the Maritimes. This primarily occurs during peak demand periods in the winter or when Sable is offline (for maintenance). During these periods, natural gas transported on M&NP comes from alternate sources such as interconnecting systems or vaporized liquefied natural gas from the Canaport terminal.
Emera Brunswick Pipeline Company Inc.
The Emera Brunswick Pipeline is a 145 km long natural gas pipeline that transports re-gasified natural gas from the Canaport LNG import-terminal near Saint John, New Brunswick to a point on the Canada-U.S. border near St. Stephen, New Brunswick. At the Canada-U.S. border, the Emera Brunswick Pipeline connects to the Maritimes & Northeast Pipeline. The Emera Brunswick Pipeline was commissioned in July 2009.
Figure A2.20 Emera Brunswick Pipeline Throughput vs. Capacity
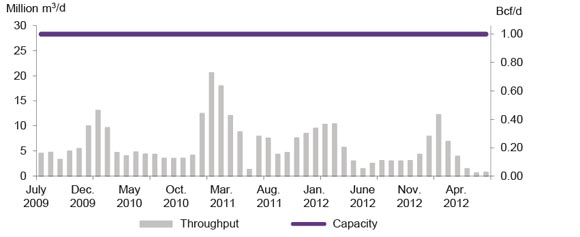
Figure A2.20 shows the average monthly throughput on the Emera Brunswick Pipeline. For the first six months of 2013, throughput averaged 4.1 million m3/d (146 MMcf/d), down from 4.5 million m3/d (159 MMcf/d) in 2012 and 8.7 million m3/d (307 MMcf/d) in 2011. The average pipeline capacity utilization was 31 percent in 2011, 16 percent in 2012, and 15 percent for the first six months of 2013.
Throughput on the Emera Brunswick Pipeline increases significantly during the winter months to meet peak demand. To illustrate, frigid weather in January 2013 pushed natural gas prices in the U.S. Northeast to US$30/MMBtu on certain days. As a consequence, on those days send-out from the terminal increased to 26.3 million m3/d (928 MMcf/d), representing a utilization rate of the Emera Brunswick Pipeline of 93 percent.
Deliveries of liquefied natural gas (LNG) to the Canaport terminal compete in the global LNG market for gas supply. Because world LNG costs are significantly higher than natural gas prices in Canada, deliveries of LNG to the Canaport terminal are often limited to one or two cargos per month. LNG at Canaport is stored in storage tanks until prices increase during the high demand winter season. Consequently throughput on the Emera Brunswick Pipeline is also impacted by LNG inventory at the terminal and operational restrictions.
[11] The Northeast includes Maine, New Hampshire, Vermont, Massachusetts, Rhode Island, Connecticut, New York, New Jersey, Pennsylvania, Delaware, Maryland, Virginia, West Virginia, Ohio, and Kentucky.
Appendix 3 – Benchmark Tolls
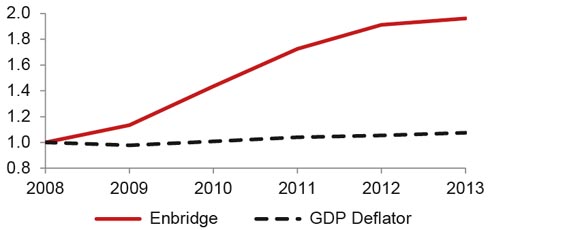
Figure A3.1 Enbridge Mainline Benchmark Toll
The figures in this Appendix show benchmark tolls for each pipeline compared to the gross domestic product deflator (shown as a black dashed line), normalized to 2008. Comparing tolls between individual pipelines is a challenge due to differing pipeline distances and other factors. Some normalization is required. Here the tolls are normalized by being compared to the toll level in 2008.
Figure A3.1 shows the Enbridge benchmark toll12 (from Edmonton to the International Border near Chippawa) rose significantly from 2008 to 2013. The toll rose by 13 percent in 2009 largely due to costs for the Southern Access, Southern Lights Replacement Capacity, and the Line 4 Extension projects. Tolls increased 26 percent in 2010 and approximately 20 percent in 2011, mainly as a result of Enbridge Alberta Clipper Pipeline costs.
Figure A3.2 Trans Mountain Benchmark Toll
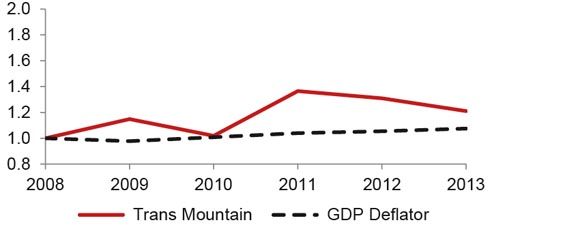
Figure A3.2 shows Trans Mountain's benchmark toll (from Edmonton to Burnaby) rose 15 percent in 2009 as a result of expansion program costs such as the Anchor Loop. Tolls declined 11 percent in 2010 mainly due to refunds associated with power costs and Non-Routine Capital Additions. The toll increased by 34 percent in 2011, mainly due to 2010 credit adjustments and under-recovery of the revenue requirement in early 2011. The net toll on Trans Mountain also varies with the Westridge Dock Premium Refund which has increased with the amount of Premiums paid. In 2013, the Board accepted Trans Mountain’s request to vary disposition of Westridge Dock bid premiums. The change refunded the 2010 premiums to shippers from May 2011 to March 2012. This somewhat levelled tolls, and the benchmark toll declined four percent in 2012. The toll further declined eight percent in 2013 with a three-year (2013 – 2015) incentive toll settlement.
Figure A3.3 Trans-Northern Benchmark Toll
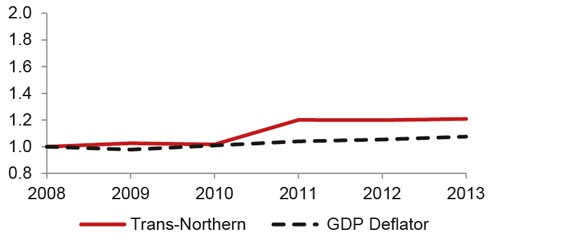
Figure A3.3 shows Trans-Northern’s benchmark toll (from Nanticoke to North Toronto) was steady between 2008 and 2010. It increased by 18 percent in 2011. The increase was mainly on account of a $6.5 million integrity allowance and a $4.5 million expense to cover cleanup costs related to four unforeseen events which occurred in 2010 (Rivière des Prairies, Bronte Creek, Montreal Feeder Line and 34 Raisin River block valve).
Figure A3.4 Express Benchmark Toll
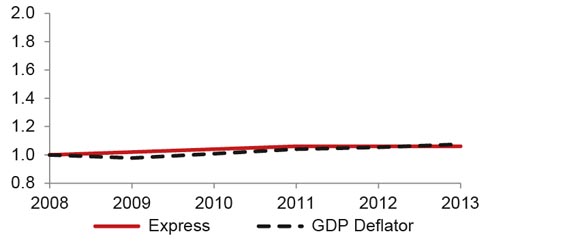
Figure A3.4 shows Express's benchmark toll13 moved roughly in line with the gross domestic product deflator.
Figure A3.5 shows TransCanada Mainline’s benchmark toll rose significantly from 2008 to 2013, particularly from 2009 to 2011. In 2009, the toll fell 9 percent due mainly to a reversal in deferral account balances from the prior year combined with higher projected miscellaneous revenues (e.g., from interruptible services), which more than offset the projected decline in firm contract demand.
Figure A3.5 TransCanada Mainline Benchmark Toll
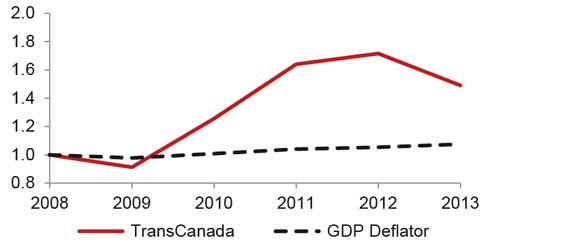
The 2010 toll increased 38 percent, due to projected decreases in miscellaneous revenues and firm contract demand, and deferral account balances flowed through from 2009. The toll increased 31 percent in 2011, due to declining firm contract demand and miscellaneous revenues. The 2012 interim toll of $2.24 was finalized for 2012, while TransCanada remained involved in the RH-003-2011 proceeding. The toll remained in effect for the first half of 2013 before declining to $1.65. On an annual basis, the toll was 13 percent lower in 2013.14
Figure A3.6 Alliance Benchmark Toll
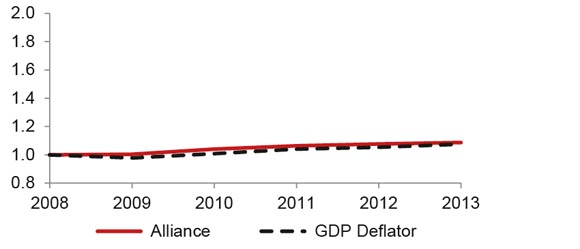
Figure A3.6 shows Alliance’s benchmark toll15 was nearly flat between 2008 and 2009, and it rose 4 percent in 2010, mainly due to higher depreciation and amortization charges, and operating and maintenance costs. In 2011 and 2012, the toll increased marginally by 2 percent and 1 percent respectively. In February 2013, the Board ruled that Alliance’s 2013 final tolls should not include $5 million of Demand Charge Credits related to Alliance’s Highway 43-42 Pipe relocation Project. The toll increased by 1 percent in 2013.
Figure A3.7 Foothills Benchmark Toll
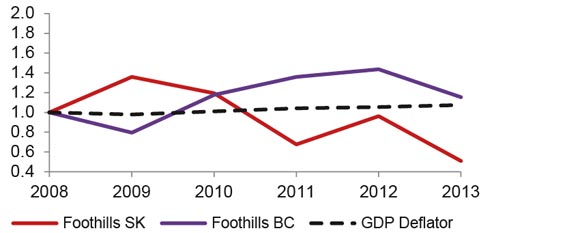
Figure A3.7 shows the Foothills B.C. (Zone 8) benchmark toll16 dropped in 2008 and 2009 as shippers benefitted from a bankruptcy settlement reached with a former shipper. In 2010, the toll rose due to there no longer being a benefit from the bankruptcy settlement. In 2011, the toll increased due to a 14 percent decline in firm volumes. Foothills’ settlement agreement (2003-2015) allowed for an incentive plan whereby Foothills earned its maximum $48.5 million share of general and administrative savings by mid-2011 and the plan was terminated. In 2012, the benchmark toll increased by about 6 percent on account of lower firm contract demand, partially offset by higher revenues from other services. In 2013, the toll declined by 20 percent on account of lower O&M expenses, prior year adjustments (over collections) and higher revenues from short-term and interruptible services.
Also shown in Figure A3.7, the Foothills Saskatchewan (Zone 9) benchmark toll17 varied from 2008 to 2013 with the toll in 2013 nearly 50 percent below the 2008 level. It increased 36 percent in 2009 due to a decline in firm contract demand (measured by distance volume), partly offset by increased use of the system by short term and interruptible service, coupled with the flow through of deferrals from 2008. In 2010, the toll decreased despite expectations for a further drop in firm contract demand because this was more than offset by other factors such as reduced O&M costs, higher revenues from other services, and lower flow through of deferrals. In 2011, the toll continued to decrease due to higher interruptible and short-term firm volumes combined with lower O&M expenses. However, in 2012, the benchmark toll increased by 42 percent, due to a large decline in firm contract demand. In 2013, there was a 47 percent decrease mainly due to previous year adjustments combined with slightly lower taxes and O&M expenses.
Figure A3.8 NGTL Benchmark Toll
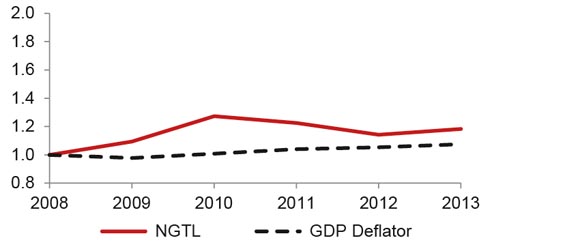
The Board assumed regulatory oversight of NGTL in 2009. Figure A3.8 shows the NGTL benchmark toll18 rose 9 percent in 2009 and 16 percent in 2010, mainly due to declining throughput and contract demand. In 2011, there was a reversal of the declining throughput trend on the NGTL system that had been continuing from 2006 until 2010. The toll declined by 4 percent in 2011 on account of higher transportation revenues combined with lower than forecast expenses. The benchmark toll decreased 7 percent in 2012 and increased by 4 percent in 2013.19
Figure A3.9 Westcoast Benchmark Toll
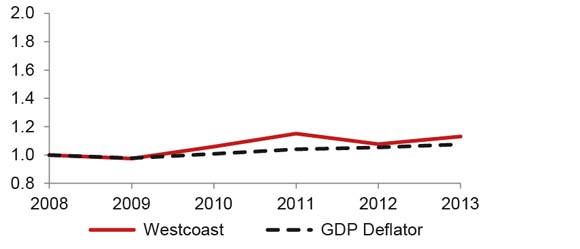
Figure A3.9 shows Westcoast’s benchmark toll20 declined in 2008 and 2009 but increased by nine percent in 2010, mainly due to higher O&M expenses and a lower contribution from prior-year deferral account balances. It increased by another nine percent in 2011 mainly on account of the higher revenue requirement for 2011 under Westcoast’s 2011-2013 settlement. The toll declined by seven percent in 2012, mainly due to a lower forecast rate base in 2012, an increase in the final 2012 allocation units and the higher than anticipated final balances in the revenue deferral accounts. The toll increased by five percent in 2013 on account of Westcoast’s reassessment of final 2013 tolls to recover a shortfall in interruptible toll revenue of approximately $10 million in Zone 4 as well the inclusion in the revenue requirement of the pipeline class upgrade expenditures for certain sections of the mainline in Zones 3 and 4.
Figure A3.10 M&NP Benchmark Toll

Figure A3.10 shows M&NP’s benchmark toll21 fell by 4 percent in 2009, due mainly to disposition of deferral account balances from the prior year, offset somewhat by a slight drop in expected volumes. The toll then rose 4 percent in 2010, due primarily to a further decrease in expected volumes which was partially offset by a decrease in the negotiated revenue requirement. The toll increased by 5 percent in 2011, mainly on account of a further reduction in demand determinants forecasted for 2011. The toll declined by 5 percent in 2012, on account of a lower revenue requirement from rebasing of capital as of January 2012 and the disposition of the 2010 and 2011 deferral account balances. The toll remained unchanged in 2013.
Figure A3.11 KM Cochin Benchmark Toll
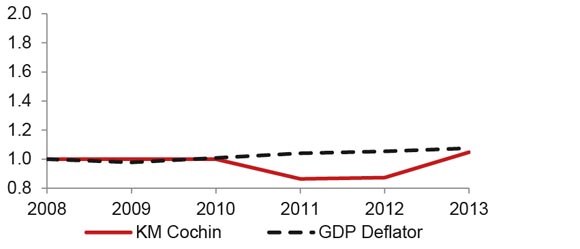
KM Cochin is the only Group 1 natural gas liquids pipeline regulated by the Board. Figure A3.11 shows the benchmark toll declined by about 12 percent in 2008 and remained flat for the following two years. It further decreased by 14 percent in 2011 on account of higher revenues from regular and incentive deliveries and tolls at Windsor. The toll increased marginally by 1 percent in 2012. It increased by 20 percent in 2013 on account of diminishing volumes of propane on the system.
[12] Enbridge did not publish this toll from 2012 onwards; a comparable toll comes from adding the Edmonton to International Boundary near Gretna, MB toll and the International Boundary near Sarnia, ON to International Boundary near Chippawa, ON. The Enbridge Toll does not include terminal and tankage fees.
[13] The benchmark toll for Express was the 15-year toll which stopped being offered as of 1 April 2012. The Express toll is charged in U.S. dollars, and was not converted to Canadian dollars.
[14] The RH-003-2011 decision eliminated the use of toll zones. Hence, the benchmark toll used for the second half of 2013 is the Empress to Union EDA toll of $1.65/GJ as this path was the closest to the benchmark (Eastern Zone) toll based on its load centre (distance from Empress). Averaging $2.24 and $1.65 results in an annual toll of $1.945 for 2013.
[15] FT service toll.
[16] FS-1 Firm Service toll.
[17] Zone 9 FT Demand Rate.
[18] Firm receipt toll plus delivery toll to Group 1 locations.
[19] 2013 interim rates are based on the original 2012 forecast revenue requirement of $1,401 million, before adjusting for the $90 million deferral that was applied in 2012, thus increasing the revenue requirement in 2013 by $90 million.
[20] Firm Transportation Service – Southern, 2-year contract delivered to Huntingdon Delivery Area.
[21] MN365 toll.
Appendix 4 – Settlements, Toll Proceedings and Complaints
Settlements
Figure A4.1 Negotiated Settlements Timeline
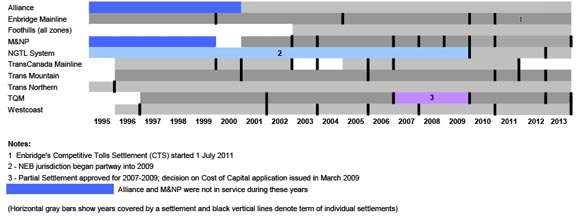
In 2002, the Board issued updated Guidelines for Negotiated Settlements, which was updated to provide flexibility to address contested settlements.
Figure A4.1 shows the negotiated settlement timelines for major NEB regulated pipeline systems, as further described below.
- In March 2010, Enbridge applied for a one-year (2010) toll settlement for services on its Canadian Mainline (though treatment of costs related to the Enbridge Alberta Clipper Pipeline project remained unresolved). That was followed by another one-year toll settlement for 2011. The 2011 toll settlement was cut short due to Enbridge’s May 2011 application for a new 10-year Competitive Toll Settlement for services on its Canadian Mainline from June 2011 to July 2021. The new settlement also resolved the outstanding issues related to 2010 tolls on the Enbridge Canadian Mainline, which had been the subject of a hearing in response to a complaint by Suncor Energy Marketing Inc. and Imperial. The new settlement went into effect 1 July 2011.
- TransCanada’s five-year (2007-2011) settlement expired at the end of 2011 and TransCanada and its shippers participated in the RH-003-2011 proceeding to set tolls for 2012 through 2017. TransCanada filed a contested toll settlement with the Board in late-2013.
- Trans Mountain operated under one-year toll settlements for each of 2011 and 2012. Currently, Trans Mountain operates under a three-year incentive toll settlement for the years 2013-2015.
- M&NP operated in 2010 under a partial settlement, followed by a three-year toll settlement for 2011-2013.
- TQM was under a three-year toll settlement for the years 2010-2012. In February 2013, the Board approved a one-year toll settlement for TQM for 2013.
- Westcoast has been operating under a three-year toll settlement for 2011 to 2013 for services on its mainline transmission system.
- NGTL, which came under NEB jurisdiction partway through 2009, applied for 2009 tolls based on a two-year revenue requirement settlement for 2008-2009 that had been approved by the Alberta Utilities Commission. NGTL was under a three year revenue requirement settlement for the years 2010-2012. In August 2013, the Board approved NGTL’s 2013-2014 revenue requirement settlement.
Toll Proceedings
Following are the toll proceedings that have come to the Board since 2008. Complaints, which often are related to tolls, are discussed in the next section.
Nova Gas Transmission Limited - Application for rate design methodology and integration with ATCO.
In November 2009, NGTL applied to the Board for approval of changes to its rate design and for commercial integration with ATCO Pipelines. The application was based on two agreements: the Rate Design and Services Review Settlement reached with NGTL’s Tolls, Tariff, Facilities and Procedures committee; and the Alberta System Integration Agreement between NGTL and ATCO Pipelines. NGTL implemented the revised rate design methodology on 1 November 2010 and the ATCO integration is being phased in over three years.
Enbridge Line 9 – Tolls & Tariff (RH-3-2008)
In 2008, Enbridge filed for approval of tolls and tariffs for service on Line 9. The Board denied Enbridge’s application finding that the Transportation Service Agreement negotiated by Enbridge and Imperial Oil Limited (Imperial) without the full participation of NOVA Chemicals, would have been highly beneficial to Imperial while being unduly discriminatory to NOVA Chemicals.
Enbridge Line 9 Application – Tolls & Tariff (RH-1-2010) – withdrawn
In December 2009, Enbridge filed an application seeking approval for final tolls and tariffs on Line 9 for 2008, 2009 and 2010. Among other things, Enbridge proposed to change the way it calculated depreciation expense, to increase the equity component of its deemed capital structure and to increase the return on equity. In October 2010, Enbridge withdrew the application as it reached an agreement with Imperial and NOVA Chemicals.
Maritimes & Northeast Pipeline Management Ltd. – Final Tolls for 2010 (RH-4-2010)
In July 2010, M&NP applied for approval of final tolls for 2010 which included, among other things, a $30 million surcharge for funds held in escrow in 2010. The Board considered whether the Applicant should be compensated for funds held in the escrow account in the 2010 revenue requirement. After considering the evidence, the Board determined the funds in the escrow account did not warrant additional compensation and denied the application.
Trans Mountain Pipeline ULC - Firm Service Application (RH-2-2011)
Trans Mountain asked the Board to approve Firm Service on the Trans Mountain pipeline system in relation to a segment of the capacity to the Westridge Dock. Trans Mountain also sought approval to collect and use the Firm Service Fee as a customer contribution, and approval of the associated reporting and investment of the Firm Service Fee. In addition, Trans Mountain requested that the Board approve certain Tariff amendments to implement Firm Service on the TMPL system. The Board concluded that Trans Mountain’s proposal related to the Firm Service Fee is in compliance with the NEB Act. The Board did not approve the Expansion Right and Step-up Right provisions included in the Transportation Service Agreement nor some of the Tariff amendments requested.
TransCanada Pipelines Ltd. – Business & Services Restructuring and Mainline Final Tolls for 2012 & 2013 (RH-003-2011)
This has been the lengthiest toll proceeding in recent years. In September 2011, TransCanada asked the Board to consider restructured pipeline services and tolling across its pipeline network, which includes the Trans Canada Mainline (Mainline), the NGTL System and the Foothills System. The Board was also asked to approve final Mainline tolls for 2012 and 2013. In its decision released in March 2013, the Board established the Firm Transportation toll from Empress, Alberta to Dawn, Ontario at $1.42/GJ. The Board expected this toll, among other things approved by the Board, to remain in effect through 2017. The Board also gave TransCanada broad discretion in setting prices for discretionary services such as interruptible transportation and short term firm transportation. The Board approved the Mainline’s return on equity at 11.5 percent on a 40 percent equity ratio as well as an incentive mechanism that would further increase the Mainline’s profits if annual net revenues are higher than forecast. In addition, the Board developed a streamlined regulatory process for the Mainline to address new service and pricing proposals in a timelier manner. In May 2013, TransCanada applied for a review and variance of the RH-003-2011 decision, which was subsequently dismissed by the Board.
Trans Mountain Pipeline ULC - Approval of Toll Methodology on a potential expanded Trans Mountain pipeline system (RH-001-2012)
Trans Mountain applied for approval of the transportation service and toll methodology for a potential expanded Trans Mountain System, if such an expansion were to be approved by the Board. The Board approved the toll methodology, finding, on balance, that it will produce tolls that will be just, reasonable and not unjustly discriminatory.
Chevron Canada Limited - Application for a Priority Destination Designation (MH-002-2012)
In June 2012, Chevron applied to the Board for an order designating Chevron’s refinery located at Burnaby, B.C. as a Priority Destination pursuant to its Petroleum Tariff. The Board found that Priority Destination is relief that should only be granted in extraordinary circumstances, and that the circumstances of Chevron’s Burnaby refinery did not warrant a Priority Destination designation. The Board also noted that the nomination and capacity allocation procedures in place at the time on TMPL were likely contributing to the level of apportionment and directed Trans Mountain to submit revised procedures, or an explanation for not doing so.
Abandonment Funding (MH-001-2012)
Table A4.1 Estimated Costs to Abandon Pipeline System
| Company | Estimated Cost in millions of dollars22 |
|---|---|
| Alliance | 255 |
| Enbridge | 994 |
| Enbridge (Norman Wells) | 30 |
| Foothills | 171 |
| TransCanada Keystone | 201 |
| Kinder Morgan Cochin | 24 |
| Maritimes and Northeast Pipeline23 | 151 |
| NGTL | 1,440 |
| TransCanada Mainline | 2,147 |
| TransQuébec and Maritimes | 94 |
| Trans Mountain | 340 |
| Trans-Northern | 77 |
| Westcoast G&P | 363 |
| Westcoast Transmission | 320 |
| Total Group 1 Pipelines | 6,605 |
| Total Group 2 Pipelines (approximate) | 570 |
| Total NEB Regulated Pipelines | 7,205 |
The Board continues to progress through its Five-Year Action Plan regarding funding for future pipeline abandonment costs. As part of the NEB’s Land Matters Consultation Initiative, the NEB addressed both physical and financial issues related to future abandonment. In May 2011, all of the Group 1 pipeline systems (generally the longer, more complex systems) filed summaries of the locations of the pipelines by pipe diameter and land-type.
Throughout 2012, the NEB examined the companies’ preliminary estimates of the costs to abandon their pipeline systems. In February 2013, the NEB released Decision MH-001-2012, giving some direction for revising estimates. The revised estimates are shown in Table A4.1.
Complaints
In addition to the complaint related to Clipper-related costs in the 2010 tolls on the Enbridge Canadian Mainline, the Board handled nine formal shipper complaints from 2009 to mid-2013.
Kinder Morgan Canada Company (Kinder Morgan)
In March 2009, Kinder Morgan filed an application related to the Windsor Sarnia Pipeline, owned by Dome NGL Pipeline Ltd. (Dome). Windsor-Sarnia Pipeline had been deactivated by an earlier Board Order. The application requested that the Board require Dome to, among other things, reactivate the Windsor-Sarnia Pipeline, and provide adequate and suitable facilities for receiving natural gas liquids onto the pipeline.
The Board held an oral hearing in January 2010. Nova Chemicals, an active participant in the hearing, expressed interest in direct transfer service from the Kinder Morgan Cochin line or other interconnections. In Decision MH-1-2009, the Board directed Dome to receive, transport and deliver natural gas liquids offered by NOVA Chemicals to Dome for transmission on the Windsor-Sarnia Pipeline, consistent with Dome’s common carrier obligation, and directed Dome to effect the reconnection of the Cochin Pipeline to the Windsor-Sarnia Pipeline when it is reactivated. The Board clarified Dome’s obligation as a common carrier, and determined there would be no undue burden on Dome to provide adequate and suitable facilities provided that NOVA Chemicals is prepared to commit to a facilities support agreement.
NGL Supply Co. Ltd.
In August 2009, NGL Supply Co. Ltd. filed a complaint regarding NEB Tariff 119 (Tariff 119), which was filed by Cochin in April 2008. Tariff 119 provided for an incentive toll to shippers subject to their commitment of shipping a minimum annual volume of propane. It submitted that the Tariff created an unfair situation and was so restrictive that only one shipper could meet the requirements of the Tariff. In March 2010, following a comment process, the Board found that the incentive toll contained within Tariff 119 was unjustly discriminatory, and accordingly disallowed it.
BP Canada Energy Company (BP Canada)
In June 2010, BP Canada filed a complaint with the Board related to Alliance’s allocation of certain receipt point capacity. Following a comment process, in August 2010 the Board found that Alliance did not violate any provision of its Tariff in the allocation of certain receipt point capacity, as alleged by BP Canada.
NOVA Chemicals (Canada) Corporation Limited (NOVA Chemicals)
In September 2010, NOVA Chemicals filed a complaint concerning Enbridge's interpretation of "acceptable" third party verification, found in its Canadian Mainline Tariff, for tenders submitted to Enbridge for the upcoming shipping month of October 2010. As a result of Enbridge’s interpretation of this rule, nominations for crude oil deliveries to NOVA Chemicals’ Sarnia facilities were reduced by 65 percent. NOVA requested that the Board overturn Enbridge’s decision to reject NOVA Chemicals’ Shipper Tender verification and direct Enbridge to: accept all October 2010 Shipper Tenders to NOVA Chemicals’ Sarnia facilities; and calculate apportionment for October using methods used in prior periods. Due to the urgent nature of the request, the Board held a one-day hearing and issued its decision on 30 September 2010. The Board was not persuaded that an order of the Board was warranted at that time and dismissed the complaint. However, the Board encouraged Enbridge to work with its stakeholders to develop further clarity and transparency in its tariff.
Imperial Oil Limited
On 31 May 2010, Enbridge Southern Lights GP Inc. submitted NEB Tariff 1 (governing rules and regulations) and NEB Tariff 2 (governing tolls) to the Board. On 10 September 2010, Imperial filed a complaint regarding the tolls paid by shippers who have not signed a long-term contract. The Board then established the RH-1-2011 public hearing to examine the tariffs. Taking into account all the evidence submitted during the hearing, the Board found that the tolls as per the tariff filings are just and reasonable and not unjustly discriminatory or an impediment to accessing service on the pipeline. The Board noted that it has an ongoing obligation to make sure that tolls are just and reasonable throughout the life of a pipeline. The Board also noted that it has a role to play in providing stakeholders with regulatory certainty with respect to toll design when such was the basis for the investment, and that regulatory certainty is an important factor in the Board’s decision-making processes. In February 2012, the Board approved NEB Tariff No. 1 and NEB Tariff No. 2 for service on the Southern Lights Pipeline, and accordingly denied the relief requested by Imperial.
Cenovus Energy Inc. (Cenovus)
In August 2010, Cenovus filed an application for Orders pursuant to subsection 71(3) of the NEB Act, requiring Express Pipeline Ltd. to provide pipeline facilities to transport oil from the Husky Terminal to the Express Terminal; pursuant to section 59 of the NEB Act, confirming that the costs of providing the pipeline facilities are to be borne by Express; pursuant to Part IV of the NEB Act, establishing a just and reasonable rate for the current service being provided by Express to Cenovus on the Express Pipeline; and pursuant to subsection 19(2) of the NEB Act, making the existing rate payable by Cenovus for service on the Express Pipeline interim. The Board decided to convene a written hearing with an oral final argument and issued Hearing Order MHW-1-2010.
In its letter decision issued in May 2011, the Board directed Express to provide service on the Husky Lateral to the current Husky Lateral shippers when service resumes. The Board concluded that Express is responsible for bearing the cost of replacing the Husky Lateral. The Board found that a just and reasonable rate for the Husky Lateral shippers from 14 October 2010 until service resumes on the Husky Lateral is the interim toll minus 24 cents/barrel. In June 2011, Express filed a Review and Variance of the Board’s decision in the MHW-1-2010 hearing. In April 2012, Express advised the Board that parties to the proceeding have reached an agreement regarding the amount payable to the Husky Lateral shippers relating to the period the Husky Lateral was out of service. Express subsequently filed for withdrawal of its Review and Variance application.
Murphy Oil Company Ltd. (Murphy)
In November 2010, Murphy filed a complaint and application, indicating that Westcoast had unjustly discriminated against Murphy by refusing service and capacity. Murphy also stated that Westcoast has violated several provisions of Westcoast’s NEB approved Framework for Light-Handed Regulation. Murphy asked the Board to direct Westcoast to provide firm gathering and processing services to Murphy on the South Peace Pipeline and at the McMahon Processing Plant at tolls that are just and reasonable and not unjustly discriminatory.
The Board established a written process, with oral argument, to consider Murphy’s application. The Board was not persuaded that Westcoast unjustly discriminated against Murphy since Murphy was requesting a service that Westcoast does not provide. The Board determined that Westcoast did not act improperly in denying service and capacity to Murphy and hence decided that Westcoast should not be directed to transport and process Murphy’s blended acid gas. Accordingly, the issue of deciding on an appropriate toll for such services was not addressed and the Board dismissed Murphy’s complaint and application.
Centra Transmission Holdings Inc. (Centra)
Centra filed its Proposed Tariff and 2012 Tolls in September and December 2011, respectively. Following each filing, the Board received letters of complaint from Resolute Forest Products Inc., Boise White Paper L.L.C. and Minnesota Energy Resources Corporation, collectively known as the Centra Shippers. The fourth shipper on Centra, Union Gas Ltd., did not submit a complaint. The Board made both filings interim while Centra and its shippers continued to negotiate.
On 26 April 2012, at the request of both Centra and its Shippers, the Board, pursuant to subsection 15(1) of the National Energy Board Act, authorized Board Member Georgette Habib to establish and conduct a process and to make recommendations to the Board on matters associated with Centra’s tolls and tariff. A written process, RHW-001-2013 was established and parties filed evidence, asked IRs and provided written final argument. The Letter Decision was released in May 2013 and included several Board decisions regarding the Cost of Service, Cost of Capital and other Tariff issues, based on the findings of the s.15 Member Habib’s Report.
[22] Not inflated to the likely future date of abandonment.
[23] Maritimes and Northeast Pipeline filed an estimate using the NEB’s Base Case and, as a result, did not require approval through MH-001-2012.
Appendix 5 – Financial Integrity
Common Equity
Table A5.1 Deemed Common Equity Ratios (percent)
| Gas Pipelines | 2008 | 2009 | 2010 | 2011 | 2012 |
|---|---|---|---|---|---|
| Alliance | 30 | 30 | 30 | 30 | 30 |
| Foothills | 36 | 36 | 40 | 40 | 40 |
| M&NP | 31.18 | * | * | * | * |
| NGTL | ** | * | 40 | 40 | 40 |
| TransCanada Mainline | 40 | 40 | 40 | 40 | 40 |
| Westcoast Transmission | 36 | 36 | 36 | 40 | 40 |
| Oil and Oil Product Pipelines | |||||
| Enbridge Pipelines (NW) | 55 | 55 | 50 | 50 | 50 |
| Enbridge Southern Lights | *** | *** | 30 | 30 | 30 |
| TransMountain Pipelines | 45 | 45 | 45 | 45 | 45 |
* Not specified.
** NGTL was regulated provincially
*** Enbridge Southern Lights came into service in 2010.
Table A5.1 shows the deemed common equity ratio for some NEB Group 1 pipeline companies from 2008 to 2012. The deemed common equity ratio for Foothills increased between 2009 and 2010, per an agreement with CAPP. M&NP's 2009 and 2010 deemed equity ratios were not specified in its toll settlements. The 2011–2013 settlement also did not specify this information.
Between 1996 and late 2009, the Board set an ROE annually, using a formula outlined in the Reasons for Decision for hearing RH-2-94. It was applicable to a number of regulated pipelines. In July 2009, the Board initiated a written process to review RH-2-94. In the Board’s October 2009 decision, the Board considered, among other things, the considerable changes in financial and economic circumstances since 1994 and the experience the industry gained in reaching negotiated settlements over the intervening 15 years; the Board decided that the RH-2-94 Decision would not continue to be in effect. However, for the convenience of parties, the Board has continued to publish the formula for calendar years until 2014.
Table A5.2 Achieved ROEs and the RH-2-94 Formula ROE
| 2008 | 2009 | 2010 | 2011 | 2012 | |
|---|---|---|---|---|---|
| Pipelines that were subject to RH-2-94 | |||||
| Foothills | 8.71 | 8.57 | 9.7 | 9.7 | 9.7 |
| TransCanada Mainline | 9.91 | 10.42 | 10.2 | 10 | 11.5 |
| Westcoast Transmission* | 8.76 | 9.08 | 8.78 | 10.01 | 9.36 |
| RH-2-94 Formula | 8.71 | 8.57 | 8.52 | 8.08 | 7.58 |
| Other Pipelines | |||||
| Alliance | 11.26 | 11.26 | 11.26 | 11.26 | 11.26 |
| M&NP | 11.35 | n/a | n/a | n/a | n/a |
| Alberta System ** | *** | 10.28 | 10.04 | 10.03 | 9.57 |
| Westcoast Field Services* | 7.61 | 12.25 | 13.65 | 16.98 | 19.25 |
* Excluded construction work in progress and, in the case of Transmission, deferrals.
**Alberta System was regulated provincially until early 2009; the 2009 ROE was calculated assuming a 35% equity ratio.
Source: NEB Surveillance Reports
Table A5.2 shows the achieved ROE for several NEB-regulated pipeline companies from 2008 to 2012 as well as the ROE approved by the NEB in accordance with the RH-2-94 Formula. Achieved ROEs from Enbridge, Keystone, Trans Mountain and Trans-Northern are not included in Table A5.2 as those companies are not required to submit Financial Surveillance Reports to the NEB, as per their negotiated settlements, or they have Board approval to report non-standard information. Note, that the ROEs in Table 4.2 may not be directly comparable due to differences in the companies’ common equity ratios.
Foothills, the TransCanada Mainline and Westcoast Transmission were subject to the RH-2-94 Formula prior to October 2009. In 2010, while their multi-year settlements continued, both the TransCanada Mainline and Westcoast Transmission continued to use the Formula result, while Foothills negotiated a new return. Alliance, M&NP, and NGTL, which are included in Table A5.2 but were not subject to the RH-2-94 Formula, have negotiated ROEs with their shippers. In the case of Alliance, the ROE was fixed for an extended period based on a long-term agreement reached prior to its construction. Westcoast's Field Services Division, also not subject to the ROE Formula, is financially regulated on a complaint basis as described in the Framework for Light-handed Regulation (RHW-1-98). Its tolls for gathering and processing services are negotiated individually with shippers. TQM is not included in the table below as in RH-1-2008, the Board set TQM’s Total Return on Capital for 2007 and 2008 without specifying the breakdown between debt and equity. TQM used the same total return in 2009. TQM’s 2010-2012 settlement did not specify the rate of return.
Figure A5.1 shows the distribution of the difference between achieved ROEs and NEB-approved ROEs between 2007 and 2012 for: Alliance, Foothills, M&NP, NGTL (2010 onwards), TransCanada Mainline and the Westcoast Transmission System, where available. From 2007 to 2012, these pipeline companies have met or exceeded their NEB-approved ROEs 92 percent of the time. In many cases, pipeline companies have met or outperformed their approved levels through cost reductions, incentives and profit sharing mechanisms.
Figure A5.1 Variance from NEB-Approved ROE - 2007 to 2012
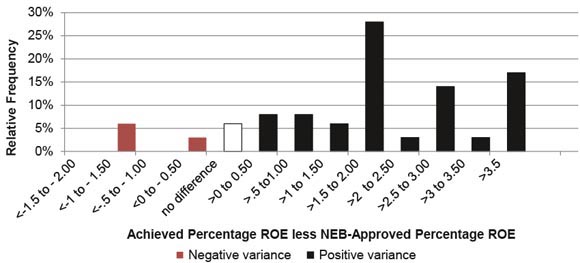
Source: NEB Surveillance Quarterly and Annual Reports. Note that Alliance earns precisely its allowed ROE, per its tolling arrangements.
Financial Ratios
Financial ratios can be used to examine a company's performance and financial integrity, based on information from its financial statements24. The evaluation of financial ratios is most meaningful when the ratio of a particular company is compared with a benchmark or industry standard over time.
Financial risk is the risk inherent in a company's use of debt and other obligations where fixed payments are used. It differs from business risk, which is the risk attributed to the nature of a particular business activity and, for pipelines, typically includes supply, market, regulatory, competitive and operating risks. Financial risk increases as the proportion of debt increases relative to shareholders equity. An increase in debt may obligate a company to make larger fixed payments in the future. From a bondholder's perspective, a company with above-average financial risk could have problems making interest payments. From an equity holder's perspective, a company's level of debt coverage gives some indication of the sustainability and value of the equity, and ability to pay dividends. A company's financial risk may be described by ratios such as interest coverage, fixed-charges coverage and cash flow-to-total debt and equivalents.
The following sections specifically outline and discuss certain ratios relating to the financial risk of some of the companies with NEB-regulated pipelines.
Interest and Fixed-Charges Coverage Ratios
An interest coverage ratio describes a company's ability to make interest payments and repay its debt obligations. It is defined as earnings before interest and taxes divided by interest charges. Similarly, a fixed-charges coverage ratio also describes the ability to make interest payments and repay debt obligations, and additionally considers some of the other types of fixed payments a company is obligated to make. It is defined as earnings before interest, fixed charges and taxes, divided by interest and fixed charges. Higher ratios indicate a higher likelihood the company will meet its obligations and may indicate greater borrowing capacity.
Figure A5.2 Fixed-Charges Coverage Ratios
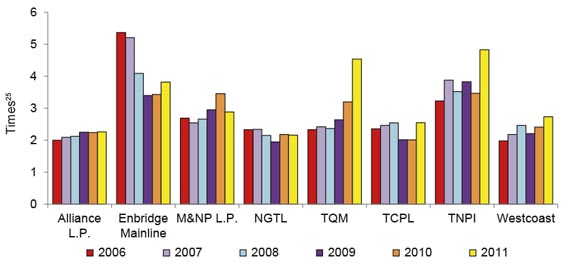
Source: DBRS
The fixed-charges coverage ratios for some NEB-regulated pipeline companies or pipeline systems, as calculated by DBRS, are shown in Figure A5.2. TransCanada Pipelines Ltd. is the parent company that owns Foothills, Keystone and the TransCanada Mainline, for which stand-alone data is not available. In 2012, the average interest and fixed-charges coverage ratio for these companies, where available26, was 3.15, slightly up from the 2011 full-year average ratio for these companies of 3.14. On a full-year basis, the average coverage ratio for all the companies or pipelines shown in Figure A5.2 was 3.22 in 2011, up from 2.82 in 2010, and 2.79 in 2006.
Cash Flow-to-Total Debt and Equivalents Ratio
The cash flow-to-total debt and equivalents ratio is another way of describing a company's ability to meet its debt obligations and fixed payments. It is defined as operating cash flow divided by total debt and debt equivalents.27 Again, higher ratios indicate an increased likelihood of a company being able to meet its obligations and indicate that it has greater borrowing capacity.
The cash flow-to-total debt and equivalents ratios for the same NEB-regulated pipeline companies or pipeline systems, as calculated by DBRS, are shown in Figure A5.3. The average cash flow-to-total debt and equivalents ratio for these companies, where available28, was 19.0 percent, slightly higher than the 2011 full-year average for these companies of 18.6 percent. On a full-year basis, the average ratio for all the companies or pipelines shown in Figure A5.3 was 18.7 percent in 2011, up from 17.1 percent in 2010 and 15.9 percent in 2006.
Figure A5.3 Cash Flow-to-Total Debt and Equivalent Ratios
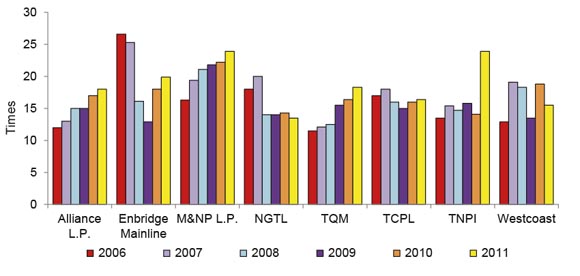
Source: DBRS
Credit Ratings
A company's credit rating generally reflects the consolidated operations of the entire company, not just the regulated portion. Consequently, the credit ratings for companies such as Enbridge, TransCanada and Westcoast, which have both regulated and non-regulated operations, may be influenced by their non-regulated operations.
Table A5.3 Investment Grade Credit Quality
| Credit Quality | DBRS | S&P | Moody's |
|---|---|---|---|
| Superior/High | AAA | AAA | Aaa |
| AA (high) | AA+ | Aa1 | |
| AA | AA | Aa2 | |
| AA (low) | AA- | Aa3 | |
| Good/Upper Medium | A (high) | A+ | A1 |
| A | A | A2 | |
| A (low) | A- | A3 | |
| Adequate/Medium | BBB (high) | BBB+ | Baa1 |
| BBB | BBB | Baa2 | |
| BBB (low) | BBB- | Baa3 |
Table A5.3 compares the rating scales used by DBRS, S&P, and Moody's when rating long-term debt. Because of differences between these agencies’ rating approaches and definitions, some subjectivity is required in comparing their rating scales.
Each agency also provides a rating outlook or trend, which assesses the potential direction of a credit rating. Common outlooks or trends are: 'Positive'; 'Negative'; and 'Stable'.
Since non-investment grade ratings do not apply to any of the regulated pipelines, they are not shown in the table.
Table A5.4 shows credit ratings provided by each rating agency for major pipeline companies from 2008 to 2013.
Table A5.4 Credit Ratings
| Pipeline | Agency | 2008 | 2009 | 2010 | 2011 | 2012 | Current |
|---|---|---|---|---|---|---|---|
| Alliance Pipeline Limited Partnership1 | DBRS | A(low) | A(low) | A(low) | A(low) | A(low) | A(low) |
| Moody’s | A3 | A3 | A3 | A3 | A3 | A3 | |
| Enbridge Inc. | DBRS | A (high) | A (high) | A (high) | A | A | A |
| S&P | A- | A- | A- | A- | A- | A- | |
| Moody’s | Baa1 | Baa1 | Baa1 | Baa1 | Baa1 | Baa1 | |
| Express L.P.1 | DBRS | A (low) | A (low) | A (low) | A (low) | A (low) | A (low) |
| Moody’s | Baa1 | Baa1 | Baa1 | Baa1* | Baa1 | Baa1 | |
| M&NP L.P.3 | DBRS | A | A | A | A | A | A |
| S&P | A | A | A | A | A | A | |
| Moody’s | A2 | A2 | A2 | A2 | A2 | A2 | |
| NGTL | DBRS | A | A | A | A | A | A (low ) |
| S&P | A- | A- | A- | A- | A- | A- | |
| Moody’s | A2 | A3 | A3 | A3 | A3 | A3 | |
| TQM | DBRS | A (low) | A (low) | A (low) | A (low) | A (low) | A (low) |
| S&P | BBB+ | BBB+ | BBB+ | BBB+ | BBB+ | BBB+ | |
| TCPL2 | DBRS | A | A | A | A | A | A (low) |
| S&P | A- | A- | A- | A- | A- | A- | |
| Moody’s | A3 | A3 | A3 | A3 | A3 | A3 | |
| TNPI | DBRS | A(low) | A(low) | A(low) | A(low) | A(low) | A (low) |
| Westcoast2 | DBRS | A (low) | A (low) | A (low) | A (low) | A (low) | A (low) |
| S&P | BBB+ | BBB+ | BBB+ | BBB+ | BBB+ | BBB |
1 Senior secured
2 Unsecured debentures
3. 6.9% Bonds due 2019
*Express L.P.’s credit rating was Baa1/Negative for part of the year.
Express is the General Partner of Express Pipeline Limited Partnership (Express L.P.)
DBRS
DBRS attempts to consider all meaningful factors that could impact the risk of maintaining timely payments of interest and principal in the future. For most industries, DBRS considers core profitability, asset quality, strategy and management strength, and the financial and business risk profile. For pipelines, DBRS also considers: regulatory factors, competitive environment, supply and demand considerations, and regulated versus non-regulated activities. Ratings have remained stable from 2007 to the present, varying from A(low) to A(high). In March 2011, DBRS downgraded Enbridge Pipelines to A from A(high), which followed the announcement by Enbridge of a 10-year Competitive Toll Settlement for its Canadian Mainline. In June 2013, TCPL’s unsecured debentures as well as NGTL’s medium-term notes and unsecured debentures rating were downgraded to A(low) from “A”. The rating actions followed DBRS’s review of the Board’s dismissal of TransCanada’s application for review and variance of the RH-003-2011 decision.
Standard & Poor's
S&P‘s credit rating reflects a borrower's capacity and willingness to meet its financial commitments on a timely basis. S&P bases its ratings on the overall creditworthiness of a consolidated company. Therefore, the rating of a wholly-owned subsidiary, in the absence of meaningful ring-fencing measures, generally reflects the creditworthiness of the parent. Ratings have been stable from 2007 to the present, and currently vary from 'BBB+' to 'A'. In March 2011, S&P downgraded the outlook on Enbridge Pipelines Inc.’s ‘A-‘ rating to negative from stable, following Enbridge’s announcement of its 10-year Competitive Toll Settlement. In December 2011, the rating was revised back to ‘A-‘ stable, reflecting S&P’s view of the lower probability of credit metrics dropping below the 13% funds from operations-to-debt floor associated with the rating as Enbridge proceeds with its capital program. In November 2013, S&P downgraded Westcoast to BBB from BBB+. The downgrade follows the same action taken to the ratings of parent Spectra Energy Corp. reflecting the drop-down of the company’s U.S. gas transmission, storage and liquid assets to Spectra Energy Partners L.P. S&P equalized the ratings of Westcoast with those of Spectra based on their methodology for a holding-company structure.
Moody's
Like S&P, Moody's focuses its ratings on the overall creditworthiness of the consolidated entity. Moody's credit analysis focuses on the fundamental factors and key business drivers relevant to an issuer's long-term and short-term risk profile. The foundation of Moody's methodology rests on the risk to the debt holder of not receiving timely payment of principal and interest on the specific debt security; and a comparison of the level of risk with that of all other debt securities. Moody's ratings have been stable and are all investment grade. In June 2010, Moody’s changed the outlook for Express to negative from stable reflecting increased concern with respect to Express’s re-contracting risk in the 2012-2015 period. In 2012, the outlook was revised to stable from negative. The outlook change reflected
Moody’s review of the pipeline’s consistent financial performance and strengthening financial ratios that substantially offset the ongoing business and volume risk associated with expiring capacity contracts.
[24] A variety of ratios can be used to evaluate a company's liquidity, operating performance, growth potential, and risk. Care must be exercised in the interpretation of these financial ratios as reported financial information may pertain to a parent company and include non-regulated assets and/or assets from different industries.
[25] An annual cash flow item relative to another annual cash flow item is typically expressed as a factor of 'Times'.
[26] For 2012, information was not available for the Enbridge Mainline and only partial year (first 6 months) information was available for M&NP L.P.; TNPI’s results are unaudited.
[27] The annual cash flow over a balance sheet item is typically converted to a percentage.
[28] For 2012, information was not available for the Enbridge Mainline and only partial year (first 6 months) information was available for M&NP L.P.; TNPI’s results are unaudited.
Appendix 6 - Group 1 and Group 2 Pipeline Companies
Regulated companies as of 31 December 2013
Group 1 Oil and Products
Enbridge Pipelines (NW) Inc.
Enbridge Pipelines Inc.
Kinder Morgan Cochin ULC
Trans Mountain Pipeline ULC
TransCanada Keystone Pipeline GP Ltd.
Trans-Northern Pipelines Inc.
Group 1 Natural Gas
Alliance Pipeline Ltd. on behalf of the Alliance Pipeline Ltd. Partnership
Foothills Pipe Lines Ltd.
Maritimes & Northeast Pipeline Management Ltd.
NOVA Gas Transmission Ltd.
Trans Québec and Maritimes Pipeline Inc.
TransCanada Pipelines Limited
Westcoast Energy Inc., carrying on business as Spectra Energy Transmission
Group 2 Oil and Products
1057533 Alberta Ltd.
Aurora Pipe Line Company Ltd.
Bonavista Energy Corp.
Emera Brunswick Pipeline Company Ltd.
Enbridge Bakken Pipeline Company Inc.
Enbridge Pipelines (Westspur) Inc.
Enbridge Southern Lights GP Inc. on behalf of Enbridge Southern Lights LP (Oil & Diluent)
Express Pipeline Ltd.
Glencoe Resources Ltd.
Husky Oil Operations Limited
Imperial Oil resources Ventures Limited (Oil/Emulsion)
ISH Energy Ltd.
Montréal Pipe Line Limited
Penn West Petroleum Ltd. (Oil Emulsion)
Plains Midstream Canada ULC
Pouce Coupé Pipe Line Ltd.
Ruger Energy Inc (Oil Emulsion)
Sunoco Logistics Partners Operations GP LLC on behalf of Sunoco Pipeline LP
Tundra Oil & Gas Limited for and on behalf of Tundra Oil & Gas Partnership (Oil Well Effluent)
Group 2 Natural Gas Liquids
Dome Kerrobert Pipeline Ltd.
Dome NGL Pipeline Ltd.
Genesis Pipeline (Canada) Ltd.
Spectra Energy Empress Management Inc.
Shell Canada Limited (SCL) Pipeline Inc. (NGL-HVP)
TAQA North Ltd.
Vantage Pipeline Canada Inc (under construction)
Group 2 Natural Gas
2193914 Canada Limited
6720471 Canada Ltd.
AltaGas Holdings Inc. for and on behalf of AltaGas Pipeline Partnership
Apache Canada Ltd.
ARC Resources Ltd.
Bellatrix Exploration Ltd.
Bonavista Energy Corp.
Burlington Resources Canada (Hunter) Ltd.
Canada Border Services Agency
Canadian Natural Resources Limited
Canadian-Montana Pipe Line Company
Centra Transmission Holdings Inc.
Champion Pipe Line Corporation Limited
Chief Mountain Gas Co-op Ltd.
County of Vermilion River No. 24 Gas Utility
Crescent Point Energy Corp
Delphi Energy Corporation
Devon Energy Corporation
Dome Kerrobert Pipeline Ltd.
Dome Petroleum Limited
Echoex Energy Inc.
EnCana Corporation
ExxonMobil Canada Properties
Husky Oil Operations Limited
Kaiser Exploration Ltd. (one line Natural Gas, Oil Effluent – Solution Gas)
KEYERA Energy Ltd.
Lone Pine Resources Canada Limited
Many Islands Pipe Lines (Canada) Limited
Mid-Continent Pipelines Limited
Minell Pipeline Limited
Murphy Oil Company Ltd.
Niagara Gas Transmission Limited
Northern Blizzard Resources Inc.
NOVA Chemicals (Canada) Ltd.
NuVista Energy Ltd.
OmimEx Canada, Ltd.
ONEOK Rockies Processing Company (Canada) Ltd.
Paramount Transmission Ltd.
Pengrowth Corporation
Penn West Petroleum Ltd.
Portal Municipal Gas Company Canada Inc.
Revenue Canada, Customs and Excise
Seaview Energy Inc.
Shiha Energy Transmission Ltd.
Spectra Energy Midstream Canada Partner Corporation
Spur Border Pipelines Limited
St. Clair Pipelines Management Inc.
Talisman Energy Inc.
TAQA North Ltd.
Terra Energy Corp.
Union Gas Limited
Vector Pipeline Limited Partnership
Veresen Inc.
Yoho Resources Inc.
Group 2 Other Commodity
Abitibi-Consolidated Company of Canada
BlackPearl Resources Inc.
Canadian Natural Resources
Domtar Inc.
Fortis B.C. Huntington Inc.
Husky Oil Operations Limited
Spectra Energy Empress Management
Souris Valley Pipeline Limited
Twin Rivers Paper Company Inc.
1057533 Alberta Ltd
- Date modified: