ARCHIVED - Canadian Energy Pricing Trends 2000-2010 - Energy Facts
This page has been archived on the Web
Information identified as archived is provided for reference, research or recordkeeping purposes. It is not subject to the Government of Canada Web Standards and has not been altered or updated since it was archived. Please contact us to request a format other than those available.
ISSN 1925-2706
Canadian Energy Pricing Trends 2000-2010 - Energy Facts [PDF 2904 KB]

October 2011
The National Energy Board has as part of its mandate, the responsibility to monitor energy markets. Under this mandate, the Board issues reports on energy matters to inform Canadians.
Canadian end-use energy prices have generally risen over the last decade and become more volatile. This Energy Fact will explore pricing trends over the past decade for crude oil, gasoline, furnace oil, natural gas, and electricity.
Short-term analyses of these commodities can also be found on the Board’s website under Energy Pricing Information for Canadian Consumers at Energy Pricing Information for Canadian Consumers.
Crude oil, Gasoline and Furnace Oil
Crude Oil
Canada is a participant in the global oil market in which buyers and sellers trade volumes, mostly based on short-term contracts. This interaction sets the world price of oil. Although Canada is the sixth largest producer in the world, it produces only about four per cent of total daily production, so it has little influence on the world price of oil. As a result, Canada is a price taker, rather than a price setter. The price of crude oil is most commonly quoted in $US per barrel.
Figure 1: WTI Prices
Figure 1 shows crude oil prices over the 2000 to 2010 period for the West Texas Intermediate (WTI) benchmark.
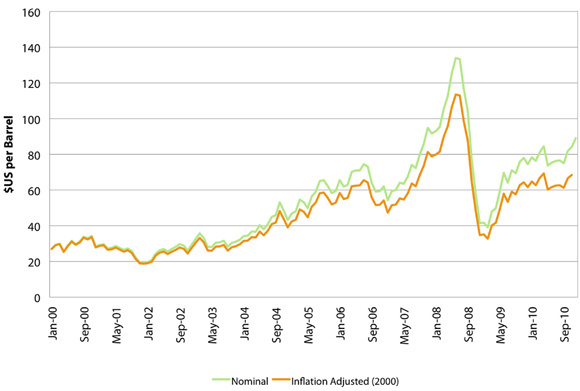
A brief overview of price developments over the 2000-2010 timeframe follows:
- 2000-2003: During this period, WTI prices were stable, generally trading in the area of $30 per barrel. Contributing factors included ample OPEC spare producing capacity and weak economic growth and oil demand following the events of September 11, 2001.
- 2004-2006: Prices began to rise, due in large part to increasing demand from China and other emerging economies. Spurred by attractive returns, financial investment in oil also began to increase. Prices increased in 29 of the 40 months between September 2003 and December 2006.
- 2007-2008: This period was characterized by extreme price volatility. Major contributing factors included ongoing significant growth in financial investment in oil; a falling U.S. dollar; growing demand from emerging economies; geopolitical instability; rising finding and development costs; and, slow non-OPEC production growth.
- 2008-2010: The global recession was characterized by broad-based wealth destruction with the collapse of the U.S. housing market, the failure of a number of major financial institutions and the decline in stock markets. Commodity markets also fell. Oil demand was heavily impacted and WTI prices dropped from a high of over US$145 in July 2008, to below US$40 per barrel by year-end. Through 2009 and 2010, oil prices began to increase with an improving global economy and reduced OPEC supply.
Petroleum Products
Petroleum Products Petroleum product pricing is primarily determined by crude oil pricing. The downstream petroleum sector is complex and highly competitive. Each petroleum product in each regional market reacts to a different set of supply/demand and transportation pressures and prices are set by both international and local market factors. As the physical distance from refinery to consumer point-of-sale increases, prices can be expected to be higher because of transportation costs. In addition, in rural areas where fewer retailers exist and competition is somewhat less intensive, prices would also tend to be higher than in larger centres. Differences in taxation are also a factor in regional price differences.
Figure 2: Regular Gasoline At Retail
Figure 2 shows the average Canadian price of regular unleaded gasoline in Canada over the 2000 to 2010 period. Gasoline prices have closely tracked crude oil prices and were higher and more volatile in the second half of the decade (Figure 1)
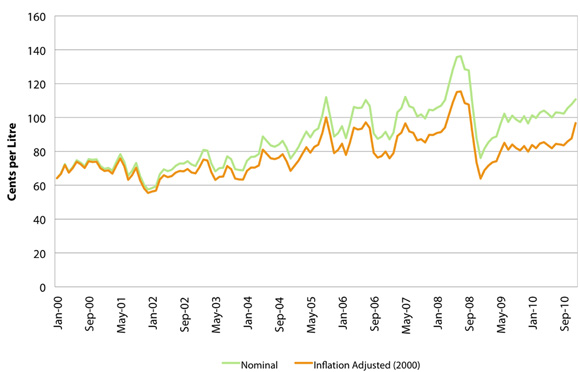
| Average Price 2000-2010 (inflation adjusted, 2000) | $0.78/l |
| Average Price 2000-2010 (nominal) | $0.88/l |
| Minimum Monthly Price (nominal) | $0.57/l |
| Maximum Monthly Price (nominal) | $1.36/l |
Source: MJ Ervin and Associates
Five provinces, Newfoundland and Labrador, Prince Edward Island, Nova Scotia, New Brunswick and Quebec, currently regulate gasoline prices. Consumers in those provinces see fewer changes in prices but they are not paying less for gasoline on average than other Canadians.
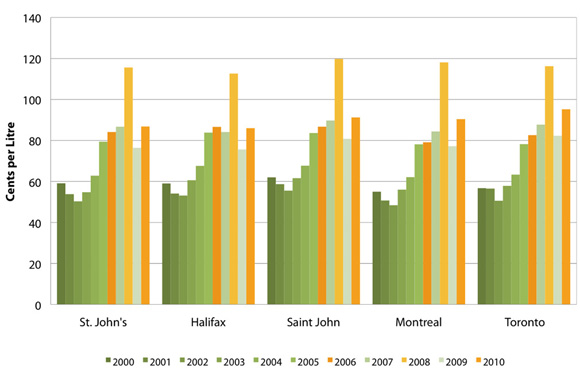
Figure 3: Regular Gasoline at Retail (nominal)
Figure 3 shows retail prices for regular unleaded gasoline for selected major Canadian cities. Of these cities, prices were on average highest in Halifax, and lowest in Calgary.
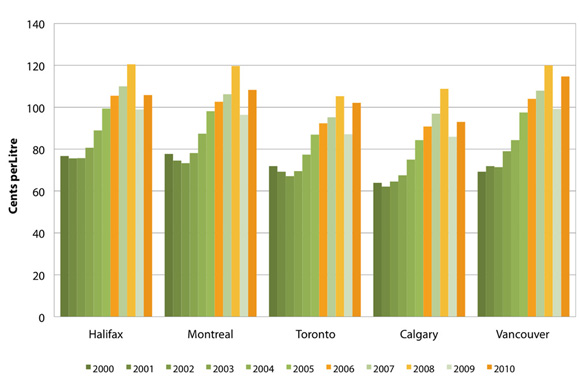
| Highest Average Price 2000-2010 | $0.94/l Halifax |
| Lowest Average Price 2000-2010 | $0.81/l Calgary |
| Lowest Annual Price | $0.62/l Calgary, 2001 |
| Highest Annual Price | $1.20/l Halifax, Vancouver, 2008 |
Source: MJ Ervin and Associates
For more information on gasoline pricing in Canada, please see Gasoline Pricing - Energy Facts at Gasoline Pricing - Energy Facts.
Furnace oil, also known as heating oil, is used in about 10 per cent of homes in Canada. Sales of furnace oil are concentrated in eastern Canada with Ontario, Quebec and Atlantic Canada accounting for about 95 per cent of total sales. Although Ontario and Quebec account for about two-thirds of Canadian demand, the Atlantic region is the most reliant on furnace oil for space heating.
Figure 4: Furnace Oil at Retail
Figure 4 shows average Canadian furnace oil prices from 2000 to 2010. Like gasoline, furnace oil prices tracked the crude oil market and prices were higher and more volatile over the second half of the decade.
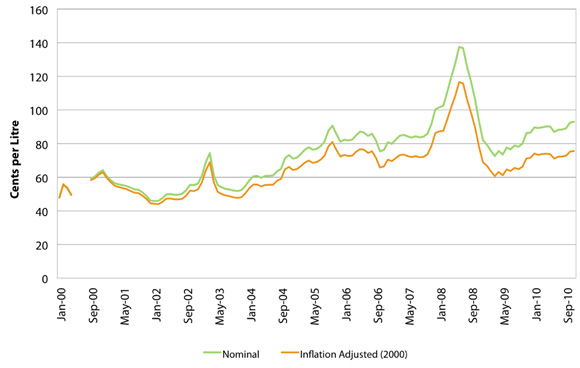
| Average Price 2000-2010 (Inflation Adjusted, 2000) |
$0.68/l |
| Average Price 2000-2010 (nominal) | $0.74/l |
| Minimum Monthly Price (nominal) | $0.45/l |
| Maximum Monthly Price (nominal) | $1.38/l |
Source: MJ Ervin and Associates
Figure 5: Furnace Oil at Retail (nominal)
Figure 5 shows prices for furnace oil at retail for select major Canadian consuming cities. Of these cities, prices were on average highest in Saint John, and lowest in Montreal.
| Highest Average Price 2000-2010 | $0.78/l Saint John |
| Lowest Average Price 2000-2010 | $0.73/l Montreal |
| Lowest Annual Price | $0.48/l Montreal 2002 |
| Highest Annual Price | $1.20/l Saint John 2008 |
Source: MJ Ervin and Associates
Summary
- Canada is a participant in the global market for crude oil. Over the past decade, the world oil market has become more volatile and prices have increased due mainly to higher costs of production, and increasing demand particularly from emerging economies.
- Crude oil input costs are the chief determinant of petroleum product prices. Over the past decade, higher and more volatile oil prices have resulted in Canadians facing higher prices for gasoline and furnace oil across the country, both on a nominal and inflation adjusted basis.
Natural Gas
Natural gas markets in Canada and the United States operate as single integrated market. Events relating to weather, storage, transportation or infrastructure, however, have a direct impact on markets in many regions of North America.
The price of North American natural gas consists of three components: the cost of the natural gas (known as the commodity cost), the pipeline transportation cost and the distribution cost. The North American price of natural gas tended to move with the price of oil up until 2008. However, since then, neither global trade nor the price of oil has been a major factor in determining North American natural gas prices. Although North America imports liquefied natural gas, it represents less than two percent of total supply and so does not greatly influence natural gas prices.
The price of North American natural gas consists of three components: the cost of the natural gas (known as the commodity cost), the pipeline transportation cost and the distribution cost. The North American price of natural gas tended to move with the price of oil up until 2008. However, since then, neither global trade nor the price of oil has been a major factor in determining North American natural gas prices. Although North America imports liquefied natural gas, it represents less than two percent of total supply and so does not greatly influence natural gas prices.
Figure 6: Henry Hub / AECO-C Monthly Price 2000-2010
Figure 6 shows natural gas prices over the past 10 years have fluctuated mainly in response to economic and weather factors. Changes in price occurred in response to supply issues (shutins of natural gas wells, drilling) and seasonal pressures (cold weather, hurricanes, storage withdrawal and injections).
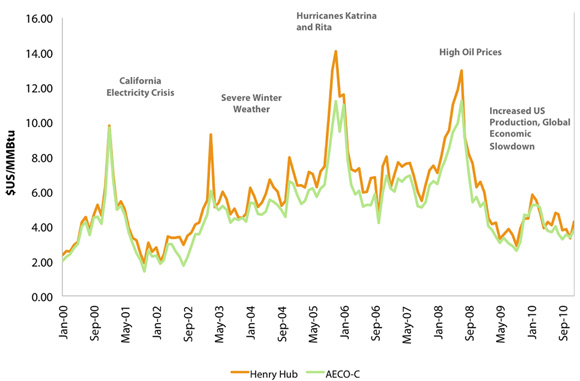
Source: GLJ Petroleum Consultants
The following section provides a brief overview of natural gas prices over the 2000-2010 timeframe.
- 2000-2001: During this period, the first price spike occurred because of the California Energy Crisis. A shortage of electricity and natural gas pipeline shutdowns were responsible for the increase in gas prices.
- 2002-2004: Natural gas prices increased slightly year-over-year, but did not reach the levels seen in 2001. Prices did spike for a short period near the end of 2004 as cold weather swept across the continent.
- 2005: Hurricanes and volatile weather were responsible for price spikes. Hurricanes Katrina and Rita damaged offshore natural gas rigs in the Gulf of Mexico causing prices to exceed $14/MMBtu.
- 2006-2008: This period was characterized by extreme volatility. Prices declined in 2006 and mild temperatures and increased drilling contributed to relative price stability through mid-2008. The second half of 2008, however, saw prices increase along with the price of crude oil.
- 2008-2010: Increased shale gas production in the United States combined with the global recession kept natural gas prices below mid-decade levels through to the end of 2010.
Prices of natural gas to the end consumer in Canada have moved in response to fluctuations in the commodity cost. Figure 7 shows the average Canadian prices of natural gas to residential consumers, including taxes. As commodity costs fell in 2010, so did gas costs to end-use consumers in Canada.
Figure 7: Canadian Annual Average Natural Gas Cost
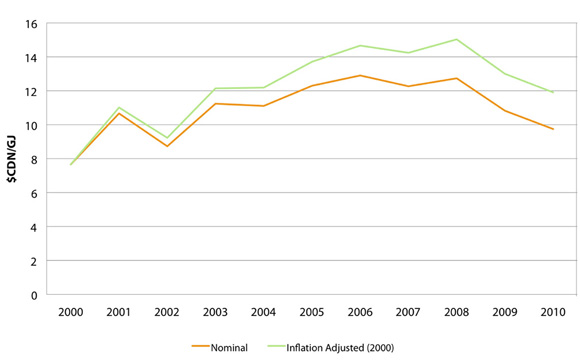
Source: Statistics Canada
Figure 8: Residential Total Natural Gas Cost
Figure 8 shows the annual average total cost of natural gas for six Canadian cities. Figures include fixed costs (costs charged to customers regardless of gas consumption, which include transportation and distribution costs) as well as GST and provincial taxes. Over the past 10 years, total costs for natural gas have fluctuated mainly due to changes in the commodity cost. In general, cities closest to natural gas supply see lower prices. Since 2000, Calgary has had the lowest total cost for natural gas while Halifax has had the highest total cost. Overall, costs for natural gas for residential customers fell in 2010.
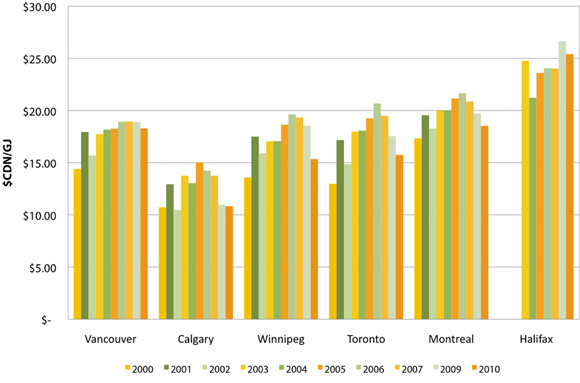
| Highest Average Price 2000-2010 | $21.23/GJ Halifax |
| Lowest Average Price 2000-2010 | $11.42/GJ Calgary |
| Highest Annual Price 2000-2010 | $22.92/ GJ Halifax 2003 |
| Lowest Annual Price 2000-2010 | $8.87/GJ Calgary 2010 |
Source: (Statistics Canada, Terasen Gas, ATCO, Centra Gas Manitoba Inc., Enbridge Inc., Gaz Métro, Heritage Gas)
Total prices for natural gas in eastern Canada remain higher than western Canada, as markets in Ontario and Quebec rely on gas coming from the Western Canadian Sedimentary Basin (WCSB) and therefore transportation costs are higher. Markets in Atlantic Canada are able to access natural gas from the Sable offshore project; however, these markets are smaller and less mature therefore distribution costs are higher. Over the ten-year period, for consumers in Vancouver and Calgary, close to 60 per cent of their total bill was comprised of transportation and distribution, while consumers in Toronto and Halifax paid close to 70 per cent.
Summary
- The Canadian natural gas market operates in the context of the greater North American market. Over the past 10 years, natural gas prices have fluctuated based on seasonal effects and supply constraints. The significant emergence of shale gas production beginning 2008 has resulted in the commodity cost of natural gas declining to 2003 levels.
- Prices for natural gas including transportation and delivery vary across the country, in general with mature markets closest to natural gas supplies seeing the lowest end-use costs. Of the selected major cities reviewed for the period, end-use prices were lowest in Calgary and highest in Halifax.
Electricity
While oil markets are global and natural gas markets are generally continental, electricity markets are regional. Electricity prices vary by province or territory, primarily according to the type of available generation and the market structure (i.e. market-based or cost-of-service regulation). In general, the provinces that have large amounts of hydroelectric power have lower costs and have had less incentive to restructure their markets.
At the consumer level, electricity is typically priced per kilowatt-hour (kW.h) of consumption, with various service charges (mostly to cover the cost of transmission and distribution) added as fixed charges. Prices in most provinces and territories are set by the electricity regulator to cover costs and allow for a reasonable rate of return to investors. Ontario has chosen to partially restructure its electricity market, allowing market forces to determine a portion of the generation costs. Alberta, being a province largely dependent on thermal generation, has moved the furthest in restructuring its electricity market.
Consumer prices for electricity are mainly made up of the costs of electricity generation, transmission and distribution. In Alberta and Ontario, the cost of generation is determined in the wholesale markets, with Ontario administering a "Global Adjustment" to account for the regulated and contracted generation in the province. This Global Adjustment has risen in recent years as the wholesale market price has dropped below the average contracted price, and the amount of contracted generation is increasing. Figure 9 shows prices in the Alberta and Ontario wholesale markets and key influencing factors from 2000 to 2010. The Ontario market tends to be less volatile than Alberta due to greater market size, more interconnections with other markets, and more regulated or contracted generation.
As of July 2010, the regulated residential rates in Alberta are entirely based on the electricity providers’ month-ahead costs. If the overall price level expectation for the next month changes, the prices that residents (who have not signed a retail contract) pay will change accordingly. Similarly, in Ontario, the regulated residential rates are determined twice each year by the Ontario Energy Board, and are set to reflect future cost expectations for all generation in the province. Ontario’s "regulated price plan" differs from Alberta’s "regulated rate option", in that it is set less often and has one price for the province, whereas Alberta sets a different price for each provider.
Figure 9: Residential Total Natural Gas Cost
Monthly Wholesale Power Prices in cents per kilowatt hour
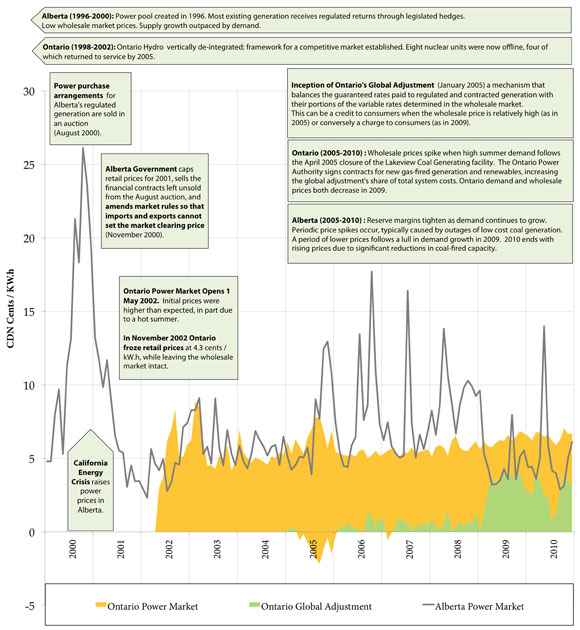
Figure 9 - Legend
Alberta (1996-2000): Power pool created in 1996. Most existing generation receives regulated returns through legislated hedges. Low wholesale market prices. Supply growth outpaced by demand.
Ontario (1998-2002): Ontario Hydro vertically de-integrated; framework for a competitive market established. Eight nuclear units were now offline, four of which returned to service by 2005.
Power purchase arrangements for Alberta's regulated generation are sold in an auction (August 2000).
Alberta Government caps retail prices for 2001, sells the financial contracts left unsold from the August auction, and amends market rules so that imports and exports cannot set the market clearing price (November 2000).
California Energy Crisis raises power prices in Alberta (2000-2001).
Ontario Power Market Opens 1 May 2002. Initial prices were higher than expected, in part due to a hot summer.
In November 2002 Ontario froze retail prices at 4.3 cents/kW.h, while leaving the wholesale market intact.
Inception of Ontario's Global Adjustment (January 2005) a mechanism that balances the guaranteed rates paid to regulated and contracted generation with their portions of the variable rates determined in the wholesale market.
This can be a credit to consumers when the wholesale price is relatively high (as in 2005) or conversely a charge to consumers (as in 2009).
Ontario (2005-2010): Wholesale prices spike when high summer demand follows the April 2005 closure of the Lakeview Coal Generating facility. The Ontario Power Authority signs contracts for new gas-fired generation and renewables, increasing the global adjustment's share of total system costs. Ontario demand and wholesale prices both decrease in 2009.
Alberta (2005-2010): Reserve margins tighten as demand continues to grow. Periodic price spikes occur, typically caused by outages of low cost coal generation. A period of lower prices follows a lull in demand growth in 2009. 2010 ends with rising prices due to significant reductions in coal-fired capacity.
Sources: Alberta Electric System Operator; the Independent Electric System Operator of Ontario
Large consumers (i.e., industrial and commercial) are typically provided power at lower rates than residential consumers. However, in Alberta and Ontario large consumers buy directly from the wholesale market, and are thus subject to more price volatility than small consumers. These large consumers tend to pay the real-time cost of generation, and thus have more incentive to consume power only when it is economical, such as in off-peak periods. The commodity costs in other provinces are based on cost-of-service regulation of their utilities, and the price level is largely dependent on the types of generation available. For example, Quebec, British Columbia and Manitoba have systems dominated by hydro-electric generation, which for the most part produce relatively low-cost power. Other jurisdictions, such as the Atlantic provinces, have more diversified systems that are affected by changes in fossil fuel costs. The Atlantic provinces have implemented 'fuel-adjustment mechanisms' that allow the regulated utilities to pass-through fuel costs on a regular basis.
While prices have tended to increase in nominal terms across the country, inflation-adjusted residential costs have decreased in Manitoba and Quebec. Ontario has seen the most cost increases due to increased fuel costs, a commitment to use cleaner energy sources, and the need to reinforce its transmission system. Figure 10 shows residential consumer costs for selected cities.
Figure 10: Electricity Costs for Residential Consumers

Sources: Hydro Québec; Statistics Canada; National Energy Board
Summary
- Electricity prices vary by province or territory, primarily according to the type of available generation and the market structure (i.e., market-based or cost-of-service regulation). Ontario and Alberta have restructured their electricity markets to a greater extent than the other provinces and territories.
- On average, Canadian residential electricity prices have increased somewhat over the review period. Price increases are less when adjusted for inflation and prices have declined in some provinces. The regions that have seen more substantial price increases include Alberta, Ontario and the Maritimes.
- Date modified: