ARCHIVED – Canada’s Renewable Power Landscape 2017 – Energy Market Analysis
This page has been archived on the Web
Information identified as archived is provided for reference, research or recordkeeping purposes. It is not subject to the Government of Canada Web Standards and has not been altered or updated since it was archived. Please contact us to request a format other than those available.

Ontario
In 2016, Ontario generated 33.4% of its electricity from renewable sources and generated 91.7% of its electricity from sources that are non-emitting during operation. Oil and diesel were 0.1% of Ontario’s generation in 2016. Natural gas was the only significant fossil fuel source of electricity, accounting for 8.2% of the electricity generated in 2016.
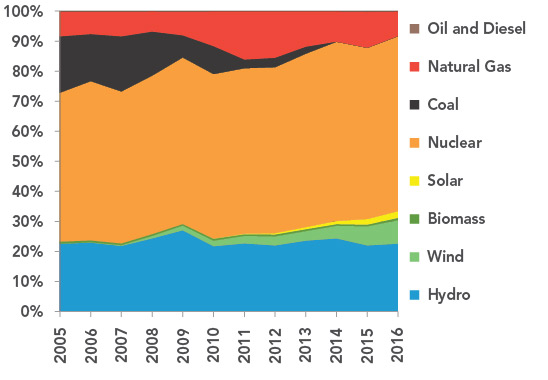
FIGURE 15 Electricity Generation by Source in Ontario
Description
This graph shows the composition of Ontario’s electricity generation between 2005 and 2016. On average, hydro accounted for 23.1% of generation. Wind’s share grew from zero to 7.8%, solar from zero to 2.3%, and biomass remained at 0.7%. Nuclear grew from 49.6% to 58.3% of generation. Coal decreased from 18.7% in 2005 to 0% in 2014. Natural gas peaked at 16.1% in 2011 before falling to 8.2% in 2016.
TABLE 6 Electric Capacity and Generation in Ontario
| Capacity in MW and % | Generation in GW.h and % | |||||
|---|---|---|---|---|---|---|
| 2005 | 2015 | 2016 | 2005 | 2015 | 2016 | |
| Oil and Diesel | 116 | 250 | 250 | 184 | 237 | 109 |
| 0.4% | 0.6% | 0.6% | 0.1% | 0.1% | 0.1% | |
| Natural Gas | 4 789 | 9 648 | 9 630 | 13 082 | 19 403 | 12 859 |
| 15.2% | 24.5% | 23.9% | 8.3% | 12.1% | 8.2% | |
| Coal | 6 437 | 0 | 0 | 29 431 | 0 | 0 |
| 20.4% | 0.0% | 0.0% | 18.7% | 0.0% | 0.0% | |
| Nuclear | 11 450 | 13 568 | 13 568 | 77 969 | 91 405 | 90 873 |
| 36.3% | 34.5% | 33.7% | 49.6% | 57.0% | 58.3% | |
| Solar | 17 | 2 119 | 2 291 | 0 | 3 001 | 3 566 |
| 0.1% | 5.4% | 5.7% | 0.0% | 1.9% | 2.3% | |
| Biomass | 209 | 574 | 762 | 1 108 | 818 | 1 128 |
| 0.7% | 1.5% | 1.9% | 0.7% | 0.5% | 0.7% | |
| Wind | 15 | 4 374 | 4 841 | 26 | 10 200 | 12 123 |
| <0.1% | 11.1% | 12.0% | <0.1% | 6.4% | 7.8% | |
| Hydro | 8 505 | 8 768 | 8 872 | 35 480 | 35 359 | 35 288 |
| 27.0% | 22.3% | 22.1% | 22.6% | 22.0% | 22.6% | |
| All renewable sources | 8 745 | 15 835 | 16 767 | 36 614 | 49 378 | 52 105 |
| 27.7% | 40.3% | 41.7% | 23.3% | 30.8% | 33.4% | |
| All sources | 31 538 | 39 302 | 40 215 | 157 280 | 160 422 | 155 946 |
Generation Trends
Ontario generated 58.3% of its electricity from 18 of Canada’s 19 CANDU nuclear reactors. (The remaining reactor is in New Brunswick.) Coal, Ontario’s third largest source of electricity in 2005, was phased out completely in 2014, and replaced with increased nuclear, wind, solar and natural gas generation.
In 2016, hydro was Ontario’s second largest source of electricity. Hydro has accounted for an average of 23.1% of generation since 2005. Non-hydro renewables experienced strong growth under the feed-in-tariff program, an incentive implemented in 2006. Wind, solar, and biomass increased from 0.7% in 2005 to 10.8% combined in 2016. Ontario produced the most wind and solar electricity of any province or territory in 2016, at 12 123 GW.h and 3 566 GW.h, respectively.
Capacity Changes in 2016
Ontario added an estimated 932 MW of capacity in 2016, all from renewable sources. As much new capacity came from wind as from all other sources combined. The Armow, and Grand Bend wind projects were the largest capacity additions at 180 MW and 100 MW respectively.
More Information
Canada’s Renewable Power Landscape 2016 – Energy Market Analysis provides additional information on renewable power in Ontario.
Residential Bills and Greenhouse Gas Generation Intensity
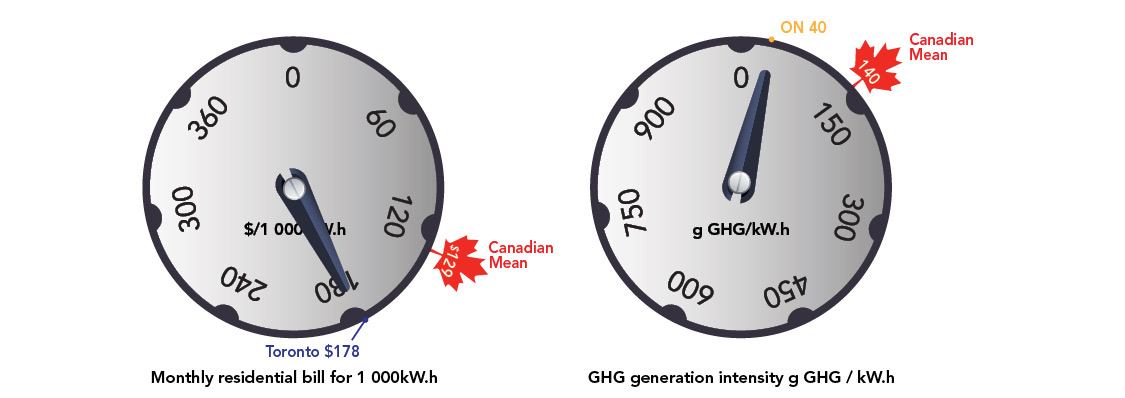
Ontario’s largest city, Toronto, has a relatively high residential electricity bill of $178 for 1 000 kW.h compared to the Canadian mean of $129 per 1 000 kW.h. Ontario’s GHG generation intensity is relatively low, emitting 40 grams of GHGs per kW.h compared to the Canadian mean of 140 g GHG/kW.h.
FIGURE 16
Source and Description
Source:
Hydro-Québec, National Inventory Report
Description:
Two dials indicate the monthly residential electricity bill for 1 000 kW.h and the GHG generation intensity in grams of GHG per kW.h. Ontario’s largest city, Toronto, has a relatively high residential electricity bill of $178 for 1 000 kW.h compared to the Canadian mean of $129 per 1 000 kW.h. Ontario’s GHG generation intensity is relatively low, emitting 40 grams of GHGs per kW.h compared to the mean of 140 g GHG/kW.h.
- Date modified: