ARCHIVED – Canada’s Renewable Power Landscape 2017 – Energy Market Analysis
This page has been archived on the Web
Information identified as archived is provided for reference, research or recordkeeping purposes. It is not subject to the Government of Canada Web Standards and has not been altered or updated since it was archived. Please contact us to request a format other than those available.

New Brunswick
New Brunswick generated its electricity from a mix of sources, which was 29.9% renewable in 2016. Nuclear was the primary source of electricity, also accounting for 29.9% of generation, followed by hydro and coal, producing 20.6% and 20.7% of generation, respectively.
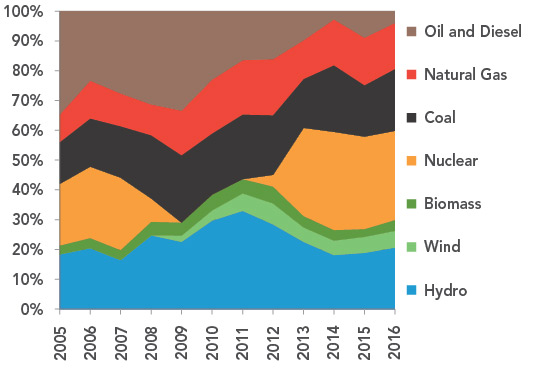
FIGURE 19 Electricity Generation by Source in New Brunswick
Description
This graph shows the composition of New Brunswick’s electricity generation between 2005 and 2016. Hydro fluctuated from 18.4% in 2005, to 33.0% in 2011, then decreased to 20.6% in 2016. Wind’s share increased from zero to 5.6%. Biomass remained stable at around 4.0%. Nuclear dropped to zero between 2009 and 2011 then increased to 29.9% in 2016. Coal fluctuated from 13.9% in 2005, to an average of 21.6% between 2009 and 2011, and was 20.7% in 2016. Natural gas increased from 9.4% in 2005 to 15.5% in 2016, while oil and diesel dropped from 34.7% to 3.9% over these years.
TABLE 8 Electric Capacity and Generation in New Brunswick
| Capacity in MW and % | Generation in GW.h and % | |||||
|---|---|---|---|---|---|---|
| 2005 | 2015 | 2016 | 2005 | 2015 | 2016 | |
| Oil and Diesel | 1 593 | 1 593 | 1 593 | 7 300 | 1 223 | 591 |
| 37.6% | 35.2% | 35.2% | 34.7% | 8.9% | 3.9% | |
| Natural Gas | 340 | 350 | 350 | 1 980 | 2 212 | 2 359 |
| 8.0% | 7.7% | 7.7% | 9.4% | 16.0% | 15.5% | |
| Coal | 541 | 490 | 490 | 2 922 | 2 373 | 3 148 |
| 12.8% | 10.8% | 10.8% | 13.9% | 17.2% | 20.7% | |
| Nuclear | 680 | 705 | 705 | 4 378 | 4 277 | 4 545 |
| 16.1% | 15.6% | 15.6% | 20.8% | 31.0% | 29.9% | |
| Biomass | 127 | 127 | 127 | 610 | 361 | 548 |
| 3.0% | 2.8% | 2.8% | 2.9% | 2.6% | 3.6% | |
| Wind | 0 | 294 | 294 | 0 | 737 | 856 |
| 0.0% | 6.5% | 6.5% | 0.0% | 5.3% | 5.6% | |
| Hydro | 953 | 961 | 961 | 3 875 | 2 612 | 3 134 |
| 22.5% | 21.3% | 21.3% | 18.4% | 18.9% | 20.6% | |
| All renewable sources | 1 080 | 1 382 | 1 382 | 4 485 | 3 710 | 4 538 |
| 25.5% | 30.6% | 30.6% | 21.3% | 26.9% | 29.9% | |
| All sources | 4 235 | 4 520 | 4 520 | 21 064 | 13 796 | 15 181 |
Generation Trends
Nuclear, hydro, coal, and natural gas all provide a significant portion of New Brunswick’s electricity. Nuclear was the largest source in 2016, accounting for 29.9% of the province’s total generation. The Point Lepreau Nuclear Generating Station is the only nuclear power station in Canada outside of Ontario. It was refurbished between 2009 and 2011.
Coal and natural gas power generation have remained stable, supplying 20.7% and 15.5% of total generation in 2016. Oil and diesel generation decreased significantly, from 34.7% to 3.9% since 2005, due to provincial emissions policies that helped New Brunswick meet its 2030 GHG emissions targets 15 years early.
Hydro was the main source of renewable energy in New Brunswick, accounting for 20.6% of generation in 2016. Most of the province’s wind power facilities were installed during the refurbishment of Point Lepreau. In 2016, wind accounted for 5.6% of generation. Biomass averaged 4.0% of generation between 2005 and 2016.
Capacity Changes in 2016
New Brunswick’s capacity was the same in 2016 as it was in 2015.
More Information
Canada’s Renewable Power Landscape 2016 – Energy Market Analysis provides additional information on renewable power in New Brunswick.
Residential Bills and Greenhouse Gas Generation Intensity
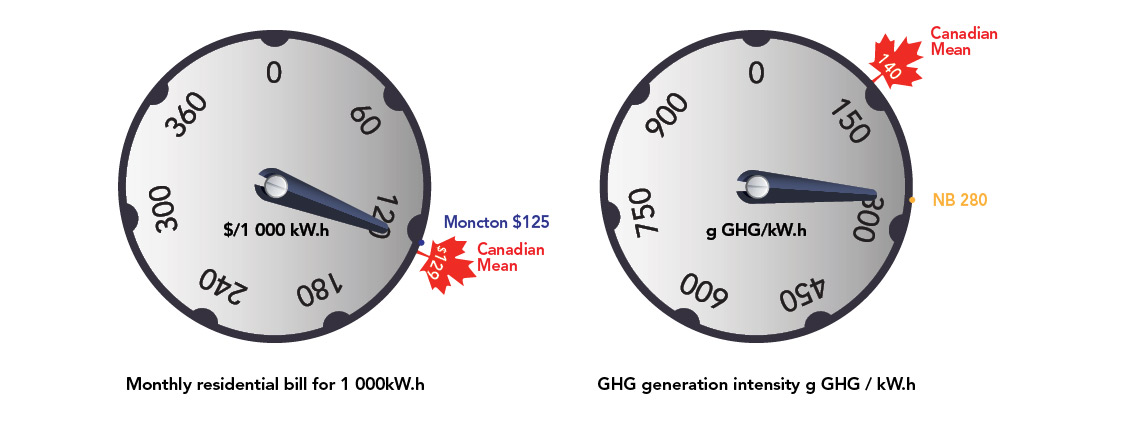
New Brunswick’s largest city, Moncton, has a residential electricity bill of $125 for 1 000 kW.h close to the Canadian mean of $129 per 1 000 kW.h. New Brunswick’s GHG generation intensity is relatively high, emitting 280 grams of GHGs per kW.h double the Canadian mean of 140 g GHG/kW.h.
FIGURE 20
Source and Description
Source:
Hydro-Québec, National Inventory Report
Description:
Two dials indicate the monthly residential electricity bill for 1 000 kW.h and the GHG generation intensity in grams of GHG per kW.h. New Brunswick’s largest city, Moncton, has a residential electricity bill of $125 for 1 000 kW.h close to the Canadian mean of $129 per 1 000 kW.h. New Brunswick’s GHG generation intensity is relatively high, emitting 280 grams of GHGs per kW.h double the Canadian average of 140 g GHG/kW.h.
- Date modified: