ARCHIVED – Canada’s Renewable Power Landscape 2017 – Energy Market Analysis
This page has been archived on the Web
Information identified as archived is provided for reference, research or recordkeeping purposes. It is not subject to the Government of Canada Web Standards and has not been altered or updated since it was archived. Please contact us to request a format other than those available.

New in this report
This update to Canada’s Renewable Power Landscape 2016 has several new features.
Non-renewable data
Canada’s Renewable Power Landscape focused on renewables. This report includes data for all individual fuels used for power generation. Data is also presented now for all electricity sources by province and territory, for the years 2005, 2015, and 2016.
TABLE 1 Electric Capacity and Generation in Canada
| Capacity in MW and % | Generation in GW.h and % | |||||
|---|---|---|---|---|---|---|
| 2005 | 2015 | 2016 | 2005 | 2015 | 2016 | |
| Oil and Diesel | 4 795 | 3 842 | 3 837 | 10 608 | 4 041 | 3 436 |
| 3.9% | 2.7% | 2.6% | 1.8% | 0.6% | 0.5% | |
| Natural Gas | 13 191 | 22 006 | 21 499 | 40 875 | 66 060 | 65 512 |
| 10.8% | 15.2% | 14.7% | 6.8% | 10.2% | 9.3% | |
| Coal | 16 003 | 9 661 | 9 661 | 96 750 | 62 256 | 60 374 |
| 13.1% | 6.7% | 6.6% | 16.1% | 9.6% | 9.3% | |
| Nuclear | 12 805 | 14 273 | 14 273 | 86 669 | 95 682 | 95 418 |
| 10.5% | 9.9% | 9.7% | 14.4% | 14.8% | 14.6% | |
| Solar | 17 | 2 135 | 2 310 | 0 | 3 001 | 3 568 |
| <0.1% | 1.5% | 1.6% | 0.0% | 0.5% | 0.5% | |
| Biomass | 1 804 | 2 414 | 2 702 | 7 688 | 12 511 | 13 214 |
| 1.5% | 1.7% | 1.8% | 1.3% | 1.9% | 2.0% | |
| Wind | 557 | 11 072 | 11 902 | 1 453 | 28 314 | 30 462 |
| 0.5% | 7.6% | 8.1% | 0.2% | 4.4% | 4.7% | |
| Hydro | 72 890 | 79 434 | 80 403 | 358 387 | 374 116 | 383 392 |
| 59.7% | 54.8% | 54.8% | 59.5% | 57.9% | 58.8% | |
| All renewable sources | 75 268 | 95 056 | 97 317 | 367 528 | 417 942 | 430 636 |
| 61.7% | 65.6% | 66.4% | 61.0% | 64.7% | 66.0% | |
| All sources | 122 061 | 144 838 | 146 588 | 602 430 | 645 981 | 652 375 |
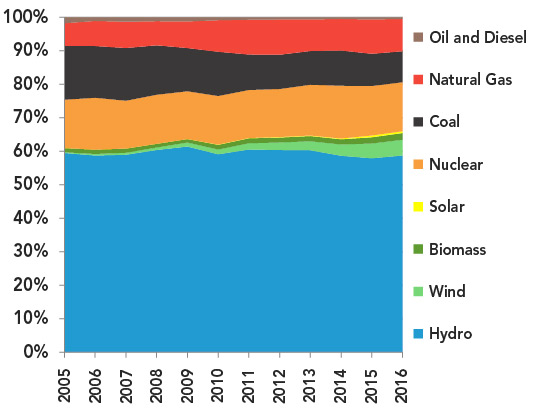
Area graphs
An area graph depicts the percentage share of generation from each source, over the years 2005 to 2016. It shows changes over time in the mix of fuels used for power generation.
Capacity Changes in 2016
This report discusses capacity changes in 2016. It describes the annual, incremental changes made to Canada’s power landscape, including the steady growth of renewables.
Data Sources and Methodology
The generation data for the years 2005 to 2016 are historical values based on data from Statistics Canada. Data for oil and diesel, natural gas, coal, nuclear, wind, and hydro generation is derived from Statistics Canada’s CANSIM series 127-0007 and 127-0006. These values are also used in Canada’s Energy Future 2017: Energy Supply and Demand Projections to 2040 (EF2017) up to 2015. Generation data for biomass and solar in 2016 is taken from EF2017. Capacity data for the years 2005 to 2015 is based on Statistics Canada data. Capacity in 2016 is a modeled estimate based on the NEB’s energy supply and demand model, which is used in EF2017.
GHG data comes from the 2017 release of Canada’s National Inventory Report 1990-2015. This contains emissions GHG data for the years from 1990 to 2015.
Residential electricity bill data comes from Hydro Québec. The Canadian average monthly residential bill is the population weighted average of the representative city in each province or territory. The weight is by the population of each province.
GHG intensity dial
A dial displays the average grams of greenhouse gasses (g GHG) emitted per kilowatt hour (kW.h) of electricity generated in each province and territory. GHG intensity is expressed in grams of GHG emitted per kW.h of electricity generated. It varies greatly by region depending on the sources of electricity.

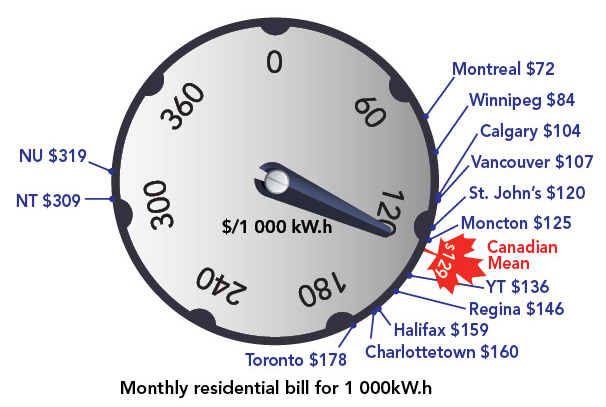
Electricity price dial
A second dial displays the average monthly residential bill for 1 000 kW.h of electricity in the most populous cityFootnote 1 in each province and territory. A number of factors, including the local mix of electricity sources and transmission, distribution and administration costs contribute to the total cost of electricity to consumers. Prices also vary throughout each province and territory.
Grams of Greenhouse Gases
In this report emissions from power generation are graphically shown in grams of greenhouse gases per kilowatt hour (g GHG / kW.h). Different greenhouse gases have different global warming potentials compared to CO2. Greenhouse gases can be measured in terms of CO2 equivalent, this is the amount of CO2 that would cause the same amount of warming. Grams of greenhouse gases is the mass of CO2 equivalent.
- Date modified: