ARCHIVED – Canada’s Renewable Power Landscape 2016 – Energy Market Analysis
This page has been archived on the Web
Information identified as archived is provided for reference, research or recordkeeping purposes. It is not subject to the Government of Canada Web Standards and has not been altered or updated since it was archived. Please contact us to request a format other than those available.
Alberta
In 2015 Alberta generated 7 947 GW.h or 10% of its total generation from renewables. This is a significant increase from the 4 782 GW.h generated in 2005.
To meet increasing electricity demand between 2005 and 2015, many power plants, mainly fired with natural gas, were built in Alberta. Consequently, the share of renewable generation increased only slightly from 7% in 2005 to 10% in 2015.
Approximately 40% of Alberta’s generation capacity is natural gas-fired and 40% is coal-fired. However, coal-fired generation produces 51% of Alberta’s electricity, and Alberta has the highest level of coal-fired generation of any province. Alberta has significant coal and natural gas resources which can make it difficult for other fuel sources to be cost-competitive.
Alberta deregulated the wholesale electricity market in 1996 and the retail electricity market in 2001. Wholesale prices are determined by the market which consists of about 200 participants including five major wholesalers. The system is administered by the Alberta Electric System Operator.
Alberta has approximately 1 500 MW of installed wind capacity, ranking third behind Ontario and Quebec. The 300 MW Blackspring Ridge project, the largest wind energy investment in western Canada, was built in 2014. The project is partially financed through RECs. While power from the project is sold in Alberta, the project’s RECs are contracted to Pacific Gas and Electric, a California utility, who uses them to comply with California’s renewable portfolio standards.Renewable projects face specific challenges in Alberta. In Alberta’s deregulated market, producers sell to the power pool at market rates. Wind farms cannot always adjust output to produce more electricity when prices are at their peak. Consequently, they more often sell energy at times when prices are weaker, earning lower average revenue than other producers.
In addition, unlike power generated from coal and natural gas, wind and solar cannot produce power on demand for Alberta’s many industrial users. This reliability risk is a drawback for industrial users without backup supply sources. Finally, due to the distance between major demand centres and suitable rivers in Alberta, the high cost to develop hydro-electricity currently prevents its widespread use.
In 2007, Alberta established legislation targeted towards large industrial emitters to reduce GHG emissions. In 2008, a target to reduce emissions by 200 Mt below current projections by 2050 was introduced as part of Alberta’s Climate Change Strategy. Since 2008, Alberta implemented a net-metering program which allows Albertans to send excess small scale generation from renewable sources into the grid.
In November 2015, Alberta introduced a plan to phase out coal-fired generation by 2030. The Climate Leadership Plan proposes replacing two thirds of generation capacity with renewables and the remainder with natural gas. The proposed strategy would also include renewable incentives.
| Capacity in MW and % | Generation in GW.h and % | |||
|---|---|---|---|---|
| 2005 | 2015 | 2005 | 2015 | |
| Hydro | 869 | 894 | 2 316 | 1 709 |
| 7% | 5% | 3% | 2% | |
| Wind | 251 | 1 463 | 741 | 4 089 |
| 2% | 9% | 1% | 5% | |
| Biomass | 271 | 428 | 1 725 | 2 149 |
| 2% | 3% | 3% | 3% | |
| All renewable sources | 1 391 | 2 791 | 4 782 | 7 947 |
| 12% | 17% | 7% | 10% | |
| All sources | 12 008 | 16 279 | 68 435 | 81 540 |
This table shows Alberta's electric capacity and generation from renewables in 2005 and 2015. The share of hydro in total capacity decreased from 7% to 5% while the share of wind increased from 2% to 9% and the share of biomass from 2% to 3%. The share of hydro in total generation decreased from 3% to 2% while the share of wind increased from 1% to 5% and the share of biomass remained stable at 3%.
FIGURE 7 Renewable Resources and Capacity in Alberta
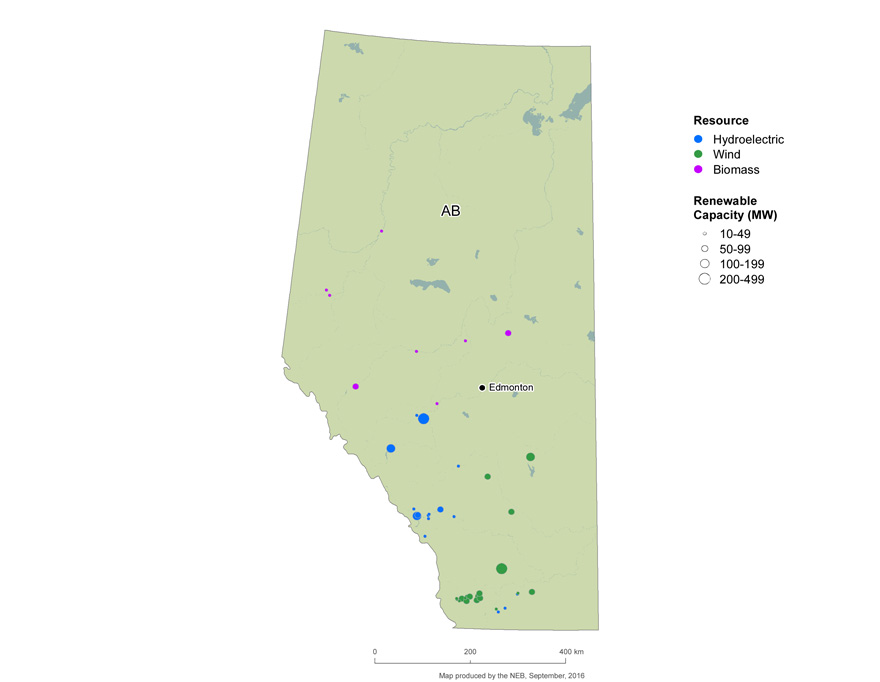
Text version of this map
The map shows the location and approximate capacity of renewable power plants with a capacity of at least 10 MW across Alberta. Wind farms are concentrated in the southern region while hydroelectric resources are located southwest and biomass resources are concentrated in the north. There are no solar resources with a capacity of at least 10 MW.
FIGURE 8 Electric Generation Capacity in Alberta

Text version of this graphic
This bar graph shows Alberta’s total electric capacity in 2005 and 2015 for all fuel sources. Capacity increased from 12 008 MW to 16 018 MW, with renewables increasing from 12% to 17% of total capacity.
- Date modified: