ARCHIVED – Canada’s Renewable Power Landscape 2016 – Energy Market Analysis
This page has been archived on the Web
Information identified as archived is provided for reference, research or recordkeeping purposes. It is not subject to the Government of Canada Web Standards and has not been altered or updated since it was archived. Please contact us to request a format other than those available.

Canadian Overview
Canada’s power infrastructure took decades to build. It was designed to use an abundance of relatively inexpensive hydrocarbons and ample hydro potential. About half of Canada’s generating facilities have been operating for more than 25 years.
New capacity additions have been limited because of low demand growth and the long-lived nature of electricity facilities. In the last decade, electricity demand growth in most of Canada has been modest. Canada generated 646 TW.h of electricity in 2015, only 6% higher than the 610 TW.h generated in 2005.
In 2015, Canada ranked fourth in the world in renewable power production and second in hydro production. Hydro is the dominant source of electricity in Canada, and accounts for nearly 60% of installed capacity and generation in 2015.
Power generated from all renewable sources increased from 60% to 65% of total generation from 2005 to 2015.
Ontario and Quebec account for the majority of the electricity capacity in the country. Accordingly, the policies and initiatives in these provinces have the greatest impact on Canadian totals. About 75% of wind and solar capacity added between 2005 and 2015 is located in these two provinces. In Ontario, strong support mechanisms for renewable power were developed to replace capacity lost due to the phaseout of over 6 000 MW of coal.
On a national level, coal capacity declined by 6 228 MW while natural gas capacity increased by 8 399 MW. Natural gas plants are less GHG intensive than coal; they have relatively low capital costs and construction periods, and they can be built in small increments. In addition, infrastructure to bring natural gas to generation sites already exists.
| Capacity in MW and % | Generation in GW.h and % | |||
|---|---|---|---|---|
| 2005 | 2015 | 2005 | 2015 | |
| Hydro | 72 861 | 79 280 | 358 520 | 376 909 |
| 60% | 55% | 59% | 58% | |
| Wind | 556 | 11 071 | 1 454 | 28 526 |
| 0.5% | 8% | 0.2% | 4% | |
| Biomass | 1 788 | 2 397 | 7 875 | 13 107 |
| 1% | 2% | 1% | 2% | |
| Solar | 17 | 2 134 | 0 | 3 001 |
| 0.01% | 1% | 0% | 0.5% | |
| All renewable sources | 75 222 | 94 882 | 367 849 | 421 543 |
| 62% | 66% | 60% | 65% | |
| All sources | 122 066 | 144 525 | 610 238 | 646 040 |
Capacity is measured in watts and its multiples (kW, MW, GW) and generation is measured in watt hours and its multiples (kW.h, MW.h, GW.h). A generator with 1 GW (1 000 MW) of capacity that operates at that capacity for one hour will produce 1 GW.h of electricity.
This table shows Canada’s electric capacity and generation from renewables in 2005 and 2015. The share of hydro in total capacity decreased from 60% to 55% while the share of wind increased from 0.5% to 8%, the share of biomass increased from 1% to 2% and the share of solar from 0.01% to 1%. The share of hydro in total generation decreased from 59% to 58% while the share of wind increased from 0.2% to 4%, the share of biomass increased from 1% to 2% and the share of solar increased from 0% to 0.5%.
Data for the following technologies is available for each province and territory, and as an overview of Canada.
- Hydro – Hydro electricity comes from the energy in water flowing over reservoir dams or through run-of-river projects.
- Wind – Wind power is captured by the blades of wind turbines which spin a shaft connected to a generator.
- Biomass – Biomass power comes from burning organic waste.
- Solar – Solar energy comes from PV cells converting sunlight into electricity at the atomic level.
The location and approximate size of each generating facility using these technologies is shown on the map for each region.
FIGURE 3 Renewable Resources and Capacity in Canada
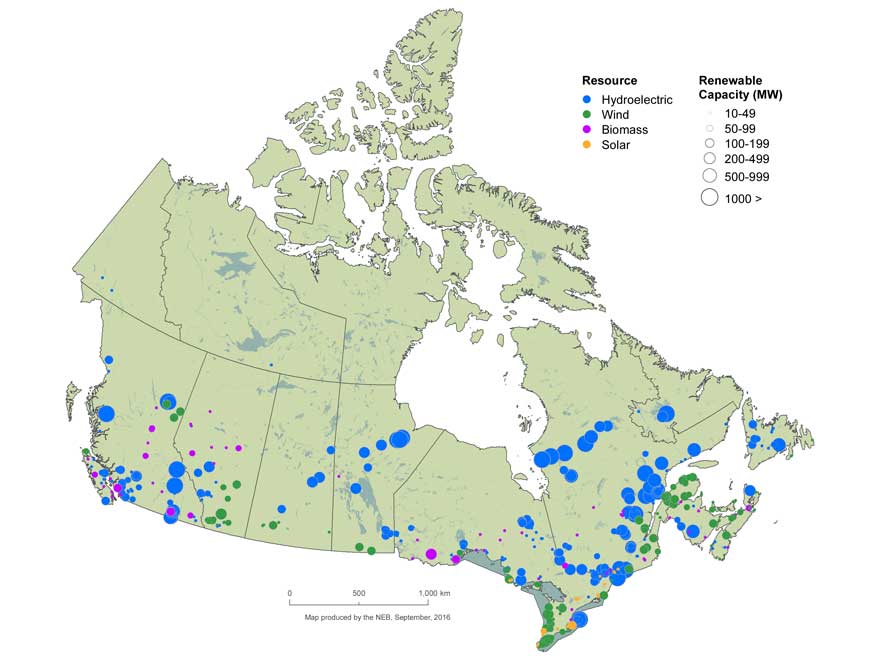
Text version of this map
This map shows the location and approximate capacity of renewable power plants with a capacity of at least 10 MW across Canada. Renewable power plants are concentrated in the provinces, and sparse in the territories. Hydroelectric power plants are most common and can be found in every province and territory with the exception of PEI and Nunavut. Wind power plants are concentrated in Ontario, Quebec, Alberta, New Brunswick and Nova Scotia. Biomass resources are more common in BC, Alberta, Ontario and Quebec, while the majority of solar resources are located in Ontario.
FIGURE 4 Electric Generation Capacity in Canada
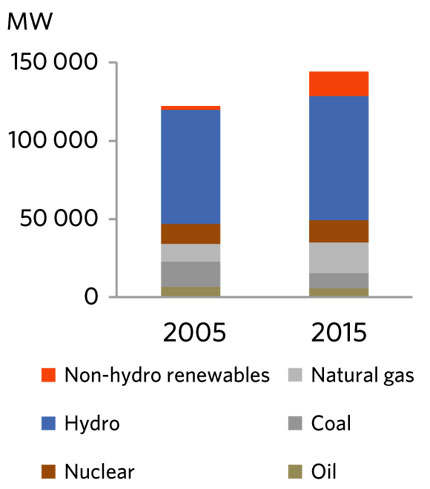
Text version of this graphic
This bar graph shows Canada’s total electric capacity in 2005 and 2015 for all fuel sources. Capacity increased from 122 066 MW to 144 267 MW, with renewables increasing from 62% to 66% of total capacity.

- Date modified: