ARCHIVED – Western Canadian Crude Oil Supply, Markets, and Pipeline Capacity
This page has been archived on the Web
Information identified as archived is provided for reference, research or recordkeeping purposes. It is not subject to the Government of Canada Web Standards and has not been altered or updated since it was archived. Please contact us to request a format other than those available.
December 2018
Western Canadian Crude Oil Supply, Markets, and Pipeline Capacity [PDF 7989 KB]
Copyright/Permission to Reproduce
ISBN 978-0-660-29095-9
A. Introduction
On 30 November 2018, the Minister of Natural Resources, The Honourable Amarjeet Sohi, wrote to the National Energy Board (NEB) to seek advice on options that may exist to further optimize pipeline capacity out of western Canada. This was in response to the growing price differential for Canadian crudes in the latter part of 2018, and its impacts on Canada. In the letter, Minister Sohi stated that the advice should address three key questions:
- Is the current monthly nomination process to access available capacity on oil pipelines functioning appropriately, consistent with the “common carrier” provisions of the National Energy Board Act and efficient utilization of pipeline infrastructure (for example, by auctioning uncontracted export capacity to smaller producers)?
- Are there any other impediments to the further optimization of pipeline capacity that could be addressed by the National Energy Board, governments or pipeline companies, in the short-term and long-term?
- Are there short-term steps to further maximize rail capacity that could be addressed by governments to alleviate the current situation?
The letter noted that in formulating this advice, the NEB should consider developing options that the government could pursue and, where necessary, consult with other agencies and the Government of Canada to obtain technical, economic, and statistical support.
On 10 December 2018, the NEB issued a letter outlining its plan for responding to Minister Sohi’s letter. In its letter, the NEB stated that it will release a public report in December 2018 on the current state of crude oil markets and pipeline capacity.
This report looks at the state of crude oil markets in western Canada. It provides facts and data on the supply chain from production site to markets. The report discusses production, markets, transportation, and prices. The report also describes how space is allocated on crude oil pipelines in Canada, and the NEB’s role in the regulation of tolls and tariffs. This report is not intended to provide advice to the questions posed by the Minister, but to serve as a backgrounder in support of the work to be conducted in early 2019 to address the Minister’s letter.
The NEB has issued this report and launched an online forum to gather public input. In January 2019, NEB staff will also meet with select pipeline companies, producers, shippers, governments, and other experts to seek input on the questions in the Minister’s letterFootnote 1.
B. Recent Market Events
The Western Canada Sedimentary Basin (WCSB) is the major crude oil producing region in Canada. Crude oil production from the WCSB, in particular from the oil sands, continues to grow each year with production now exceeding pipeline capacity.
Crude oil comes in many different grades (based on sulphur content and density/viscosity), each commanding a different price. The main heavy oil benchmark price for crude produced in western Canada is Western Canadian Select (WCS),Footnote 2 which is priced at Hardisty, Alberta. The main benchmark price for light oil produced in western Canada is Mixed Sweet Blend (MSW), which is priced at Edmonton, Alberta. Western Canadian crude benchmark prices are often reported relative to the North American light crude oil benchmark, West Texas Intermediate (WTI), which is priced at Cushing, Oklahoma.
The difference between two benchmark prices is known as the differential. For example, the most commonly quoted Canadian differential is WCS-WTI. If the WCS price is higher than WTI, the differential is positive, and is referred to as a premium. If the WCS price is lower than WTI, the differential is negative, and is referred to as a discount. WCS at Hardisty naturally trades at a discount to WTI at Cushing; however, in fall 2018 the WCS-WTI differentialFootnote 3 widened further than normal. This means that Canada received a much lower price for its oil than normal and many market participants were negatively affected.
The primary factor behind these wide oil price differentials was a growing supply of western Canadian oil production to 4.30 million barrels per day (b/d) in September 2018. Takeaway capacity on existing pipeline systems remained constant at around 3.95 million b/d. In addition, refinery maintenance in the United States (U.S.) Midwest, the largest export market for Canadian heavy crude oil, led to a significant reduction in demand for Canadian oil. These factors contributed to a backlog of Canadian crude oil, higher levels of oil in storage in Alberta, and a lower price for Canadian crude oil.
Key Recent Announcements
On 28 November 2018, the Government of Alberta announced negotiations for the purchase of rail cars to transport 120 000 b/d of crude oil to higher priced markets. The Government of Alberta expects the first 15 000 b/d of that capacity to start in December 2019, increasing to 120 000 b/d by August 2020.
The Government of Alberta also announced production curtailments on 2 December 2018. Under the curtailment, the production of raw crude oil and bitumen will be reduced by 325 000 b/d or 8.7% to address the storage glut. The curtailment will be reviewed monthly. After excess storage is reduced, the curtailment will decline to an estimated average of 95 000 b/d until 31 December 2019 when the mandated reduction is scheduled to endFootnote 4.
Immediately following the Government of Alberta curtailment announcement, the price for WCS contracted for delivery in January 2019 increased and the differential with WTI narrowed. However, contracts for delivery in later months indicate that markets expect wider than normal differentials to remain in the longer term until pipeline capacity is addressed.
C. Crude Oil Supply and Markets in Western Canada
The Crude Oil Supply Chain
Many steps are involved in moving crude oil from production site to markets. Figure C.1 illustrates a simplified supply chain for crude oil produced in western Canada.
Figure C.1: Western Canada Crude Oil Supply Chain
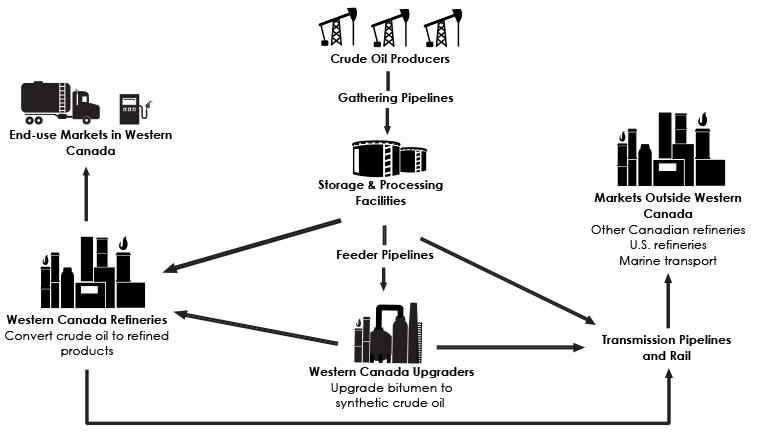
Source: NEB
Description
This highly simplified supply chain infographic illustrates the flow of crude oil from producers in western Canada through gathering pipelines, into storage, and on to upgraders or refineries in western Canada. Crude oil producers can transport their crude on pipelines or they can sell it to shippers. Shippers can include producers, refiners, midstream companies, and marketers. When crude oil is in storage, it can be transported to upgraders or refineries in western Canada, or transported on interprovincial or international pipelines (or rail) to markets outside of western Canada. Refined petroleum products produced in western Canada are either sold to markets in western Canada or transported to markets outside western Canada.
Market participants in the crude oil supply chain include producers, pipeline and other midstream asset companies, marketers, and refiners. Larger oil companies commonly participate as both producers and marketers. Integrated oil companies are those that have production and participate in the refinery and/or midstream business. Marketers buy and sell crude contracts, sometimes marketing crude on behalf of small producers who do not have specialized marketing functions. Generally, marketers trade to take advantage of market opportunities across crude grades or locations, and may also own physical storage or transportation assets, such as pipelines or rail loading facilities.
Market participants may own crude at any stage in the supply chain. Each month, shippersFootnote 5 nominate their crude oil to pipelines for transportation to customers within Canada or for export. Crude oil can change ownership many times between when it is produced and when it is refined. Refined petroleum products, such as gasoline, diesel, jet fuel, or heating oil, are ultimately distributed to end-use markets where they are sold to industrial, commercial, and residential consumers.
Crude Oil Production
Crude oil produced in Canada varies widely in quality. Crude oil can be characterized as light, medium, or heavy, based on its density and viscosity. Crude oil can also be low sulphur or “sweet”; or high sulphur or “sour”. Heavy and sour crude oils are a lower quality grade than lighter and sweeter oils because they yield less high-value end products like gasoline and diesel. Additionally, they require more processing to make into end products and are thus more costly to refine.
The majority of Canadian crude oil is produced in the WCSBFootnote 6. In 2017, total Canadian crude oil production averaged 4.21 million b/d, with 3.99 million b/d produced in the WCSB. The majority of western Canada’s oil production comes from the oil sands (mined and in situ bitumen), and three-quarters of the crude oil produced in western Canada is sour heavy oil.
Crude oil production from the WCSB continues to grow. Over the first nine months of 2018, WCSB crude oil production grew by over 2.7% to 4.30 million b/d as new oil sands facilities started operation, offsetting lower production due to an unplanned outage at the Syncrude upgrader. Additionally, output from conventional oil plays (sources where oil is produced by traditional methods) increased, after production declines over the past two years.
Beyond 2018, the majority of the WCSB’s future crude oil production growth is expected to be heavy oil from the oil sands. The NEB’s Canada’s Energy Future 2018 projects that WCSB crude oil production will grow to 6.0 million b/d in 2030 and 6.7 million b/d in 2040, assuming that infrastructure is built as needed to access markets. Figure C.2 illustrates historical crude oil production by type.
Figure C.2: Crude Oil Production from the WCSB: 2005 to 2018
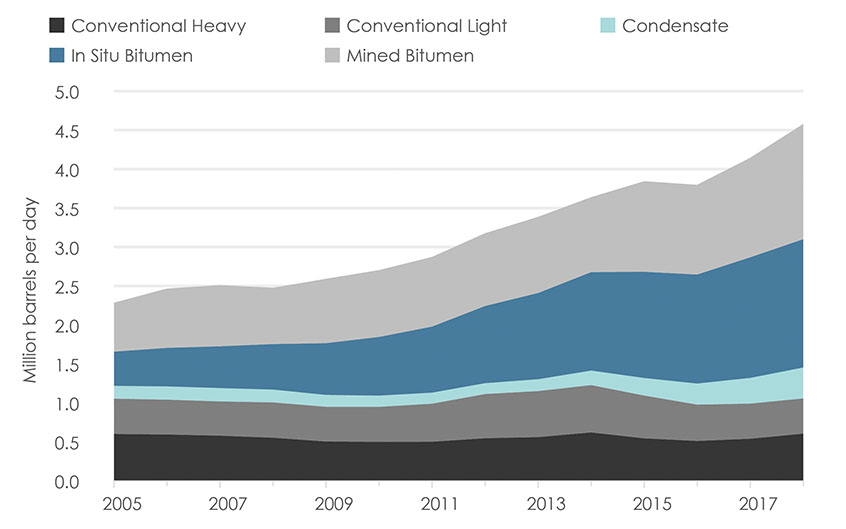
Source: NEB, Canada’s Energy Future: 2018
Description
This area graph illustrates total WCSB crude oil and equivalents production from 2005 to 2018. Data to 2017 is historical, while data for 2018 is estimated. Conventional heavy production declined from 0.60 million b/d in 2005 to 0.54 million b/d in 2017. Conventional light production remained flat at 0.45 million b/d in 2005 to 0.45 million b/d in 2017. Condensate production was 0.17 million b/d in 2005 and increased to 0.33 million b/d in 2017. In situ bitumen production increased from 0.44 million b/d in 2005 to 1.5 million b/d in 2017. Mined bitumen production increased from 0.63 million b/d in 2005 to 1.3 million b/d in 2017.
Total WCSB production has increased from 2.28 million b/d in 2005 to 4.14 million b/d in 2017. Estimated total WCSB production for 2018 is 4.58 million b/d.
Crude Oil Markets
Demand for crude oil comes from refineries. In Canada, refining capacity is largely configured to process light crude oil, although some facilities are capable of processing some volumes of heavy crudeFootnote 7. The only refinery in Canada that was built to process primarily heavy oil is the Sturgeon Refinery in Redwater, AlbertaFootnote 8.
Refineries in Alberta and Saskatchewan have a combined nameplate capacity of 616 000 b/d; though refineries rarely run at full nameplate capacityFootnote 9 . Western Canadian refineries produce refined products for domestic use and, to a lesser extent, export to the U.S. Volumes of crude oil that are surplus to the needs of refineries in western Canada are transported to eastern Canada or exported to refineries in the U.S. or overseas.
Canada is a significant exporter of crude oil. In 2017, Canada was the fourth largest crude oil exporter in the world, exporting 3.32 million b/d. Figure C.3 illustrates the movements of crude oil within and outside Canada in 2017.
Figure C.3: Canadian Crude Oil Production and Disposition Map: 2017
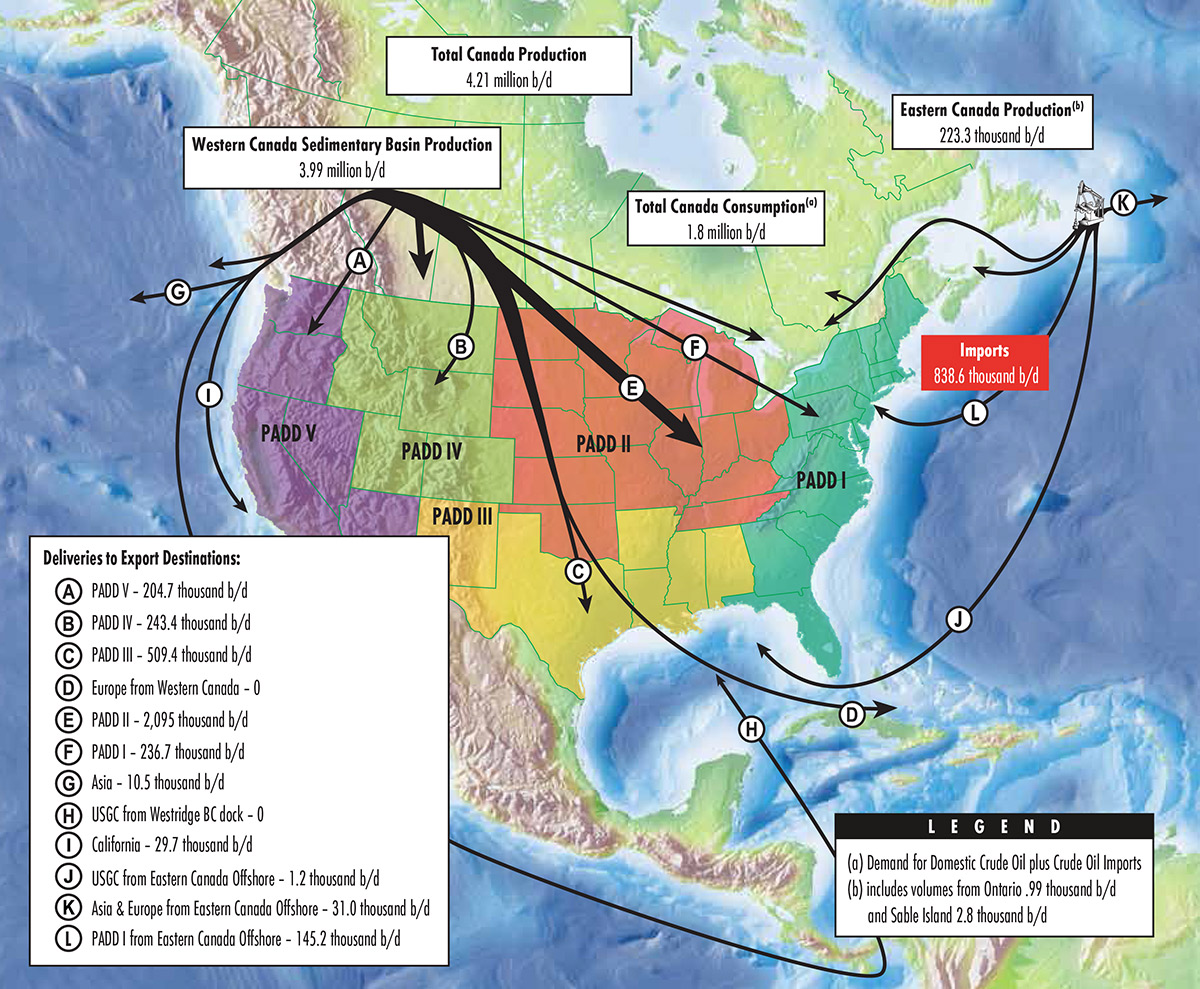
Source: NEB
Description
This map shows the supply and disposition of Canadian crude oil in 2017. Most oil is produced in the WCSB and shipped by pipeline to markets in the U.S. and Canada.
Canada is the largest supplier of heavy oil to the U.S. Refiners in the U.S. made substantial investments in the equipment necessary to process heavy crude oil. Venezuela and Mexico, two other heavy oil producers that supply oil to the U.S., are experiencing declining heavy oil production. This increases U.S. demand for Canadian oil.
Volumes Available for Export
Light crude oilsFootnote 10 have low density and low viscosity so they are able to flow through pipelines or be loaded on a rail tank car without the addition of a lighter hydrocarbon. Heavy crude oil and bitumen require mixing with a lighter hydrocarbon or diluent, such as condensate or synthetic crude oil, to reduce their viscosity. The amount of diluent that is required for heavy crude oil depends on the type of crude oil being blendedFootnote 11. Generally, this ranges from a low of 8% diluent to upwards of 50%. This combination of light crude oil, heavy crude oil, and required diluent for blending make up the total supply that is available for use, either in western Canadian refineries, or for export.
The difference between the amount of this blended supply and the volumes used in western Canadian refineries is considered to be the volume of crude oil available for export. Figure C.4 illustrates WCSB crude oil supply and disposition,Footnote 12 and the amount available for export.
Figure C.4: WCSB Crude Oil Supply and Disposition: 2010 to 2018
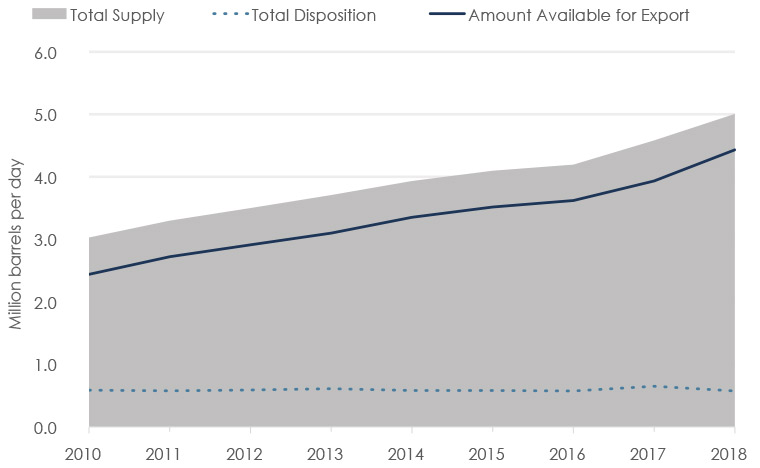
Source: NEB, Canada’s Energy Future: 2018
Description
This combined area and line chart illustrates historical and projected western Canadian crude oil supply and disposition, and oil available for export between 2010 and 2018. In 2010, total average annual supply was 3.0 million b/d, rising to an estimated 5.0 million b/d in 2018. The annual average oil available for export over the same period grew from 2.4 million b/d to an estimated 4.4 million b/d.
Pipeline Transportation
The vast majority of crude oil is transported from the WCSB to markets by pipelines. A small but increasing amount of crude oil is transported by rail in tank cars.
There are four main pipelines that transport crude oil to markets outside of Alberta:
- Keystone Pipeline delivers crude oil from Hardisty, Alberta to the U.S. Midwest and U.S. Gulf Coast.
- Trans Mountain Pipeline delivers crude oil and refined petroleum products from Edmonton, Alberta to Vancouver, B.C., Washington State, and offshore markets.
- Express Pipeline delivers crude oil from Hardisty, Alberta to Casper, Wyoming.
- Enbridge Mainline delivers crude oil, natural gas liquids, and refined petroleum products from Edmonton, Alberta to the U.S. Midwest and Sarnia, Ontario.
There are several other pipeline systems, such as the Milk River Pipeline and the Rangeland/Aurora Pipeline system, that carry smaller volumes of oil to other U.S. markets.
All oil pipelines have a physical limit to the amount of product that can technically be carried by them. This is known as the pipeline’s nameplate capacity.
Available capacity is what a pipeline can actually flow. The available capacity of a pipeline typically differs from its nameplate capacity. This can be for various reasons, such as the type of crude oil being transported, unplanned outages, maintenance, downstream constraints, or pressure restrictions. Pipeline operators calculate how much volume of product the pipeline can actually carry on any given dayFootnote 13.
In recent years, crude oil production has grown faster than pipeline capacity. Between 2013 and 2016, about one million b/d of nameplate pipeline capacity was added in Canada. No incremental nameplate capacity has been added since then. The NEB estimates that the available pipeline takeaway capacity from the WCSB in September 2018 was 3.95 million b/d.
Figure C.5: Pipeline Capacity and Crude Oil Available for Export from the WCSB
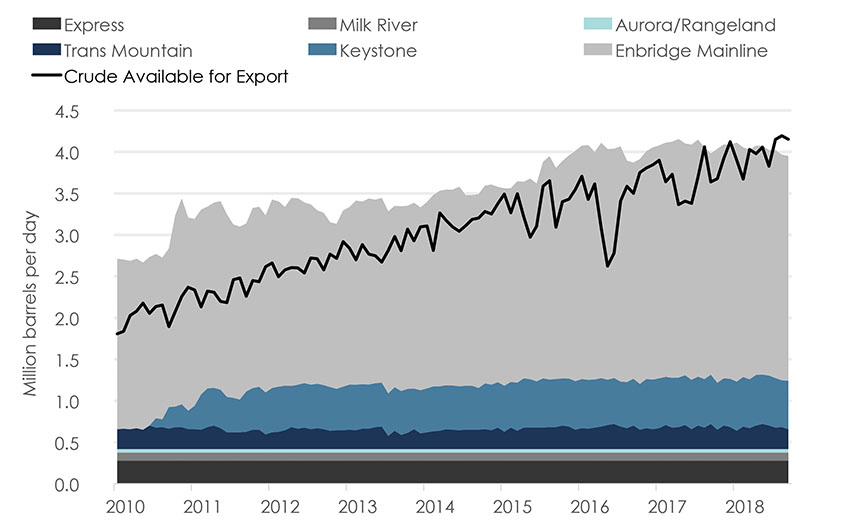
Source: NEB
Description
This combined area and line chart illustrates estimated takeaway capacity and crude oil available for export from the WCSB.
Note: The data used for the crude oil takeaway capacities from WCSB pipelines are as follows:
Trans Mountain, Keystone, and Enbridge Mainline report monthly available capacity to the NEB. This data is available on the NEB’s Pipeline Profiles.
Aurora, Express, and Milk River are Group 2 pipelines as described in Guide P.6 of the NEB’s Filing Manual. Group 2 pipelines are exempt from reporting monthly capacity and throughput. Values shown are the nameplate capacities of these pipelines less 1% to account for the average difference between nameplate and available capacities of similar lines (Keystone and Trans Mountain).
Figure C.5 illustrates NEB-estimated available capacity from the WCSB for crude oil pipelines between January 2010 and September 2018. Figure C.5 also illustrates the amount of crude oil available for export.Footnote 14 In September 2018, the amount of crude oil available for export exceeded available pipeline capacity by an estimated 202 000 b/d. The NEB also estimates this number would be 365 000 b/d if pipeline throughput, rather than available capacity, was used to represent the amount of crude oil that can move out of the basin by pipeline.
This excess oil supply is either held in storage, where available, or exported from the WCSB by other modes of transportation, such as rail.
Rail Transportation
Rail transportation of crude oil is a more expensive alternative to pipeline transportation. Rail is typically only used when pipeline infrastructure is not available, or when price differentials are wide enough for rail to be economic.
There are limitations to the use of rail. Unless facilities already exist, rail capacity cannot be brought on quickly to accommodate sudden increases in demand caused by insufficient pipeline capacity or when extraordinary circumstances affect pipeline operations. It also takes time to acquire specialized tank cars, locomotives, and associated loading/unloading infrastructure, and to train crews.
Crude-by-rail currently accounts for 6.2% of the volume of rail freight in Canada. This means that companies wishing to transport their oil production by rail are competing for rail space with many other commodities.
The NEB does not regulate the transportation of crude oil by rail; other government agencies regulate various aspects of it. However, when companies export oil, by rail or any other mode of transport, they must hold an export order or licence from the Board and report exported volumes monthly.
Figure C.6: Monthly Volumes of Crude-by-Rail Exports from Canada
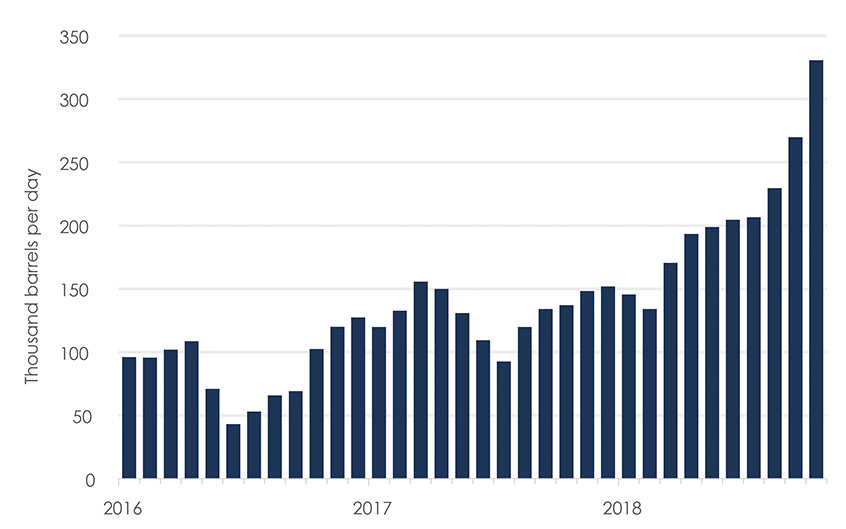
Source: NEB, Canadian Crude Oil Exports by Rail
Description
This column chart illustrates crude-by-rail exports from Canada between January 2016 and October 2018. In 2016, crude-by-rail exports averaged 88 000 b/d. In 2018, exports averaged 206 000 b/d and reached a record high of 327 229 b/d in October 2018.
Figure C.6 shows exports of crude oil by rail to the U.S. between 2016 and October 2018. Crude oil exports by rail have steadily increased since March 2018. In October, rail exports reached a record of 327 229 b/d.
When the combination of available pipeline capacity and rail export capability is insufficient to transport oil produced in western Canada to markets, the excess volume backs up into storage and, ultimately, results in lower prices for most Canadian crude benchmarks.
Crude Oil Storage
There is over 88 million barrels of crude oil and diluent storage capacity in western Canada.Footnote 15 Most of this storage is located in the crude oil transportation hubs of Edmonton and Hardisty in Alberta. There is also a significant amount of storage capacity at western Canadian refineries and at field production sites throughout the WCSB.
Canadian crude oil storage data are generally not reported or made public. Statistics Canada reports monthly crude oil storage levels subject to data availability and reporting, but these statistics are published historically and are of limited use to determine current levels. Despite the lack of crude oil storage data in Canada, available estimates indicate that storage in western Canada is currently near capacity.
Crude Oil Pricing
Canadian crudes are commonly priced relative to crude oils in the markets where they compete for refining capacity. Given that WCSB crude oil is refined in the U.S., prices are often reported relative to the North American benchmark light crude oil, WTI. The difference between a specific grade of Canadian crude and WTI is called the differential.
Two major components comprise the oil price differential in a balanced market:
- Quality difference: heavy crudes are lower quality than light crudes because they yield a lower amount of high value end-products, like gasoline and diesel. Heavy crude oil is also more costly to refine compared to light crude oil. Similarly, sour crudes are lower quality than sweet crudes as sour crudes require additional refining steps and costs to remove the sulphur. Therefore, heavy crudes typically sell at a discount to lighter crudes, and sour crudes sell at a discount to sweet crudes.
- Transportation cost: holding quality constant, crude oil that is physically located closer to major refinery regions will sell for more than crude oils located further from refineries. This price difference reflects the additional cost to transport the crude oil to the refineries.
Oil price differentials are also affected by overall supply and demand fundamentals as well as general market sentiment.
As illustrated in Figure C.7, WCS has historically sold at a discount to WTI, reflecting the lower quality of WCS and the cost to transport the crude oil to U.S. refineries. Between 2015 and 2017, this differential averaged a discount of US$12.95 per barrel. In 2018, the differential averaged a discount of US$27.09, with a discount of US$50 per barrel on some trading days in October 2018.
Figure C.7: Monthly Crude Oil Prices and the WCS-WTI Differential
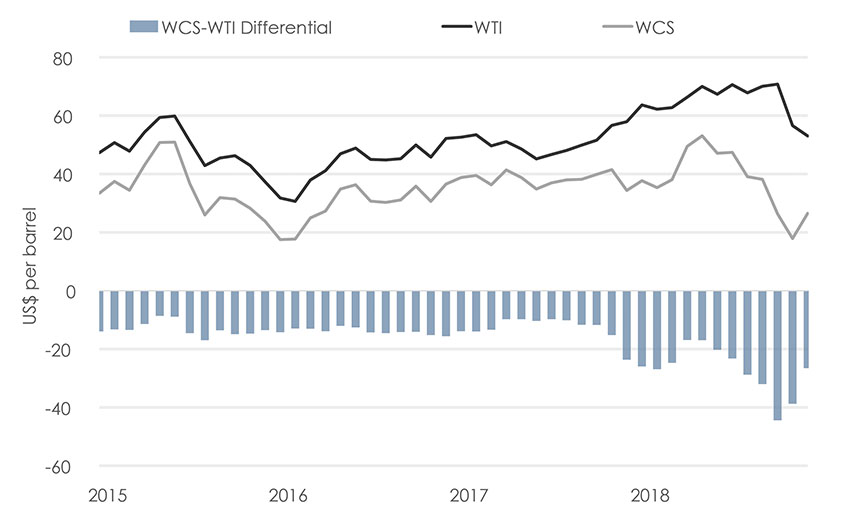
Source: Net Energy Exchange
Description
This combination column and line graph shows the monthly average price of WTI at Cushing and WCS at Hardisty from January 2015 to December 2018. In 2015, WCS traded at an average discount of $US13.12 to WTI. In 2018, the discount widened to an average $US27.09, reaching a monthly average peak of $US44.42.
Oil price differentials are also relevant for lighter grades in Canada such as Mixed Sweet Blend (MSW) and Syncrude Sweet Premium (SSP)Footnote 16. SSP and MSW are of similar quality to WTI. Historically, SSP has traded at a slight premium to WTI, while MSW has traded at a slight discount to WTI. However, in fall 2018 both SSP and MSW traded at a sizable discount to WTI, as illustrated in Figure C.8.
Figure C.8: Canadian Light Sweet Crude Oil Price Differentials
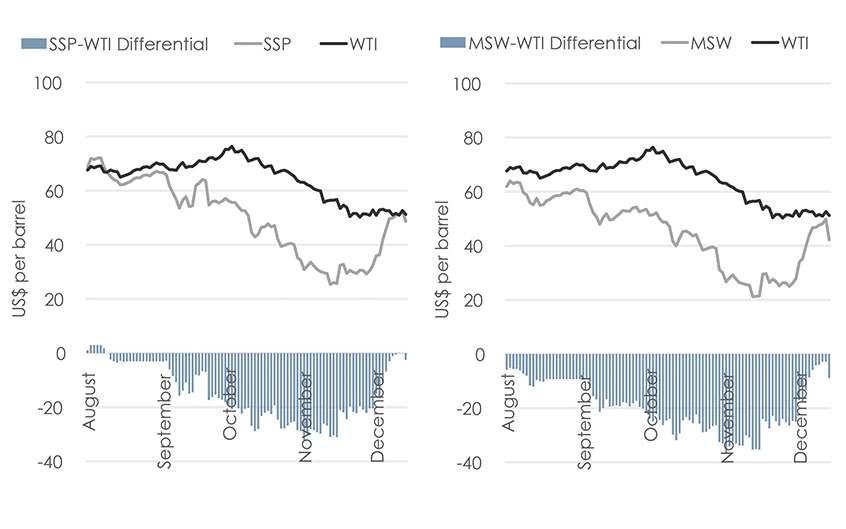
Source: Net Energy Exchange
Description
These combination line and column charts illustrate the prices of SSP and MSW (both priced at Edmonton), and the differentials of these two crudes against WTI. In August 2018, the SSP-WTI differential averaged a discount of US$1.47 per barrel. In November, the SSP-WTI differential widened to an average discount of US$25.32, reaching a discount of US$32.16 on November 1st. In August 2018, the MSW-WTI differential averaged a discount of US$8.62 per barrel. In November, the MSW-WTI differential widened to an average discount of US$29.33, reaching a discount of US$36.41 on November 1st. In December 2018, the SSP-WTI differential narrowed to an average discount of US$10.31 per barrel, while the MSW-WTI differential narrowed to an average discount of US$12.26 per barrel.
Commercial trading for Canadian crude oil is relatively decentralized across various brokers’ trading platforms. Because there are various qualities of crude being produced in the WCSB, sometimes large volumes of crude oil are traded directly between two market participants without using trading platforms in what are referred to as “over the counter” transactions. As a result, pricing is not as transparent as it is for other commodities such as natural gas, which has a more centralized trading systemFootnote 17.
Effects on Market Participants
While Canadian price differentials widened in recent months, the effects are not evenly distributed amongst all market participants. Participants with access to capacity on pipelines and/or rail are able to get their crude oil to higher priced markets. Some participants, particularly larger producers, may also have been protected by financial hedges or long-term sales contracts set at higher prices. In addition, market participants who own storage facilities may be able to minimize negative effects. Integrated producers with upgrading capacity, refining capacity, or both, are less negatively affected by lower crude oil prices as they may be able to buy feedstock for their upgraders and refineries at much lower prices.
Many small and mid-size producers without these options are among the most negatively affected by the wider price differentials. Some WCSB producers who are not vertically integrated and could not find a short-term solution to the widening differential announced that they would cut production. There was no consensus among producers to cut production and, prior to the directive by the Government of Alberta, many chose not to. Some producers, particularly conventional oil producers, have lower operating costs so these producers may still be profitable while many oil sands producers are losing money because they have higher cost structures. In addition, cutting production at in situ oil sands operations may risk damage to the reservoir and ultimately negatively affect the future value of the asset. These producers may be more hesitant to reduce production, even when prices are very low.
D. Allocation of Capacity on Crude Oil Pipelines
NEB Regulation of Tolls and Tariffs of Crude Oil Pipelines
Pursuant to the National Energy Board Act (NEB Act), the NEB may make orders with respect to all matters relating to traffic, tolls, or tariffs on international and interprovincial oil pipelines. Accordingly, the NEB has the ability to regulate how pipeline capacity is allocated to shippers, including in times of apportionment. Two legislative requirements are of particular relevance to the allocation of capacity on oil pipelines.
First, pursuant to subsection 71(1) of the NEB Act, oil pipeline companies must be common carriers that offer service to any party that wishes to ship on their pipelines. The NEB Act does not specify criteria that the NEB must take into consideration in determining whether a pipeline complies with subsection 71(1). Rather, the NEB has broad discretion in determining compliance with this requirement. The NEB has, in practice, found that an oil pipeline complies with its common carrier requirements when it properly conducts an open seasonFootnote 18 and where its facilities are either readily expandable or makes some capacity available to shippers for uncommitted service.
Second, pursuant to section 67 of the NEB Act, a company must not unjustly discriminate against any person or locality in tolls, service, or facilities. This means that all parties must have access to transportation without unjust discrimination, as long as they meet the requirements of the tariff. The NEB Act does not specify criteria that the NEB must use in assessing whether tolls, service, or facilities are unjustly discriminatory. The NEB has flexibility in making this determination considering the specific circumstances of the pipeline.
Pipeline Transportation Services and the Allocation of Capacity
Pipelines regulated by the NEB commonly offer two broad categories of service: committed and uncommitted. Under committed service, or contract carriage, a shipper signs a transportation services agreement with the pipeline company. The transportation services agreement is a contract that commits the shipper to transport a specific amount of oil for a specific term. The terms of these agreements can vary widely and can go up to 20 years or more. Pipelines typically make committed service available to shippers through an open season process. The process is intended to give all shippers an equal opportunity to contract for pipeline capacity.
With committed service, shippers pay for contracted capacity regardless of whether they use it. Committed service provides more certainty for the long-term revenue of a pipeline company and provides more certainty for shippers as well. Tolls for committed service are commonly lower than tolls for uncommitted service.
Under uncommitted service, shippers are not required to sign long-term contracts for transportation service. Every month each shipper submits a nomination for the volume of crude oil that it would like to ship. The pipeline company then allocates available pipeline capacity to shippers in accordance with these nominations. By using uncommitted service, shippers pay a toll for the volume of oil that they actually transport. Uncommitted service has a lower transportation priority than committed service so, if pipeline capacity is constrained (for example, because of unplanned outages or maintenance), the pipeline will reduce the amount of uncommitted service before curtailing committed service.
Historically, oil pipelines offered all capacity to shippers under uncommitted service. For example, Enbridge has no long-term contracts with shippers for service on its Mainline. However, this practice has been changing since the mid-1990s. Since then, oil pipelines have relied more on long-term contracts to support pipeline construction and expansion projects. For example, the Trans Mountain Pipeline and the Keystone Pipeline offer committed service but reserve a portion of their capacity for uncommitted service every month. The amount of capacity reserved for uncommitted service differs for each pipeline.
Table D.1 provides estimations of the nameplate capacity, amount of committed service, and amount of capacity reserved for uncommitted service on four large NEB-regulated pipelines.
Table D.1: Estimates of Nameplate Capacity and Amount of Capacity for Uncommitted Service
| Pipeline System | Nameplate Capacity | Contracted Capacity | Capacity Available for Uncontracted Transportation |
|---|---|---|---|
| Enbridge Mainline | 2 850 000 | 0 | 100% |
| Trans Mountain | 300 000 | 54 000 | 82% |
| Keystone | 591 000 | 555 000 | 6% |
| Express | 280 000 | 250 000 | 10% |
Source: NEB
Description:
The table provides estimates of the amount of nameplate capacity, committed service, and capacity reserved for uncommitted service on the Enbridge Mainline, the Trans Mountain Pipeline, the Keystone Pipeline, and the Express Pipeline.
Pipeline Apportionment
Pipeline apportionment occurs when shippers want to transport more oil than the pipeline can accommodate in a month. This can occur when the supply of oil nominated for transportation is greater than the available pipeline capacity, or when pipeline service disruptions reduce pipeline capacity. On contract carriers, uncommitted shippers would be apportioned first, followed by committed shippers only if capacity was reduced below the amount of contracted service.
Under apportionment, each uncommitted shipper is allocated a pro rata, or proportional, share of pipeline capacity based on the shipper’s nomination. In other words, apportionment is the percentage by which each shipper’s nominated volume is reduced in order to meet the capacity that the pipeline has available. For example, assume a pipeline has a capacity of 990 barrels and only two shippers. If shipper A nominates 100 barrels and shipper B nominates 1 000 barrels in one month, total nominations would be 1 100 barrels. The pipeline would need to apportion nominations by 10% to match the capacity of the pipeline. In this example, shipper A would be able to ship 90 barrels and shipper B would be able to ship 900 barrels.
Table D.2: Apportionment Example with Two Shippers
| Nomination | Capacity Received (10% Apportionment) | |
|---|---|---|
| Shipper A | 100 barrels | 90 barrels |
| Shipper B | 1 000 barrels | 900 barrels |
| Total | 1 100 barrels | 990 barrels |
Description:
The table provides an illustration of the example described above, where two shippers have their nominations reduced under 10% apportionment.
In an attempt to reduce the effects of apportionment, some shippers nominate more barrels of oil than they intend to ship on a pipeline. By over-nominating, shippers increase the likelihood that they receive, post-apportionment, the amount of pipeline capacity that they desire. This practice of over-nominating is sometimes referred to as nominating “air barrels”. As a result of over-nomination, some shippers might end up being allocated more space on the pipeline than they can actually use. Meanwhile other shippers may require more pipeline space than they were allocated. These shippers can engage in trades in the secondary market and this may add complexity to the nomination process and the subsequent operation of the pipeline. Over-nominations also have the effect of inflating apportionment percentages on pipelines.
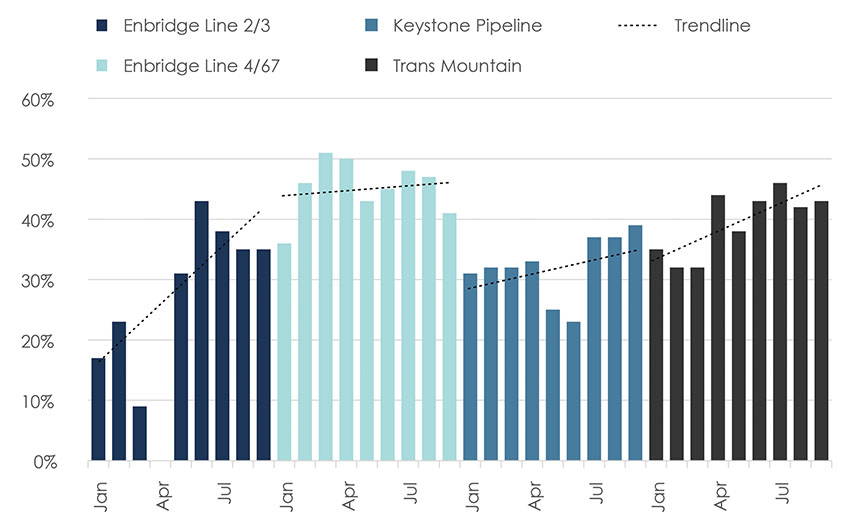
Figure D.1 illustrates the apportionment percentages on four NEB-regulated pipelines in 2018. The data for these graphs are available. The average apportionment percentage for each of the pipeline systems increased over the year.
Figure D.1: Apportionment on Select NEB-Regulated Pipelines in 2018
Source: NEB
Description
These column charts illustrate the apportionment percentages on Enbridge Line 2/3, Enbridge Line 4/67, the Keystone Pipeline System, and the Trans Mountain Pipeline for January 2018 to September 2018. Each chart includes a trend line that highlights the change in apportionment percentages over time.
Pipeline Tariffs
Pipeline companies and shippers must follow the rules and regulations of transportation service set out in tariffs. Tariffs describe the terms and conditions of shippers’ access to the pipeline, the tolls for transportation service, and the rights and responsibilities of both the pipeline company and the shipper. Tariffs specify the procedures by which shippers are to submit nominations for transportation service, and the form and timing of nominations. Tariffs also include the methodology used for allocating capacity to shippers in times of apportionment.
Many tariffs require shippers to support their nominations by providing written third-party verification that the shipper has the capability to tender oil to the pipeline to satisfy its nominated volume, and the capability to remove such volume from the pipeline. Some tariffs may also impose nomination verification limits in times of apportionment.
The NEB’s website contains a repository [Folder 90465] of each NEB-regulated pipeline’s current and historical tariffs. Table D.3 includes relevant links to current rules and regulations tariffs on select NEB crude oil pipelines. Pipeline companies typically also make their current tariffs available on their own websites.
Table D.3: Current Rules and Regulations Tariffs on Select NEB Crude Oil Pipelines
| Pipeline System | Current Rules and Regulations Tariff | All Tolls and Tariffs |
|---|---|---|
| Enbridge Mainline | NEB No. 438 [Document 3594634] | Link to page |
| Trans Mountain | NEB No. 105 [Document 3612563] | Link to page |
| Keystone | NEB No. 23 [Document 3013411] | Link to page |
| Express | NEB No. 150 [Document 3558634] (until 31 December 2018) |
Link to page |
Source: NEB
Description:
This table provides hyperlinks to the current Rules and Regulations tariffs for the Enbridge Mainline, Trans Mountain Pipeline, Keystone Pipeline, and Express Pipeline. The table also provides hyperlinks to specific folders in the NEB’s repository that contain an archive of each pipeline’s historical toll and tariff filings.
- Date modified: