ARCHIVED – Short-term Western Canadian Conventional, Tight, and Shale Oil Deliverability 2015-2017 - Energy Briefing Note
This page has been archived on the Web
Information identified as archived is provided for reference, research or recordkeeping purposes. It is not subject to the Government of Canada Web Standards and has not been altered or updated since it was archived. Please contact us to request a format other than those available.
Energy Briefing Note
Short-term Western Canadian Conventional, Tight, and Shale Oil Deliverability 2015-2017

October 2015
ISSN 1917-506X
Copyright/Permission to Reproduce
Table of Contents
List of Figures
| Figure 1 | Historical and Projected WTI Price |
| Figure 2 | Historical and Projected Western Canada Conventional, Tight and Shale Oil Deliverability |
| Figure 3 | Oil Drill Days |
| Figure 4 | Oil Wells Drilled |
| Figure 5 | Mid-Range Price Case Deliverability by Type of Oil |
| Figure 6 | Higher Price Case Conventional, Tight and Shale Oil Deliverability by Province |
| Figure 7 | Lower Price Case Conventional, Tight and Shale Oil Deliverability by Province |
List of Tables
| Table 1 | Pricing Overview and Deliverability Results |
| Table 2 | Mid-Range Price Case Summary and Results |
| Table 3 | Higher Price Case Summary and Results |
| Table 4 | Lower Price Case Summary and Results |
List of Acronyms and Abbreviations
| CO2 | Carbon dioxide |
| EIA | Energy Information Administration |
| EOR | Enhanced oil recovery |
| FID | Final investment decision |
| IP | Initial Production |
| LNG | Liquefied natural gas |
| MSW | Mixed Sweet Blend |
| NEB | National Energy Board |
| NGLs | Natural gas liquids |
| SAGD | Steam-assisted gravity drainage |
| WCS | Western Canadian Select |
| WCSB | Western Canada Sedimentary Basin |
| WTI | West Texas Intermediate |
List of Units and Conversion Factors
Units
| m³ | = cubic metres |
| bbl | = barrel |
| m³/d | = cubic metres per day |
| 10³m³/d | = thousand cubic metres per day |
| 106m³/d | = million cubic metres per day |
| bbl/d | = barrel per day |
| MMb/d | = million barrels per day |
Common Oil Conversion Factor
1.0 m³ = 6.2898108 bblFootnote 1
Price Notation
Quoted North American oil prices are the West Texas Intermediate (WTI) price at Cushing, Oklahoma, which is considered a benchmark of U.S. crude oil prices, and are given in $US/bbl in constant 2014 dollars. Canadian oil prices quoted are the Mixed Sweet Blend (MSW) price at Edmonton, Alberta (often reported as Edmonton Par) and the Western Canadian Select (WCS) price at Hardisty, Alberta. MSW is the conventionally produced light sweet crude benchmark for western Canada and WCS is the benchmark blended heavy oil for western Canada. Both are listed in $C/bbl. The Alberta Oil Price is a weighted average price of heavy and light oil with 60 per cent light MSW price and 40 per heavy WCS price. The average price is weighted like this because over the last decade about 60 per cent of conventional, tight, and shale oil production is light and the remainder heavy.
Foreword
The National Energy Board (NEB or Board) is an independent, federal, quasi-judicial regulator established to promote safety and security, environmental protection and economic efficiency within the mandate set by Parliament for the regulation of pipelines, energy development and trade. The Board's main responsibilities include regulating the construction, operation and abandonment of pipelines that cross international borders or provincial/territorial boundaries, as well as the associated pipeline tolls and tariffs, the construction and operation of international power lines, and designated interprovincial power lines and imports of natural gas and exports of crude oil, natural gas liquids (NGLs), natural gas, refined petroleum products and electricity.
For oil and natural gas exports, the Board’s role is to evaluate whether the oil and natural gas proposed to be exported is surplus to reasonably foreseeable Canadian requirements, having regard to the trends in the discovery of oil or gas in Canada.
If a party wishes to rely on material from this report in any regulatory proceeding before the Board, it may submit the material, just as it may submit any public document. Under these circumstances, the submitting party in effect adopts the material and could be required to answer questions pertaining to its content. This report does not provide an indication about whether any application will be approved or not. The Board will decide on specific applications based on the material in evidence before it at that time.
While preparing this report, in addition to conducting its own quantitative analysis, the NEB held informal meetings and discussions with various industry and government stakeholders. The NEB appreciates the information and comments provided and would like to thank all participants for their time and expertise.
Introduction
This is the first edition of the NEB’s Short-term Western Canada Conventional, Tight, and Shale Oil Deliverability report. Similar to the NEB’s annual Short-Term Canadian Natural Gas Deliverability report, which has over 10 editions, this report provides a three-year (including year of release) outlook on expected production levels. The oil deliverability projection includes light oil and heavy oil supply from British Columbia, Alberta, and Saskatchewan, and light oil supply from Manitoba. Oil deliverability in this report does not include oil sands bitumen or synthetic crude oil production, or oil production from other regions of CanadaFootnote 2.
Oil prices, capital expenditures, and well production are analysed and combined with expected resource development to project future oil deliverability from western Canada. Oil production and wells are split into categories by area, class, type, and groups of geological formations. The areas are based on PetrocubeFootnote 3 oil production areas for western Canada. The class of oil is either heavy or light. The type of oil is considered to be either conventional, tight, or shale. Further details on these categories, including formation groups, are included in Appendix A. This is the first time the NEB has provided historical or projected oil production arranged by these specific categories.
Due to their unique production profiles, wells that are part of thermal (steam injection) projects in conventional heavy oil pools, or carbon-dioxide flooding (CO2-EOR) projects are considered in separate analyses. Details are in Appendix C.
Overview and Summary
This report provides an outlook of western Canadian conventional, tight, and shale oil deliverabilityFootnote 4 from the beginning of 2015 to the end of 2017. The outlook presents three distinct cases: a Higher Price Case, Mid-Range Price Case, and a Lower Price Case, each of which are based on a set of assumptions.
The decline in oil prices since mid-2014 has reduced revenues and constrained the cash flows of western Canadian producers and caused significantly less oil drilling activity. Decreased capital expenditures by producers are expected to reduce total deliverability, but high-gradingFootnote 5 by producers in western Canada may improve overall deliverability on a per-well basis.
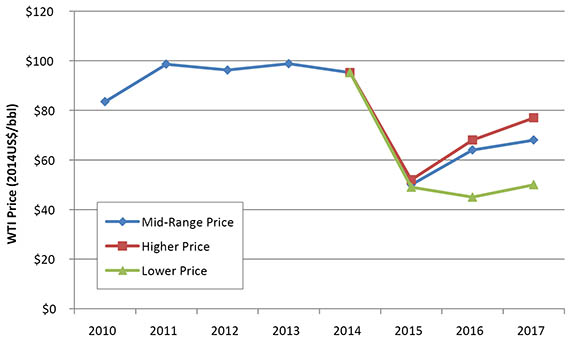
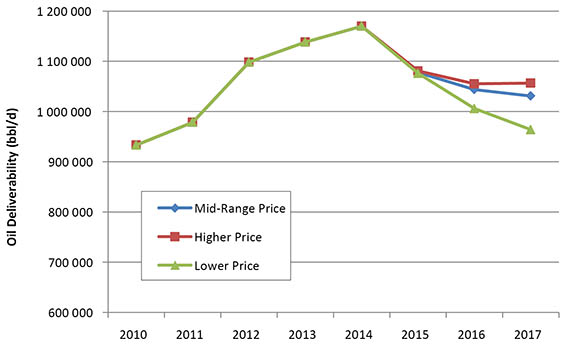
In the Mid-Range Price Case, WTI prices fall from $95.19/bblFootnote 6 in 2014 to $50.00/bbl in 2015, then rise to $68.00 in 2017. All WTI prices are quoted in constant 2014 dollars. Western Canadian oil deliverability declines over this period, from 186 10³m³/d (1.17 MMb/d) in 2014 to 164 10³m³/d (1.03 MMb/d) in 2017. The Higher Price Case sees oil prices at $77.00/bbl in 2017, resulting in more oil drilling with Canadian deliverability decreasing in 2015 and 2016 before slightly increasing in 2017 to 168 10³m³/d (1.06 MMb/d). In the Lower Price Case, oil prices remain fairly flat over the projection ranging between $45.00/bbl and $50.00/bbl, which is just over half the average price of oil in 2014. Oil drilling activity is the lowest in the Low Price Case and oil deliverability from new wells does not offset the declining oil production from existing wells and therefore total deliverability drops throughout the projection reaching 153 10³m³/d (0.96 MMb/d) in 2017. A comparison of the prices in each case can be found in Figure 1 and deliverability in each case in Figure 2.
Figure 1. Historical and Projected WTI Price
The Analysis and Outlook section of this report summarizes the assumptions and results for each price case. The Appendices contain a detailed description of the assumptions and methods used in projecting oil deliverability.
Background
Since 2009, the application of horizontal drilling and multi-stage hydraulic fracturing has dramatically increased the productivity of previously low-producing or unproductive oil reservoirs in the Western Canada Sedimentary Basin (WCSB) and in the United States. Surging U.S. oil production, in combination with growth in oil supply from Canada, Saudi Arabia, Iraq, and Russia, led to oversupplied markets in early 2014. The result is significantly lower crude oil prices in 2015 compared to oil prices in the first half of 2014.
Numerous technological advancements in drilling and production methods related to hydraulic fracturing have allowed WCSB operators to increase their reserves and add to known western Canadian resources. Additions to crude oil reserves in conventional oil reservoirs has also been achieved through the application of a number of different enhanced oil recovery (EOR) techniques such as water, polymer, alkaline, or CO2 flooding, and thermal methods such as the application of steam-assisted gravity drainage (SAGD) in conventional heavy oil reservoirs. Several projects in western Canada, existing and proposed, are designed to capture CO2 and distribute it to oil pools to enhance oil recovery. There are currently two such projects in operation in Saskatchewan, and one in Alberta. Ten thermal and three CO2 flooding projects are included in the analysis. More details can be found in Appendix A1.1.5.
Western Canada’s combined conventional, tight, and shale oil production has increased since 2010 and oil production in the U.S. has increased since 2008Footnote 7, largely because of oil prices that averaged in the $90.00/bbl range from 2011 to 2014, and because of technological advancements. Oil production in the U.S. averaged 1 386.2 10³m³/d (8.72 MMb/d) in 2014, an increase of 17 per cent from 2013 and an increase of 55 per cent from 2011. This increase in production helped keep global oil production high, which, along with other geopolitical factors, has led to significantly lower oil prices since mid-2014.
Between 2002 and 2007, the overall average initial productivity (IP) of oil wells drilled in Western Canada decreased as conventional resources matured, however the trend reversed upward from 2008 to 2014. It is expected to continue increasing over the projection period as the more productive conventional and tight wells represent a growing share of the wells drilled in a year. Details are in Appendix A2.
Lower oil prices and revenues have led to decreased capital expenditures, which has reduced drilling and service activity as companies work within available cash flows. When producers are cash-strapped, development is focused on the most economic prospects in an attempt to reduce costs. The outcome of these measures is not only lower costs for extracting oil, but improved overall operational efficiencies and higher levels of production per well.
Lower prices for both crude oil and natural gas have also affected the credit ratings of small and mid-size producers, making it more difficult for them to obtain financing. The lack of easy access to capital could make it difficult for some small and mid-size producers to sustain their operations, creating the potential for bankruptcies or acquisitions by more financially stable companies.
Analysis and Outlook
Average annual oil drilling activity in Canada was steady from 2013 to 2014. However, as oil prices started deceasing in mid-2014, oil drilling activity started to decline and is expected to remain at lower levels throughout the projection period.
Three price cases for western Canadian oil deliverability are examined in this report, with the individual price tracks based on various energy forecasts and the forward oil price stripFootnote 8. However, the projected outcomes in the three cases differ in terms of oil prices with resulting differences in the levels of capital investment. Table 1 and the Appendices contain a detailed description of the assumptions used for projecting deliverability.
In all three price cases, combined drilling and investment in western Canadian conventional, tight and shale oil is projected to decrease significantly relative to 2014. The cases differ more in 2016 and 2017 based on the diverging price assumptions.
Drilling days are driven by capital expenditures, which are a function of production and price. Prices increase in the Mid-Range Price Case and Higher Price case, but the number of drilling days don’t rise as quickly because lower production from the prior year resulted in lower revenues, thus less money for future capital expenditures.
A summary of the key assumptions used in the cases, along with the deliverability results are shown in Table 1.
Table 1 - Pricing Overview and Deliverability Results
| Mid-Range Price | Higher Price | Lower Price | ||||||||
|---|---|---|---|---|---|---|---|---|---|---|
| 2014 | 2015 | 2016 | 2017 | 2015 | 2016 | 2017 | 2015 | 2016 | 2017 | |
| 2014 WTI (US$/bbl) | 95.19 | 50.00 | 64.00 | 68.00 | 52.00 | 68.00 | 77.00 | 49.00 | 45.00 | 50.00 |
| 2014 AB Oil Price (C$/bbl) | 93.13 | 53.08 | 71.27 | 74.12 | 55.06 | 74.12 | 80.52 | 52.24 | 50.47 | 57.50 |
| 2014 MSW Price (C$/bbl) | 100.53 | 55.13 | 75.00 | 78.21 | 57.32 | 78.21 | 85.37 | 54.19 | 52.05 | 59.72 |
| WCS Price (C$/bbl) | 82.04 | 50.00 | 65.68 | 68.00 | 51.67 | 68.00 | 73.24 | 49.32 | 48.08 | 54.17 |
| Exchange Rate (US/Cdn) | 0.91 | 0.78 | 0.76 | 0.78 | 0.79 | 0.78 | 0.82 | 0.78 | 0.73 | 0.72 |
| Oil Drilling Expense (C$ Million) |
19 151 | 6 553 | 8 418 | 8 674 | 6 837 | 8 905 | 9 800 | 6 390 | 5 655 | 6 236 |
| Oil Drill Days | 50 619 | 20 755 | 22 064 | 19 969 | 21 752 | 23 700 | 23 248 | 20 176 | 15 508 | 15 819 |
| Oil Wells | 5 941 | 2 463 | 2 560 | 2 399 | 2 575 | 2 743 | 2 767 | 2 345 | 1 783 | 1 844 |
| Western Canadian Conventional, Tight, and Shale Oil Deliverability (m³/d) |
185 992 | 171 343 | 165 931 | 163 925 | 171 832 | 167 748 | 167 988 | 171 065 | 159 928 | 153 250 |
| Western Canadian Conventional, Tight, and Shale Oil Deliverability (bbl/d) |
1 169 856 | 1 077 718 | 1 043 675 | 1 031 056 | 1 080 788 | 1 055 105 | 1 056 610 | 1 075 965 | 1 005 920 | 963 911 |
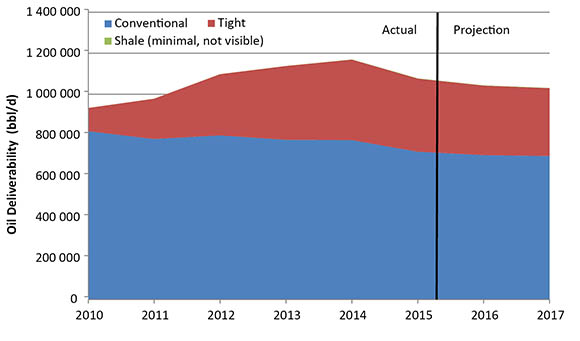
Figure 2. Historical and Projected Western Canada Conventional, Tight and Shale Oil Deliverability
For this analysis, the Board divides oil production in western Canada into heavy and light classes, and further subdivides into conventional, tight, and shale oil types. Because of large regional variation in production characteristics, the categories are also sub-divided into smaller geographic areas, or regions, which have similar production decline characteristics. Within each region, the producing formations are grouped based on their geological characteristics. Details on the oil categorizations are in Appendix A.
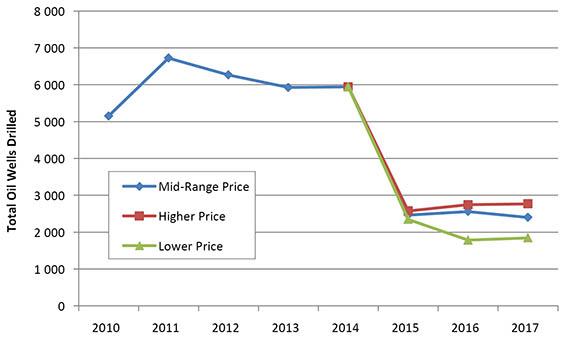
These deliverability outcomes arise from differing levels of drilling activity that are a consequence of variations in capital investment between the three cases. Comparisons of oil drilling activity in terms of drill days and oil wells drilled, are shown in Figure 3 and Figure 4, respectively.
Figure 3. Oil Drill Days
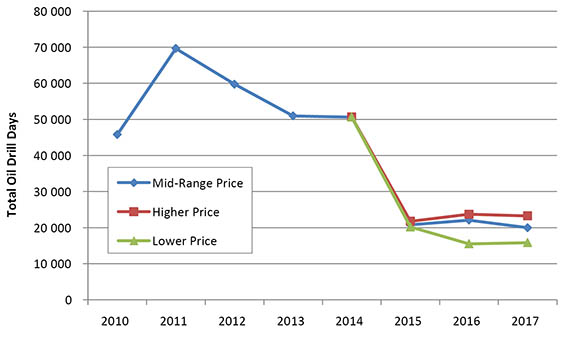
Figure 4. Oil Wells Drilled
Mid-Range Price Case
This case reflects and maintains current trends over the projection period. Prices in 2016 and 2017 are higher, consistent to keep production from dropping below balanced levels.
The Mid-Range Price Case outlines a decline in deliverability (Table 2) over the projection period, with the decline slowing down in 2017 as prices rise and oil activity continues to focus on higher productivity wells. In 2010, tight oil production was 12 per cent of western Canadian conventional, tight, and shale oil production. As technology changed and focus on tight resources grew, that portion increased to a third of production in 2014 and remains at a third over the projection. In 2009 there were 869 tight oil wells drilled and, in 2014, there were 3 421 tight oil wells drilled. Between now and 2017, the Mid-Range Case projects tight oil wells will account for half of the oil wells drilled in western Canada. A summary of the Mid-Range Price Case is available in Table 2 and Figure 5. Detailed well and production projections including thermal projects are included in Appendix C.
Table 2. Mid-Range Price Case Summary and Results
| AB Oil Price (C$/bbl) | Oil Drill Days | Oil Wells | Western Canada Conventional, Tight, and Shale Oil Deliverability (m³/d) |
Western Canada Conventional, Tight, and Shale Oil Deliverability (bbl/d) |
|
|---|---|---|---|---|---|
| 2014 | 93.13 | 50 619 | 5 941 | 185 992 | 1 169 856 |
| 2015 | 53.08 | 20 755 | 2 463 | 171 343 | 1 077 718 |
| 2016 | 71.27 | 22 064 | 2 560 | 165 931 | 1 043 675 |
| 2017 | 74.12 | 19 969 | 2 399 | 163 925 | 1 031 056 |
Figure 5. Mid-Range Price Case Deliverability by Type of OilFootnote 9
Higher Price Case
The Higher Price Case projects higher global oil prices over the projection period than the Mid-Range Price Case, leading to more drilling activity and production. Deliverability declines in 2015 and 2016 but starts to increase slightly by 2017, as shown in Table 3. Higher prices and resultant revenues eventually drive capital spending and activity high enough to slightly boost production from new wells above the decline in production from existing wells.
Table 3. Higher Price Case Summary and Results
| AB Oil Price (C$/bbl) | Oil Drill Days | Oil Wells | Western Canada Conventional, Tight, and Shale Oil Deliverability (m³/d) |
Western Canada Conventional, Tight, and Shale Oil Deliverability (bbl/d) |
|
|---|---|---|---|---|---|
| 2014 | 93.13 | 50 619 | 5 941 | 185 992 | 1 169 856 |
| 2015 | 55.06 | 21 752 | 2 575 | 171 832 | 1 080 788 |
| 2016 | 74.12 | 23 700 | 2 743 | 167 748 | 1 055 105 |
| 2017 | 80.52 | 23 248 | 2 767 | 167 988 | 1 056 610 |
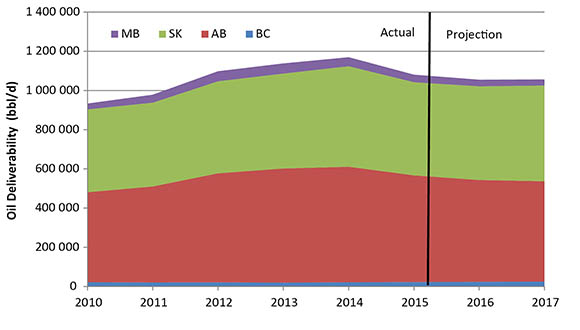
The share of total production from each province remains fairly constant over the projection (Figure 6), with a slight increase in Saskatchewan and a slight decrease in Alberta. In 2014, Alberta made up 50 per cent of production and Saskatchewan 44 per cent. In 2017, Alberta drops to 48 per cent and Saskatchewan increases to 46 per cent. This change is driven by production growth in thermal projects in Saskatchewan, which are projected to increase from 8 028 m³/d (50 500 bbl/d) in 2014 to 11 924 m³/d (75 000 bbl/d) in 2017. Detailed provincial production projections are included in Appendix C.
Figure 6. Higher Price Case Conventional, Tight and Shale Oil Deliverability by Province
Lower Price Case
In the Lower Price Case, global demand growth for crude oil remains weak and/or global oil production growth remains strong, keeping WTI prices from rising above $50.00/bbl over the projection (Table 4). It is projected that Canadian producers will have difficulty obtaining debt financing while private equity investment is minimal over the projection.
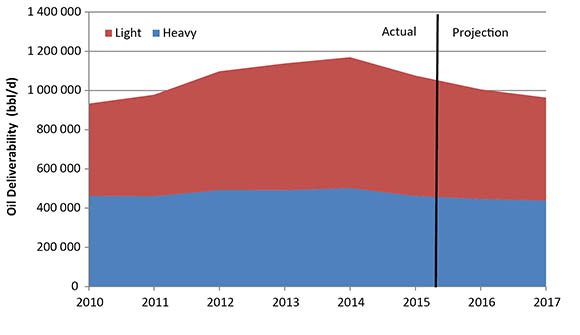
Western Canadian oil deliverability decreases over the projection, however the proportion of heavy oil production increases from 43 per cent in 2014 to 46 per cent in 2017 as heavy oil production from thermal projects continues to grow, as seen in Figure 7. Thermal developments have long production lifespans and low sustaining capital costs and are still viable in a low oil price environment; however, thermal development momentum is lower in the Low Price Case compared to the other two price cases. Details are available in Appendix C.
Table 4. Lower Price Case Summary and Results
| AB Oil Price (C$/bbl) | Oil Drill Days | Oil Wells | Western Canada Conventional, Tight, and Shale Oil Deliverability (m³/d) |
Western Canada Conventional, Tight, and Shale Oil Deliverability (bbl/d) |
|
|---|---|---|---|---|---|
| 2014 | 93.13 | 50 619 | 5 941 | 185 992 | 1 169 856 |
| 2015 | 52.24 | 20 176 | 2 345 | 171 065 | 1 075 965 |
| 2016 | 50.47 | 15 508 | 1 783 | 159 928 | 1 005 920 |
| 2017 | 57.50 | 15 819 | 1 844 | 153 250 | 963 911 |
Figure 7. Lower Price Case Deliverability by Class of Oil
Key Uncertainties
Developments that could influence future western Canadian conventional, tight, and shale oil deliverability include:
- Crude oil prices: the three price cases in this analysis represent a reasonable range of potential outcomes, but may not capture all potential future price paths.
- Exchange rates: oil exporters are paid in U.S. dollars, while most expenses are incurred in Canadian dollars; therefore, a volatile exchange rate could lead to added uncertainty in predicting economic returns for Canadian producers.
- Issues related to multi-stage hydraulic fracturing: it is possible that additional rules and regulations may affect the pace and extent of conventional, tight, and shale oil production.
- Operating costs: lower oil prices have led to significant reductions in development and operating costs as lower activity has led to less demand for labour, materials, and equipment. The extent to which costs might stabilize, increase, or continue to decline is a major uncertainty.
- Technological advancements, efficiency gains, and improved data analytics in drilling and hydraulic fracturing operations: these have significantly affected the volumes of oil that can be produced and the occurrence and timing of further enhancements is a key uncertainty in these projections.
- Acquisition and consolidation of smaller North American producers by larger companies: this could result in improved funding and economies of scale in supply chains to reduce costs.
Appendices
- List of Figures
- List of Tables
- List of Acronyms
- List of Units and Conversion Factors
- Appendix A
- A1 Methods (Detailed Description)
- A2 Deliverability Parameters - Results
- A3 Decline Parameters for Groupings of Existing Oil Wells
- A4 Decline Parameters for Oil Wells
- Appendix B
- B1 Allocation of Oil Drill Days by Area
- B2 Oil Wells Projections by Case
- B3 Oil Wells Projections by Type by Cas
- Appendix C
- C1 Deliverability Details by Case (bbl/d)
- Date modified: