ARCHIVED – Chapter 2. Key Assumptions
This page has been archived on the Web
Information identified as archived is provided for reference, research or recordkeeping purposes. It is not subject to the Government of Canada Web Standards and has not been altered or updated since it was archived. Please contact us to request a format other than those available.
This chapter describes the key assumptions underpinning this analysis.
Key Assumptions
- Three key assumptions underpin the analysis in EF2017:
- Over the long term, all energy production will find markets and infrastructure will be built as needed.
- Environmental and socio-economic considerations beyond the included policies and programs are outside the scope of the analysis.
- EF2017 includes many recently announced climate policies. The following criteria were applied to determine whether a certain policy was included in EF2017:
- The policy was publically announced prior to 1 January 2017.
- Sufficient detail exists to credibly model a policy, or reasonable assumptions can be made about the details of a policy.
- Goals and targets, including Canada’s international climate targets, are not explicitly modelled. Rather, policies that are announced, and in place, to address those targets are included in the modeling.
- Table A.1, found at the end of this document, describes many recent climate policy developments and indicates whether that policy is included in the EF2017 analysis.
Carbon Price Assumptions
Climate Policy Developments
- Climate policy in Canada has evolved rapidly since late 2015. The federal government and many provincial governments made major policy announcements throughout 2016.
- Several climate policies were announced by the federal government in the fall of 2016, including:
- Many provincial governments across Canada also announced policies and action plans related to climate change since late 2015.
- Federal and provincial climate policies and action plans are at various stages of development and implementation. Some announced policies, such as Alberta’s carbon levy on end-use emissions and Ontario’s cap-and-trade system, had already been implemented at the time of analysis. In other cases, legislation and regulations are being drafted, or proposals are in the development and consultation phase.
Carbon Pricing as a Climate Policy Tool
- In December 2016, the federal government released the Pan-Canadian Framework on Clean Growth and Climate Change (Pan-Canadian Framework). This outlines Canada’s actions that will contribute to meeting or exceeding its 2030 climate change target of a 30% reduction below 2005 greenhouse gas (GHG) emission levels. The implementation of carbon pricing is a key pillar of the Pan-Canadian Framework.
- Several provinces have already implemented carbon pricing: Alberta introduced an intensity-based carbon price for large emitters in 2007, British Columbia (B.C.) began taxing carbon in 2008 and Quebec’s cap-and-trade program came into effect in 2013. Alberta, through a carbon levy, and Ontario, through a cap-and-trade program, began widespread pricing of carbon in January 2017.
- In general, carbon pricing mechanisms add a per-unit-fee to fuels that release GHG emissions when consumed. The fee is proportional to the GHG emissions released by that fuel. Table 2.1 demonstrates how different carbon prices impact the price of different fuels.
Table 2.1 - Example Carbon Prices of Various Fuels in Energy Equivalent and Volumetric Terms
| Carbon Price | $30/tonne | $50/tonne | $90/tonne | $140/tonne | ||||
|---|---|---|---|---|---|---|---|---|
| Energy | Volume | Energy | Volume | Energy | Volume | Energy | Volume | |
| Natural Gas | 1.50 $/GJ | $1.58/Mcf | 2.49 $/GJ | $2.63/Mcf | 4.49 $/GJ | $4.74/Mcf | 6.98 $/GJ | $7.38/Mcf |
| Gasoline | 2.06 $/GJ | 7.1¢/L | 3.43 $/GJ | 11.9¢/L | 6.17 $/GJ | 21.4¢/L | 9.59 $/GJ | 33.2¢/L |
| Diesel | 2.22 $/GJ | 8.6¢/L | 3.70 $/GJ | 14.3¢/L | 6.67 $/GJ | 25.8¢/L | 10.37 $/GJ | 40.1¢/L |
- Carbon pricing can have several outcomes:
- Pricing carbon raises the price of fuels that emit GHGs, causing a decrease in the use of those fuels. When carbon is priced, energy users more accurately account for the cost of releasing GHGs into the atmosphere in their decision making.
- Pricing carbon alters the relative prices of various fuels to better reflect their GHG content. As a result, low or no emitting fuels become more attractive when carbon is priced than if it were not. For example, the carbon price per unit of energy for natural gas is lower than for gasoline, reflecting the lower carbon content of natural gas, as shown in Table 2.1.
- A price on carbon can be a driver of innovation and investment in GHG-emission reducing technologies. Creating an economic incentive for consumers and businesses to reduce their carbon costs strengthens the market for products and services that help reduce GHG emissions.
- Carbon pricing can be a source of revenue for governments. Revenues can be used for program spending, including support for the development of carbon-reducing technologies, or rebates to consumers. Carbon pricing revenue can also be used to offset other types of taxes, such as personal or corporate income taxes.
- Economists generally consider carbon pricing to be an economically efficient means of reducing GHG emissions. Economic theory suggests that energy producers, transporters, and consumers who can reduce their GHG emissions at a cost less than the carbon tax will choose to do so.
Carbon Pricing Mechanisms
- Carbon pricing schemes usually fall into two main categories: a carbon tax or a cap-and-trade system:
- Under a carbon tax, a jurisdiction sets a price on carbon emissions consistent with its policy objectives, with a higher price translating into greater expected emission reductions.
- In a cap-and-trade system, a government sets a cap on the maximum allowable GHG emissions and then sets the number of emission permits available equal to that cap. Market participants must hold permits equal to the amount of GHGs they emit over a given period. Through trading between many participants, market forces determine an economy-wide price for GHG emissions.
- Carbon pricing policies can have drawbacks, some of which can be dealt with through effective policy design:
- Carbon pricing can have economic impacts, especially for industrial sectors that are emissions-intensive and face competition in other jurisdictions. If one jurisdiction introduces a carbon price, trade-exposed industries may shift their operations to a region with less stringent carbon policies, resulting in no net reduction in global GHG emissions. This is often referred to as “carbon leakage” and is usually addressed by offering free emission permits to these types of industries. Wider adoption of climate policies around the world could also reduce this effect by removing the option for industries to move to another region in order to reduce carbon costs.
- A price on carbon can be regressive, meaning it could have a disproportionately negative impact on lower income individuals. The use of carbon price revenues to provide targeted rebates or other tax cuts can offset this impact.
- Some types of GHG emissions, such as methane emissions from agriculture or oil and natural gas operations, are difficult to measure, making them difficult to price. Other policy tools such as technology standards are often a more effective tool to address these types of emissions.
- For an in-depth discussion of carbon pricing in a Canadian context, the Working Group on Carbon Pricing Mechanisms established by Canada’s First Minsters in the Vancouver Declaration released a detailed final report on carbon pricing mechanisms in the fall of 2016.
The Federal Carbon Pricing Plan in EF2017
- The Government of Canada announced the pan-Canadian carbon pollution pricing benchmark in October 2016 to ensure that carbon pricing applies to a broad set of emission sources throughout Canada in 2018 with increasing stringency over time. The benchmark provides provinces and territories with flexibility to implement their own carbon pollution pricing systems—either an explicit price-based system (a carbon tax such as the one in British Columbia, or a carbon levy and an output-based pricing system, such as in Alberta) or a cap-and-trade system (such as those in Quebec and Ontario). In the benchmark, the federal government also committed to implement a federal carbon pricing backstop system that will apply in any province or territory that does not have a carbon pricing system in place by 2018 that aligns with the benchmark. The Government of Canada released a discussion paper in May 2017 outlining the proposed federal carbon pollution pricing backstop system. It is composed of two key elements:
- A carbon levy applied to fossil fuels starting at $10 per tonne of GHG emissions in 2018, rising $10 per year to $50 per tonne in 2022, and
- An output-based pricing system for industrial facilities that emit above a certain threshold, with an opt-in capability for smaller facilities with emissions below the threshold. By pricing a portion of emissions and enabling emissions trading, this component incents innovation and emissions reductions but mitigates adverse impacts on competitiveness.
- EF 2017 makes several simplifying assumptions on future carbon pricing in Canada. The actual implementation of the pan-Canadian approach could lead to different impacts on Canada’s energy system than shown here. This report should not be taken as an official or definitive impact analysis of this initiative.
- All cases in EF 2017 assume that the minimum price for carbon pollution in Canada varies from $10/tonne of CO2 equivalent (CO2e) starting in 2018 to $50/tonne in 2022. In the Reference Case, the price for carbon is held at $50/tonne in nominal terms from 2022 to 2040.
- The Federal Government stated that the Pan-Canadian approach for pricing carbon pollution will be reviewed in 2022 to confirm the path forward. Following this review, the minimum price for carbon could change, particularly if other jurisdictions around the world take similar actions. The HCP Case explores the impact on the Canadian energy system of higher carbon pricing than in the Reference Case over the long term. This sensitivity analysis is not a recommendation or endorsement by the NEB of a certain policy direction.
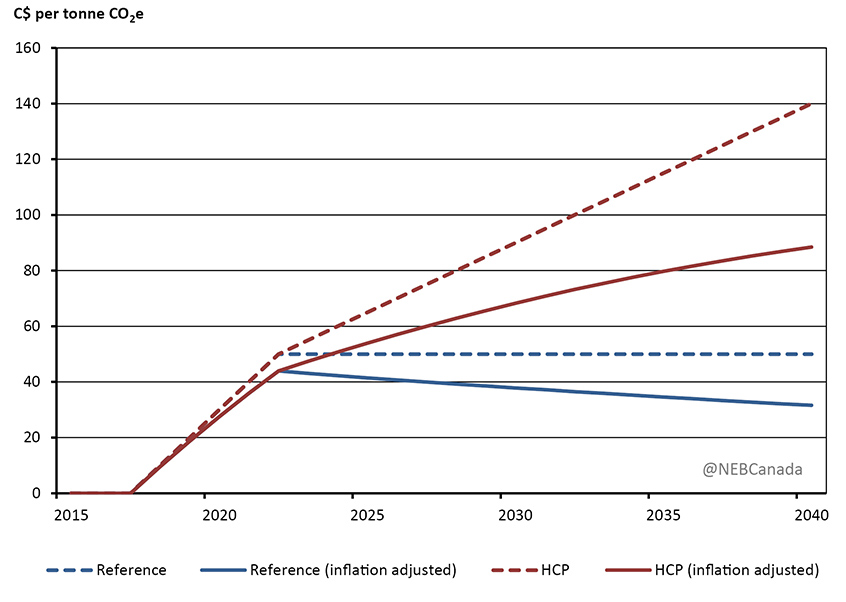
- The HCP Case assumes that the price for carbon increases steadily after 2022. As shown in Figure 2.1, the minimum price continues to increase at $5/tonne per year after 2022, reaching $90/tonne in 2030 and $140/tonne by 2040 in nominal terms. In constant 2016 dollar terms, the carbon price in the HCP Case reaches $68/tonne in 2030 and $88/tonne by 2040.
Figure 2.1 - Federal Carbon Price Floor, Reference and HCP Cases
Description
This graph compares the difference between C$ per tonne CO2e in the Reference Case and the HCP Case for both unadjusted and inflation adjusted values. The Reference Case and HCP Case prices increase together until 2022 when they hit $50.00. After this the unadjusted Reference Case price remains constant at $50.00 until 2040, while the HCP increases to $140.00 in 2040. The adjusted values also line up until 2022 when they hit $43.98. The inflation adjusted price in 2040 in the Reference Case decreases to $31.58. The inflation adjusted value in the HCP Case in 2040 increases to $88.47.
- Some provinces already are part of, or may join, cap-and-trade systems for carbon pricing. In these systems the future price of carbon will be determined by the supply and demand for emission permits. The outlook for this market price will be uncertain, similar to other market prices such as crude oil and natural gas. Like crude oil and natural gas prices, EF 2017 makes simplifying assumptions for the future outlook of carbon pricing. The Reference and HCP cases assume that the price for carbon is equal across all jurisdictions after 2022, including those with cap-and-trade systems.
- Implementing a carbon price that is significantly higher than in other countries can impact the competitiveness of some Canadian industries. Carbon pricing policies can be designed to offset this to an extent. Existing carbon pricing plans in various provinces have some measures in place to mitigate carbon leakage. However, carbon prices well above those in other countries could still have competiveness impacts.
- The proposed approach for the federal carbon pricing ‘backstop’ system also includes an element to minimize competitiveness and carbon leakage risks, particularly for emissions intensive and trade exposed industries. This system provides an allowable level of emissions for large emitters, and facilities pay for the emissions above that level or receive credits for their emissions below it. This system reduces the average carbon cost for these facilities, but maintains the incentive for emission reductions. In this analysis, emitters face the full carbon price at an end-user level to capture the price incentive effect, while the impact of the output based allocations in reducing the income effects of the carbon prices is captured in the industrial macroeconomic projections.
- The HCP Case assumes that other countries also increase the strength of their climate policies over time. Given the competitiveness impacts of higher carbon pricing, it is more likely that Canada would increase its carbon price if other nations do so as well. Action on climate in developed countries increases at a similar pace as in Canada. Developing nations increase the strength of their climate policies more gradually over the projection period. This assumption also simplifies the analysis by eliminating concerns related to carbon leakage.
- This sensitivity case is not meant to replicate scenario analysis that explores the global energy transition required to keep a global temperature rise to below 2 degrees Celsius, such as the International Energy Agency’s World Energy Outlook 450 Scenario. Nor is it a scenario designed with Canada’s international climate targets as the ultimate objective.
- The energy supply and demand results of the Reference and HCP cases are discussed in Chapter 3: Reference and HCP Case Results.
Technology Case Assumptions
- Technology’s influence on the energy system can be substantial. Which emerging technologies achieve widespread use is often difficult to predict. Likewise, the nature of future breakthroughs is unknown. The adoption rate of emerging technologies is a key uncertainty to the projections in EF2017.
- Governments in Canada and around the world have emphasized technological innovation as a key component to their plans to reduce GHG emissions. A pillar of the Pan-Canadian Framework is Clean Technology, Innovation and Jobs. In addition, Canada is participating in Mission Innovation, a global initiative, including 22 countries and the European Union, to accelerate global clean energy innovation. Through its participation in Mission Innovation, Canada aims to, among other things, double federal investment in clean energy research and development from 2015 to 2020.
- Several provincial governments have programs to encourage innovation in energy technology. Examples include SaskPower, Institut de recherche d’Hydro-Québec, Ontario Centres of Excellence, and Emissions Reduction Alberta. Some of these programs are funded from revenue generated by carbon pricing initiatives.
- Adoption of new technologies can be encouraged by climate policies, such as carbon pricing or other options, which improve the competitiveness of low or non-emitting technologies. Alternatively, a technology can sometimes become more popular when public or private sector research and development results in a lower emission technology that is equivalent, or better, than existing technology for reasons such as cost, convenience, quality, or societal factors.
- The Technology Case considers the impact of greater use of a selection of emerging energy technologies on the energy system. It builds upon the underlying assumptions of the HCP Case, including the long-term increases in carbon pricing shown in Figure 2.1.
- The Technology Case assumes:
- Greater cost decreases for solar and wind electricity generating technology over the projection period.
- Greater interprovincial electricity trade and modest penetration of grid-scale battery storage technologies.
- Faster uptake of electric vehicles (EVs) in the passenger transportation sector.
- Adoption of steam-solvent technology in the oil sands sector.
- Greater electrification of space and water heating in the residential and commercial sectors.
- Increasing use of carbon capture and storage (CCS) technology for coal-fired electricity generation.
- These technologies are a selection of the wide array of emerging technologies that have the potential to increase their market share over the projection period. They are chosen to illustrate how technological development may impact energy supply and demand trends in various sectors of the economy. It is unclear which technologies will gain wider adoption in the future; these technologies provide an example among many potential outcomes. This sensitivity analysis is not a prediction or recommendation of certain technologies.
- The energy supply and demand results of the Technology Case are discussed in Chapter 4: Technology Case Results.
Crude Oil and Natural Gas Prices
Crude Oil
- Crude oil prices are a key driver of the Canadian energy system and are determined by global supply and demand factors. Canada is a major crude oil producer and prices are an important driver of future production growth. The prices of refined petroleum products (RPPs), such as gasoline and diesel, are closely related to crude oil prices and can influence energy use trends.
- From 2011 to mid-2014, global crude oil prices were stable near US$100 per barrel (bbl). Prices dropped steadily starting in mid-2014, with the Brent crude oil price falling to less than US$30/bbl in January 2016. The price increased through the spring of 2016 and stabilized near US$50/bbl through the rest of 2016 and into 2017.
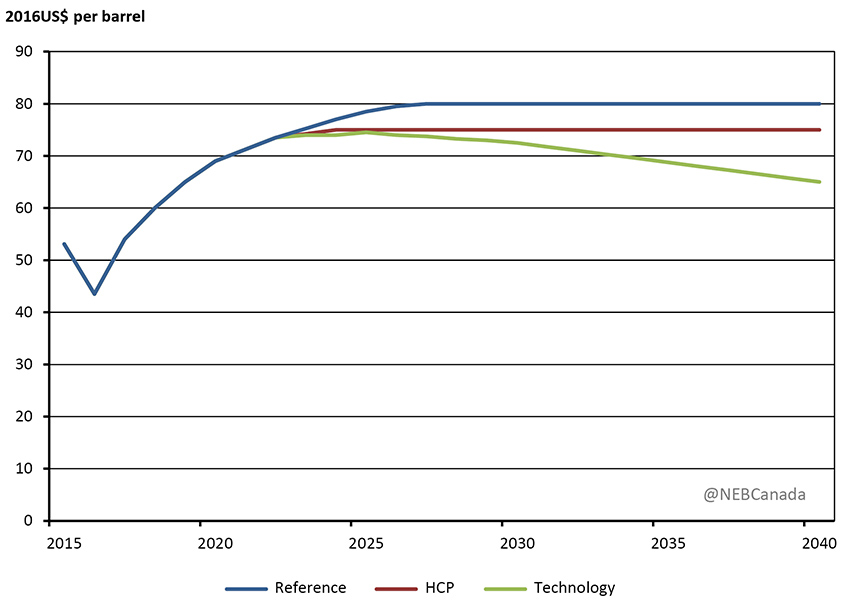
- Figure 2.2 depicts the Brent crude oil price assumptions in EF2017. The Reference Case price, in constant 2016 dollar terms, reaches US$80/bbl by 2027, and stays at that level through the remainder of the projection period. Investment in new crude oil production capacity has declined in recent years due to low oil prices. As a result, prices increase early in the projection period as higher prices help to bring on additional production to balance supply and demand. After 2027, the Brent crude oil price stays at US$80/bbl reflecting the potential for crude oil demand growth to flatten or begin declining.
Figure 2.2 - Brent Crude Oil Price, All Cases
Description
This graph shows Brent Crude Oil prices in 2016 US$ per barrel based on the three cases in EF2017. In all three cases prices increase to 2022 where they hit $71.25/bbl. Prices in the Reference Case then increase until they hit $80.00/barrel in 2027 and remain constant until 2040. In the HCP Case oil prices increase to $75.00/barrel in 2024 then remain constant until 2040. In the Technology Case prices increase until they reach $74.50/barrel in 2025 then they continually fall to $65.00/barrel in 2040.
- As shown in Figure 2.2, the Brent crude oil price is lower in the HCP and Technology cases. In both cases, the Brent crude oil price follows the trajectory of the Reference Case until 2022. Thereafter, the prices diverge, with prices in the HCP Case reaching US$75/bbl in constant 2016 dollar terms. The Technology Case assumes that the Brent price begins to slowly decline, reaching US$65/bbl in 2040, US$15/bbl lower than in the Reference Case.
- The HCP Case assumes greater global climate action relative to the Reference Case. This implies lower demand for GHG emission-intensive goods, including RPPs, and crude oil. Similarly, in the Technology Case, greater global adoption of technologies like EVs implies lower demand for crude oil compared to the Reference Case.
- Lower price assumptions in the HCP and Technology cases highlights that stronger global climate action or greater adoption of low carbon technologies could reduce the market for crude oil compared to the Reference Case. For energy consumers, lower crude oil prices would reduce the costs for RPPs like gasoline and diesel but higher carbon prices more than offset this, resulting in higher end-use prices for those fuels.
- The ultimate impact of greater global climate action, or greater technology adoption, on crude oil prices is highly uncertain. The differences in crude oil prices between the cases could depend on future climate policies, the evolution of crude oil supply costs around the world, and the availability of alternative technologies.
- The difference between the cases in EF2017 is not an assessment of the impact of greater climate action on crude oil prices but is an assumption with which to build broad and plausible scenarios.
Natural Gas
- Natural gas prices have declined considerably over the past decade. Henry Hub prices fell from the US$6-9 per million British thermal units (MMBtu) range between 2006 and 2008 to less than US$4/MMBtu for the majority of the last five years. In the first half of 2016, Henry Hub prices were as low as US$2/MMBtu and averaged closer to US$3/MMBtu in the second half of 2016 and into 2017.
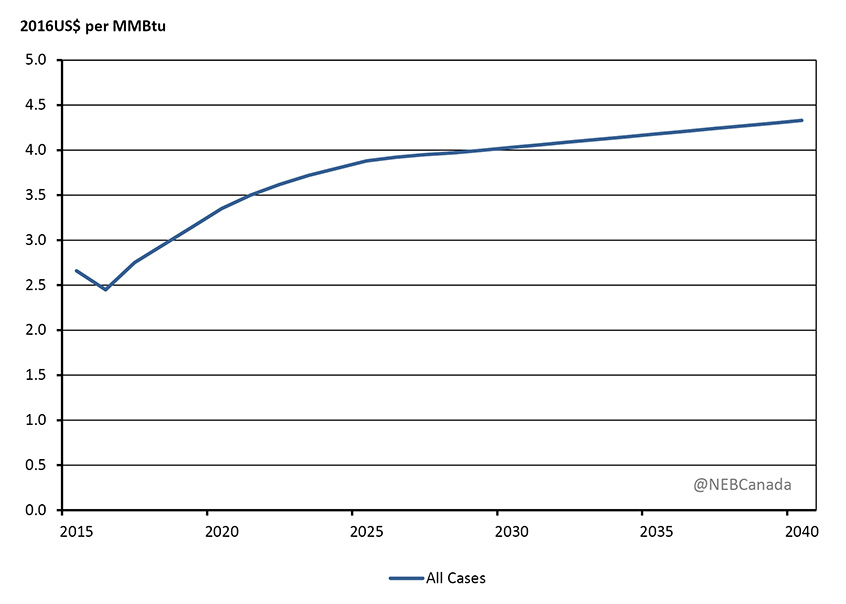
- Figure 2.3 shows the Henry Hub natural gas price assumptions of EF2017. The price in all three cases, in constant 2016 dollar terms, increases from US$2.45/MMBtu in 2016 to US$4.30/MMBtu in 2040.
Figure 2.3 - Henry Hub Natural Gas Price, All Cases
Description
This chart shows Henry Hub natural gas prices for all the cases in EF2017. From a low of $2.45 (2016US$ per MMBtu) in 2016 prices continually rise to 2040 where they reach $4.33.
- Natural gas is less GHG-intensive than other fossil fuels. Under the assumptions of the HCP and Technology Cases, it is unclear whether natural gas demand would increase or decrease in response to the assumptions in those cases. Power producers in North America may choose to replace coal-fired generation with natural gas to reduce emissions and service higher electricity demand. Similarly, a global shift towards natural gas could increase demand for LNG exports from North America, which could increase natural gas prices. On the other hand, stronger climate policy and technology adoption could reduce demand for all fossil fuels, including natural gas. Given this uncertainty, the Henry Hub price assumptions in all three cases are the same.
- Date modified: