ARCHIVED – Canada’s Energy Future 2017 Supplement: Oil Sands Production – Appendix
This page has been archived on the Web
Information identified as archived is provided for reference, research or recordkeeping purposes. It is not subject to the Government of Canada Web Standards and has not been altered or updated since it was archived. Please contact us to request a format other than those available.
Canada’s Energy Future 2017 Supplement: Oil Sands Production [PDF 3109 KB]
Appendix Data and Figures [EXCEL 4911 KB]
January 2018
Copyright/Permission to Reproduce
ISSN 2369-1479
Table of Contents
Appendix A
Projecting Oil Sands Production: Methods
Oil sands production is projected by applying utilization rates to the capacities of 1) existing oil sands projects, and 2) a timeline of new projects and expansion phases expected to be built in the future. Projections do not consider changes to production from weather, equipment failure, or other potential interruptions. Raw bitumen production and synthetic crude oil production are projected for each case.
The main differences between the cases are oil prices, carbon taxes, and technology assumptions. Varying oil prices affect industry revenues, and the reinvestment of a portion of the revenue as capital expenditures. Varying carbon taxes affect the net revenue available: the higher the carbon taxes, the higher the cost of production and the lower the net revenue. Technological advancements affect both bitumen production as well as the steam to oil ratio (SOR). These variations do not affect all oil sands projects uniformly. For instance, the better a project’s SOR, the less impact rising carbon taxes have. This results in an emissions credit for some projects in some years. More details about how emissions are calculated are provided in Section A4.4.
Mining and in situ production are estimated using the same method. Projects are assessed based on their announced capacities and start dates and then risked in terms of start time. Production from all projects of each type (i.e. mining, in situ) is then aggregated. Production from projects that are currently operating is held relatively constant for the majority of the projection. In some cases, depending on the age of the facility, production is decreased towards the end of the projection period. Increases in production for any given project are largely the result of new phases coming online and, to a lesser extent, process improvements in the early years of that project or phase. These methods significantly differ from conventional oil projections, which are well-based and use decline-curve analysis.
Details on oil sands producing areas are in Appendix A1.1. How production is determined is discussed in Appendix A1.2. Projection results can be found in Appendix B.
A.1 Oil Sands Production Categories
For this analysis, oil sands production is categorized by type of production, type of recovery, geography, and recovery method. Figure A.1 shows the breakdown.
Figure A1.1 – Oil Sands Production Categories
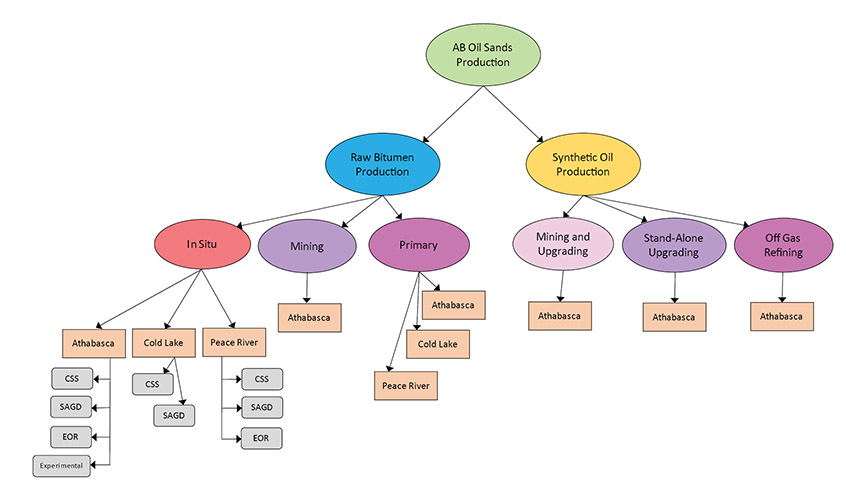
Description:
This figure shows a flow chart depicting the breakdown of components that are analyzed to reach a projection of raw bitumen production. The same process is used for each of the cases. Raw bitumen production is projected for each type of production facility (Experimental, EOR, SAGD, CSS, Mining) within each of the three oil sands regions (Athabasca, Cold Lake, Peace River) where applicable. The results of this work is then aggregated to form the projection for total raw bitumen production. Synthetic crude oil is also forecast and is a combination of mining and in situ production that is upgraded within Alberta.
A.1.1 Oil Sands Areas
Oil sands production occurs in three areas in Alberta: Athabasca, Cold Lake, and Peace River. Athabasca has the majority of activity and production, including SAGD, CSS, and EOR in situ projects. Athabasca also has mining projects, upgrading, off gas refinery projects, and primary projects. Cold Lake has SAGD and CSS in situ projects as well as primary projects. Peace River has SAGD, CSS, and EOR in situ projects and primary projects.
Figure A1.2 – Oil Sands Areas Map
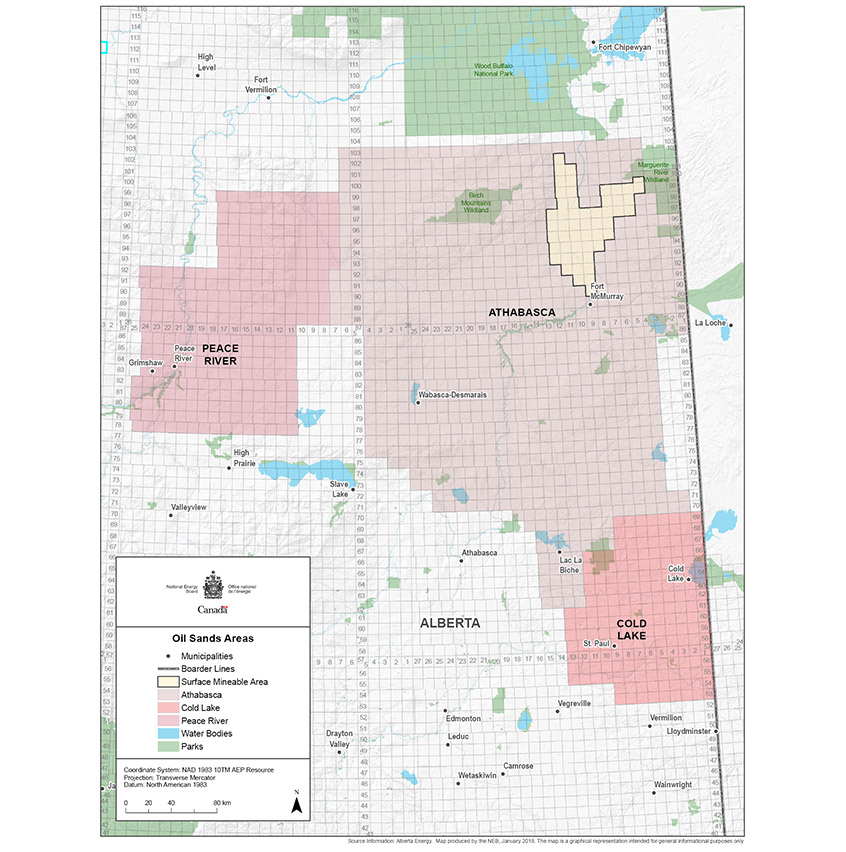
Description:
This figure contains a map showing the aerial extent of each of the three oil sands areas, Athabasca, Cold Lake and Peace River.
A.1.2 Type of Production – Raw Bitumen and Synthetic Crude Oil
Both raw bitumen production and synthetic crude oil production are projected as part of the analysis. The majority of mined bitumen is upgraded within Alberta with some notable exceptions. In addition, production from two in situ facilities, Suncor’s Firebag and MacKay River projects, is partially upgraded to synthetic crude oil. The remaining volumes of in situ production, as well as production from Imperial’s Kearl Mine Suncor’s Fort Hills Mine (once it is completed), are marketed as diluted bitumen.
A.1.3 Type of Recovery – In Situ, Mining, Primary, EOR
Bitumen is produced in one of four ways. Roughly 90 per cent is either mined or extracted using in situ methods. Remaining production comes from Primary and Enhanced Oil Recovery (EOR). Primary bitumen production is slightly less viscous than in situ bitumen and can flow to the surface without applying heat or solvents. However, these projects are of a smaller scale than in situ developments. EOR uses reservoir flooding similar to the technology used for conventional oil. These too are a smaller scale than either mining or in situ projects. Combined, there were over 150 Primary and EOR projects operating within Alberta in 2016.
A.1.4 In Situ Recovery Method – SAGD, CSS, EOR
There are three types of in situ recovery technologies included in this report: SAGD, CSS, and EOR.
SAGD typically uses pairs of horizontal wells to produce bitumen. Steam is injected into an upper well to heat the bitumen, which then drains by gravity into a lower well and is pumped to the surface.
CSS also uses steam to produce bitumen. The steam is injected into a reservoir through a well over a period of several months, heating and decreasing the bitumen’s viscosity. Later, the steam is turned off and the emulsion of water and bitumen flows back into the well over a period of several months. The process is repeated for the economic life of the well.
EOR extracts oil from reservoirs once pressures have fallen to a point where natural production is no longer economically viable, even with artificial lifts like pump jacks. This includes pressure maintenance, cycling, water flooding, thermal methods, chemical flooding, and the use of miscible and immiscible displacement fluids.
A.2 Methods to Project Bitumen Production
For this report, historical production data, plans announced by producers, and industry and government consultations were used to derive projections. Monthly projections out to the end of 2040 are made for existing projects, for future (new) projects, and for expansions of both existing and new projects.
A.2.1 Method for Existing Projects
Projects that are, or have, produced are categorized as existing projects and their historical monthly production trend is used to project future production. For the most part, existing projects’ production is held constant out to 2040. Projections for projects whose production is currently declining maintain that decline. Projects whose production is currently zero but produced in the past will either have zero production over the projections (retired projects) or return to the expected levels at a given time based on publicly available information (i.e., projects that have been temporarily shut down).
A.2.2 Method for Expansions
Expansions are additions to existing projects. Given the oil price assumptions, most future increases in bitumen production will come from expansions of existing projects rather than new projects. Publically available information is used to determine the size and timing of expansions.
A.2.3 Method for Future Projects
Given a projected oil price and other assumptions, it may be warranted to include one or more new projects in the projection. New in situ projects are expected to be built as well though the timing, size and number of projects differs between the cases.
A.3 Synthetic Crude Oil Production Projection Methods
Synthetic crude oil is raw bitumen that is processed into a lighter crude oil. Most mined bitumen is currently upgraded and it is assumed this trend will continue throughout the projection period. In addition to mining, some in situ and heavy oil production is upgraded.
A.4 Other Assumptions and Analysis
A.4.1 Capital Expenditures
Capital expenditures are made up of two things: sustaining and construction.
Sustaining capital expenditure is the investment needed to maintain existing projects, and is generally closely linked to production levels. If production is expected to trend upwards over the projection, so too will the sustaining capital expenditures. In this analysis sustaining capital is set at:
- $1 500 / b/d of gross bitumen produced per year for primary production
- $9 000 / b/d of gross bitumen produced per year for mining production
- $5 000 / b/d of synthetic oil produced per year for upgraded production
- $6 300 / b/d of gross bitumen produced per year for in situ production
Construction capital expenditure is the cost for new projects or expansions. The cost is assumed to start in the first month of construction, and is spread evenly over the construction months. Most projects or expansions’ construction periods are assumed to take 18 to 24 months. New projects and expansions also have ramp-up times for production, since production generally does not start at the maximum amount in the first month of operation. Construction costs are based on available information and consultation. Costs differ between producers and projects, but generally range from:
- $30 000 – 60 000 per b/d of capacity for in situ
- $80 000 – 95 000 per b/d of capacity for mining
- $50 000 – 70 000 per b/d of capacity for upgrading
The wide range reflects the highly variable nature of the quality of reservoirs available to each producer as well as technology assumptions.
A.4.2 SOR and Natural Gas Use Assumptions
A steam-oil-ratio (SOR) is the number of barrels of steam used to produce a barrel of oil used for the thermal (SAGD, CSS) in situ projects. The lower the SOR, the more efficient the project is, and generally has a lower supply cost than a project with a higher SOR. For most projects, the steam is generated by burning natural or synthetic gas. If the SOR is available, the ratios assumed to estimate gas use are:
- Dry SOR * 0.41 Mcf/b of steam = Mcf/b of bitumen production for SAGD
- Wet SOR * 0.32 Mcf/b of steam = Mcf/b of bitumen production for CSS
For some projects, the historical SOR is unknown, and so the general ratios used would be:
- 0.187 Mcf/b of bitumen produced for EOR
- 2.0 Mcf/b of bitumen produced for SAGD and CSS
Projected monthly SORs for a project are based on historical trends, technology and efficiency projections, and schedule of expansions (which will generally temporarily increase the SOR, because new projects or expansions commence steaming in preparation for production startup). Given the projected SOR or general ratios, monthly gas use in the oil sands industry is also projected.
Mining, upgrading, and primary projects do not use steam, but may use natural gas for operations. The historical ratios for each project are carried forward in the projection to calculate future gas use from these projects.
A.4.3 Electricity Assumptions
Historical electricity use for mining and upgrading projects is available for most projects. The ratios of electricity use per unit of production are carried forward over the projection to calculate electricity use. For other projects, the electricity use assumptions are:
- 18.9 kW.h/b of bitumen production for primary and EOR
- 15.0 kW.h/b of bitumen production for SAGD and CSS
A.4.4 CO2 Assumptions
The cost of carbon dioxide emissions are included in the analysis. The cost of emissions decreases industry revenue and cash flow available for future capital expenditures. However, on a project by project basis, the cost of carbon may or may not affect the production projection. More efficient projects with lower SORs won’t have their economics affected as much as less efficient projects. Thus, for most projects, given current and projected SORs, the production projection is the sameFootnote 1 for varying carbon prices. Less efficient, usually smaller, projects are assumed to be affected with some production taken out of the projection given the carbon and oil price assumptions.
The amount of gas consumed, and CO2 emitted, can be calculated using the gas use per barrel of bitumen or synthetic oil discussed in section A.4.2. The assumed ratio is:
0.0019 tonnes of CO2 / m3 of natural gas use
An output-based adjustment, as based on Alberta’s climate plan, was then applied to the actual cost of CO2, for each project by year. For a given year, the projects are ranked from lowest SOR to highest SOR. The 25th percentile lowest SOR is a threshold level. The carbon cost associated with that SOR is the output-based adjustment and all projects’ carbon costs are adjusted by that amount. Thus, the projects with lower SORs than the threshold end up with a carbon cost less than zero (revenue is adjusted up) and the rest of the projects have lower, but still positive carbon costs (revenue is adjusted lower). More information on carbon calculations and provincial policies can be found in the Energy Future 2017 report.
Appendix B – Detailed Data Tables
Data for the figures in Appendices A and B are available in a Microsoft Excel file [EXCEL 4911 KB].
- Date modified: