ARCHIVED - Fact Sheet - Canada's Energy Future: Energy Supply and Demand Projections to 2035 - Natural Gas Production Outlook Highlights
This page has been archived on the Web
Information identified as archived is provided for reference, research or recordkeeping purposes. It is not subject to the Government of Canada Web Standards and has not been altered or updated since it was archived. Please contact us to request a format other than those available.
Fact Sheet - Canada's Energy Future: Energy Supply and Demand Projections to 2035 - Natural Gas Production Outlook Highlights
Canada's Energy Future: Energy Supply and Demand Projections to 2035 provides a "most likely" Reference Case and four sensitivity cases (based on high and low prices, and fast and slow economic growth) to 2035. The highlights below are based on the Reference Case. For detailed information, please see page 27 of the report.
Drilling and production gradually climb, and the focus on tight and shale gas continues
- Natural gas prices gradually climb in the Reference Case projection. This leads to increased drilling activity, especially for the more economic resources like deeper tight gas and shale gas. However, gas wells drilled per year remain about one-fifth of the peaks seen in 2005 through 2008.
- Strong production rates from the deeper wells lead to increased production in the latter half of the projection, as additions of new gas outpace production declines from older wells. This would lead to increased revenues available to fund additional drilling, and thus more gas wells and more gas production.
- Canadian natural gas production has dropped 15 per cent since 2008, a direct result of a downturn in drilling activity due to gas price declines. Activity in the last few years has increasingly focused on deeper conventional, tight, and shale gas resources as technological advancements in horizontal drilling and/or multi-stage hydraulic fracturing have lowered their supply costs.[1] Shallow gas resources largely remain unprofitable throughout the projection period.
[1] National Energy Board, Natural Gas Supply Costs in Western Canada in 2009, November 2010.
Production
- Canadian marketable natural gas production in the Reference Case declines slightly until 2015, from 383 million m³/d (13.5 Bcf/d) in 2011 to 372 million m³/d (13.1 /d) in 2015. Production then starts to increase, reaching 510 million m³/d (18.0 Bcf/d) in 2035 (see graph below).
- Natural gas from the deeper and more productive conventional, tight, and shale wells more than compensates for production declines from older wells and less gas being added from shallower areas. With higher-productivity wells, it takes fewer wells to maintain overall production than it did before.
Natural Gas Production by Type, Reference Case
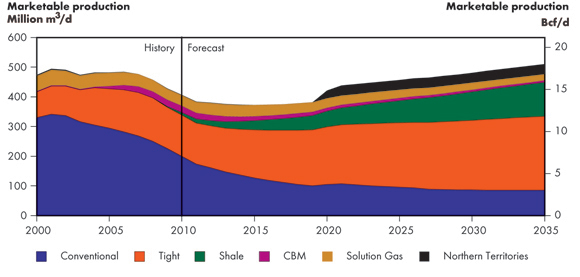
- Recently, companies have been focusing on tight and shale resources. These include the Montney tight gas play in northeast British Columbia and western Alberta, the Horn River shale gas resource in northeastern British Columbia, and the Cretaceous tight gas zones in the Deep Basin in western Alberta. This focus is expected to continue throughout the projection period as these resources have some of the best economics in Western Canada.
- Coalbed methane production declines over the projection period, as investment is drawn to other resources.
- Production of solution gas (gas produced from oil wells) increases slightly through 2014 along with conventional oil production. As conventional and tight oil production decreases over the projection period after 2014, so does the production of solution gas.
- Given the price assumptions, Mackenzie gas is assumed to begin flowing in 2020 in the Reference Case. Mackenzie marketable production in the first year is projected to average 27 million m³/d (953 MMcf/d) and 34 million m³/d (1.2 Bcf/d) over the remainder of the projection period.
- Date modified: