ARCHIVED - Canada's Energy Future - Reference Case and Scenarios to 2030 - Energy Market Assessment
This page has been archived on the Web
Information identified as archived is provided for reference, research or recordkeeping purposes. It is not subject to the Government of Canada Web Standards and has not been altered or updated since it was archived. Please contact us to request a format other than those available.
Chapter 4: Continuing Trends

Significant trends apparent at the beginning of the outlook period are maintained throughout the scenario in Continuing Trends. This scenario is characterized by little change and, as such, reflects an expansion of the Reference Case over the long-term.
Scenario Overview (2005-2030)
Global Forces
At the beginning of the Continuing Trends Scenario, high energy prices spur investment in energy supplies and infrastructure around the world. As a result of increasing supply, energy prices moderate. Prices do not return to the low levels of the 1990s due to higher exploration and production costs for unconventional energy and ever-increasing world energy demand.
Over the scenario time frame, a number of significant events occur; however, nothing is momentous enough to significantly alter the path that the world was on in 2005. The world continues to consume enormous, and increasing, amounts of energy, most of which is based on fossil fuels. The link between economic growth and energy use is still strong, albeit weakening due to the continuing trend of energy efficiency improvements.
There continues to be an uneven distribution of energy production and consumption. Energy supplies are concentrated in a few countries and large energy-consuming regions continue to be dependent on these supplies. Despite this concentration, markets are generally reliable and competitive. Energy sellers and consumers recognize the economic benefits of an expanded market. However, geopolitical incidents continue to cause energy market volatility.
The demand for environmental improvements continues to grow globally. It is difficult and time consuming to negotiate international agreements. As a result, environmental issues are largely dealt with in isolation and there are few institutional frameworks to deal with environmental, social and economic issues in unison. Reductions in environmental emissions are largely achieved through business-as-usual improvements in energy efficiency and stock turnover rates.
Canadian Outcomes
The global forces in this scenario are reflected in the Canadian outcomes. Continuing Trends continues to see strong Canadian energy demand growth as well as robust energy production outlooks.
Macroeconomic Outlook
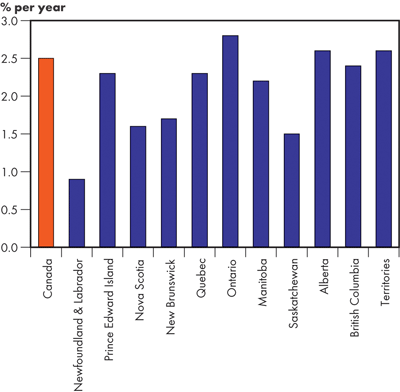
In the Continuing Trends Scenario, population growth slows to 0.7 percent per year (Table 4.1). The slowing population growth and retirements by the baby-boom generation result in a deceleration in labour force growth. Over the outlook period, labour force growth averages 0.8 percent per year. Productivity measured as output per employee improves to 1.5 percent per year over the next 25 years. These two factors combined result in Canadian gross domestic product (GDP) averaging 2.5 percent per year growth (Figure 4.1). This is slightly slower than historic rates as increased productivity does not fully compensate for the lower labour force growth. To achieve a higher growth rate or to maintain economic growth at current levels would require much more aggressive improvements in productivity or increases in immigration levels.
Table 4.1
Key Macroeconomic Variables – Continuing Trends 2004-2030
| 1990-2004 | 2004-2030 | |
|---|---|---|
| Population | 1.0 | 0.7 |
| Labour force | 1.3 | 0.8 |
| Productivity | 1.4 | 1.5 |
| Gross domestic product | 2.8 | 2.5 |
| Goods | 2.5 | 2.7 |
| Service | 3.0 | 2.4 |
| Real disposable income | 3.6 | 4.2 |
| Exchange rate (average cents US/Cdn dollar) | 74 | 101 |
| Inflation rate (average %) | 2.3 | 1.7 |
| (Annual Average Growth Rate (% per year) unless otherwise specified). | ||
Figure 4.1
Real GDP Growth Rates – Continuing Trends 2004-2030
The structure of the Canadian economy remains fairly stable. By 2030, the goods producing sector continues to account for one-third of the GDP and the service sector accounts for two-thirds.
The regional distribution of Canadian economic growth also remains constant with Ontario, Alberta, British Columbia and the Territories leading economic growth in the country.
Energy Prices
Crude Oil Prices
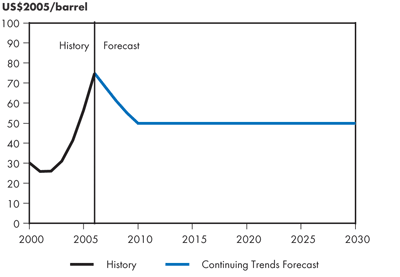
Recent high crude oil prices encourage consumers to curb energy demand and bring on additional supplies of energy leading to a moderation of prices. The Reference Case assumes that crude oil prices will fall to US$50/barrel and remain at this level until the end of the reference period. The Continuing Trends Scenario maintains this assumption past the Reference Case time horizon to 2030 (Figure 4.2).
Figure 4.2
West Texas Intermediate Crude Oil Price at Cushing, Oklahoma – Continuing Trends
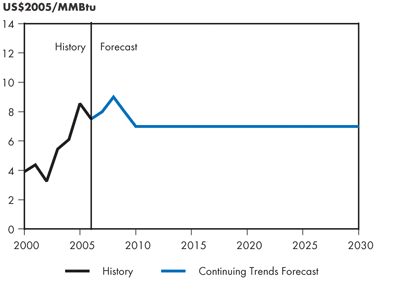
Natural Gas Prices
In Continuing Trends, the historic relationship between crude oil and natural gas prices is maintained. As a result, natural gas prices for the majority of the scenario remain at US$6.65/GJ (US$7/MMBtu) (Figure 4.3).
Figure 4.3
Natural Gas Price at Henry Hub, Louisiana – Continuing Trends
Electricity Prices
In Continuing Trends, prices continue to rise with the need for new generation assets to accommodate growth (e.g., gas-fired, hydro, wind and biomass) and the need to replace ageing facilities (e.g., nuclear assets in Ontario)[46].
[46] Regional prices are provided in Appendix 5.
Coal Prices
After the uplift accounted for by higher oil and gas prices in recent years, coal prices are projected to decline gradually in the near term as the result of competitive pressures and continuing productivity increases in mining and rail transportation. However, as opportunities for resource development become more costly, prices rise gradually through the remainder of this scenario.
Energy Demand
Continuing Trends extends the assumptions made in the Reference Case out to 2030.
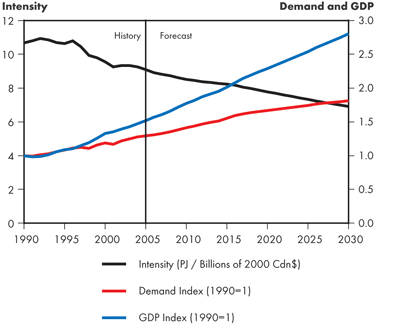
Total Secondary Energy Demand Trends
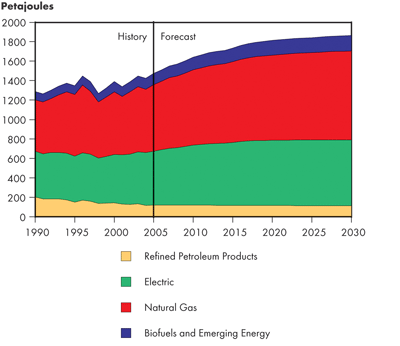
Canadian total secondary energy demand in the Continuing Trends Scenario grows at a rate of 1.0 percent per year over the 2015 to 2030 period (Figure 4.4). The decrease in energy demand growth from the Reference Case is primarily due to slower economic growth in the latter years of the Continuing Trends forecast. The overall Canadian demand intensity improvements are 1.1 percent per year over the scenario outlook.
Figure 4.4
Canadian Total Secondary Energy Demand by Fuel – Continuing Trends

('Other' includes coal, coke, coke oven gas, and steam)
As of 2030, the three largest energy consumers are Ontario, Alberta and Quebec. Ontario accounts for 31 percent of total secondary energy demand in Canada, Alberta accounts for 30 percent and Quebec 18 percent. Provincial population, personal disposable income and economic activity assumptions, as described in the macroeconomic section of this chapter, all affect provincial energy demand. Total secondary energy demand growth rates vary by province, with Alberta, Ontario and the Territories all having growth rates higher than the Canadian average.
Continuing on a trend established in the Reference period, oil's share of the fuel mix continues to increase (Figure 4.4). This increase is primarily attributable to the rapid expansion of oil sands activity in Western Canada with the use of oil by-products as an on-site fuel source. Natural gas and electricity energy demand continue to grow over the forecast, but not at the same rate as oil. As well, there is some moderating of electricity demand growth as a result of increasing electricity prices. The absolute value of biofuels and emerging energy demand increases, but its share decreases from six percent in 2004 to five percent by 2030.
Figure 4.5
Canadian Total Secondary Energy Demand Intensity – Continuing Trends
Demand Management Programs
Demand management programs include demand-side management (DSM), specifically energy conservation and energy efficiency, as well as demand response (DR). Demand-side management refers to long-term, sustainable load reduction. The concepts of DSM have existed for decades. Previous programs were generally low-tech, such as turning down the thermostat, and relied on publicly-funded information campaigns. New technology, particularly in automation and controls, is already defining the possibilities for future demand-side management programs. Many new homes are already wired as 'smart homes' where lights, security systems, heating or cooling, and major appliances can all be computer controlled. Energy use can be optimized to match the need. A simple household 120V power bar is now available that shuts off all loads automatically when loads have been inactive for more than an hour.
Demand response, also known as load shedding or load shifting, is desirable in a constrained supply market where occasional load reduction is preferable to sourcing new generation. Demand response programs are available for large power users, generally in the industrial sector, who have the option of temporarily reducing power consumption. These programs offer the customer a financial incentive to offer committed power back into the grid. Due to the relative inelasticity of the electric market, peak load power costs can be up to ten times the base load price. Reducing loads during these times improves grid reliability and market efficiency.
Residential Secondary Energy Demand
Canadian residential secondary energy demand grows at a rate of 1.0 percent per year over the 2004 to 2030 period (Figure 4.6). Higher personal disposable income enhances a continuation of the trends for consumer goods and services. Energy efficiency simply cannot compete with the income effect. However, in the latter years of the Continuing Trends Scenario, energy demand moderates to 0.5 percent per year as a result of decelerating population growth and slower income growth. Fuel shares by province vary and follow the same patterns as the Reference Case.
Figure 4.6
Canadian Residential Secondary Energy Demand by Fuel – Continuing Trends
Commercial Secondary Energy Demand
Canadian commercial secondary energy demand grows at an average rate of 1.4 percent per year over the entire 2004 to 2030 period (Figure 4.7). Population is a primary driver of service sector growth, which determines commercial energy demand. The decelerating population assumption leads to lower growth expectations in the service sector. This economic assumption, combined with higher electricity prices and the backlog of energy efficiency prospects in commercial buildings (mostly lighting and recommissioning), results in slower than historical energy demand growth.
Figure 4.7
Canadian Commercial Secondary Energy Demand by Fuel – Continuing Trends
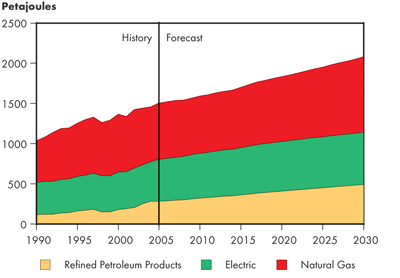
The demand shares by fuel for Canada from 2004 to 2030 indicate some fuel-switching into oil from natural gas and electricity, although, some commercial sector data allocation issues could distort fuel shares.
Industrial Secondary Energy Demand
Economic growth in the goods producing sector combined with a favourable oil sands production profile result in Canadian industrial secondary energy demand growth of 1.1 percent per year over the 2004 to 2030 period. As can be seen in Figure 4.8, energy demand growth is slower in the latter part of the scenario. This is a consequence of slowing economic growth and more moderate expansion of oil sands activity.
Figure 4.8
Canadian Industrial Secondary Energy Demand by Fuel – Continuing Trends
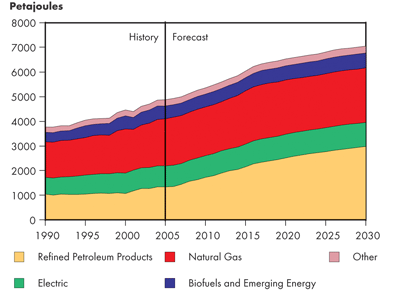
('Other' fuel includes coal, coke, coke oven gas, steam, naphtha)
In 2030, the largest provincial energy consumer in the industrial sector is Alberta, accounting for 43 percent of industrial energy demand in Canada. Ontario accounts for 26 percent and Quebec follows at 16 percent of industrial demand.
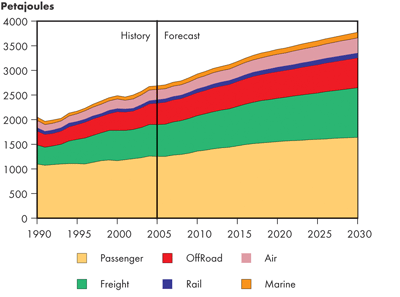
Transportation Energy Demand
Canadian transportation energy demand grows at 1.3 percent per year over the 2004 to 2030 timeframe and at 1.1 percent per year over the 2015 to 2030 period (Figure 4.9). Higher commodity prices, slightly lower economic growth rates, and efficiency improvements result in lower transportation energy demand in the future. The renewables share increases from near zero to one percent by 2030 due to the assumed ethanol policies in Ontario and Saskatchewan[47]. The off-road share remains strong at 16 percent over the forecast with robust activity in the oil sands, agriculture and construction industries.
[47] The Ontario assumption is 5 percent ethanol volume (3.4 percent energy) of total gasoline use in the province by 2007. The Saskatchewan assumption is 7.5 percent ethanol volume (5.1 percent energy) of total gasoline use in the province by 2007.
Figure 4.9
Canadian Transportation Energy Demand by Fuel – Continuing Trends
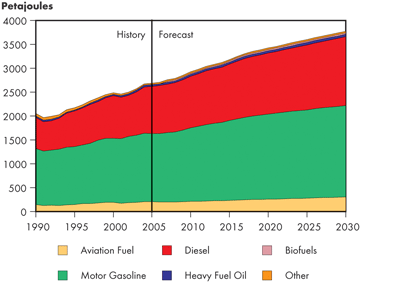
('Other' includes electricity, LPG, lubricants and natural gas)
Figure 4.10
Canadian Transportation Energy Demand by Mode – Continuing Trends
Oil Supply
Crude Oil and Equivalent
In Continuing Trends, the extrapolation of existing trends combined with reasonably attractive oil prices allows for the preservation of historical declines in WCSB conventional crude oil production and east coast offshore production. Expansion in oil sands production levels also continue.
Crude Oil and Bitumen Resources
Canadian crude oil and bitumen resources are the same in the Reference Case and all three scenarios[48].
[48] Canadian crude oil and bitumen resources are detailed in Chapter 3 and in Appendix 3.
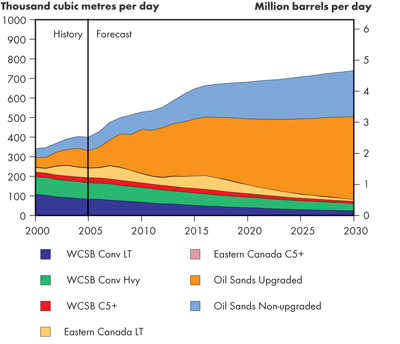
Total Canada Oil Production
In the Continuing Trends Scenario, production expands by about 2.0 percent per year until 2015, supported by increasing oil sands mining, in-situ production and by the east coast offshore activity (Figure 4.11). Production expansion gradually declines to about 0.7 percent per year by 2030, with production reaching 740 000 m³/d (4.66 million b/d). Oil sands production plays an increasingly dominant role, accounting for 90 percent of total Canadian oil production by 2030.
Figure 4.11
Total Canada Oil Production – Continuing Trends
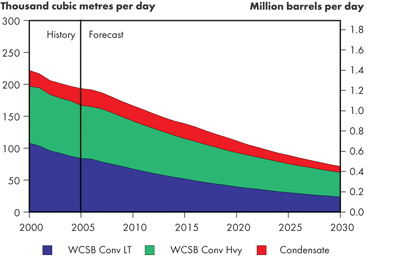
Conventional Crude Oil – WCSB
While reasonably attractive oil prices allow for significant reserves additions from new discoveries, infill drilling and improved recovery techniques, these additions are only sufficient to maintain production at the long-term decline trends shown.
For conventional light crude oil, the long-term declining trend of five percent per year is maintained, consistent with a mature supply basin.
Alberta and Saskatchewan are the primary sources of conventional heavy crude oil, with British Columbia contributing minor amounts. Similar to light oil, the long-term declining trend of 3.5 percent per year is maintained for heavy oil, consistent with a mature supply basin.
In the Continuing Trends Scenario, conventional light oil production declines to 23 700 m³/d (149 thousand b/d) and conventional heavy oil production declines to 38 300 m³/d (241 thousand b/d) by 2030 (Figure 4.12). By 2030, conventional production in the WCSB is 37 percent of 2005 rates. Condensate production levels decline to 9 500 m³/d (60 thousand b/d).
Figure 4.12
WCSB Conventional Oil Production – Continuing Trends
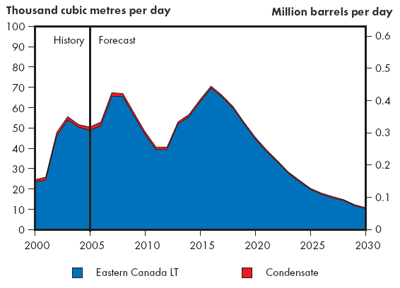
Eastern Canada Light Crude Production
Projections for eastern Canada oil production are dominated by the east coast offshore, with only minor amounts of production expected from Ontario.
As with the Reference Case, Continuing Trends includes Hebron production starting in 2013, contributions from smaller satellite pools in the Jeanne d'Arc Basin, and a 80-million cubic metre (500 million barrel) sized pool in the relatively unexplored regions of the East Coast commencing production in 2015 (Figure 4.13). Production peaks in 2016 at 69 600 m³/d (438 thousand b/d), after which a relatively rapid decline begins. By 2030, production declines to 10 300 m³/d (65 thousand b/d).
Figure 4.13
Eastern Canada Light Crude Production – Continuing Trends
Oil Sands Supply
The projections of oil sands derived production in the Continuing Trends Scenario are essentially based on an extrapolation of trends presented in the Reference Case. It is assumed that cost pressures moderate over time from the current situation. Additional annual incremental capacity decreases over time, as limits to growth are approached, consistent with typical hydrocarbon resource growth curves.
These projections represent both upgraded and non-upgraded oil sands supply from mining, in-situ and primary bitumen sources (Figure 4.14). Primary or cold production levels increase one percent annually in all scenarios.
Figure 4.14
Canadian Oil Sands Production – Continuing Trends

Production from Saskatchewan oil sands deposits are assumed to start in 2017, reaching a level of 10 100 m³/d (64 thousand b/d) by 2030.
In Continuing Trends, the assumptions on price and light/heavy differentials generate sufficient cash flow for oil sands operators to expand production levels, with production reaching 658 000 m³/d (4.15 million b/d) by 2030. Upgraded bitumen volumes total 423 000 m³/d (2.67 million b/d) while non-upgraded volumes total 235 000 m³/d (1.48 million b/d).
Regarding the natural gas requirements for oil sands operations, the trends established in the Reference Case are extended out to 2030. Thus, the assumption of a one percent annual improvement in energy efficiency for ongoing operations is maintained, and the application of bitumen gasification and other technologies such as THAITM, MSAR and vaporized extraction (VAPEX), continue to gain momentum.
Alternative Fuels for Oil Sands
The recovery and upgrading of bitumen from the oil sands is an energy-intensive endeavour. Natural gas, which is a reliable and clean-burning source of energy, and historically inexpensive, came to be relied on as the major source of energy for bitumen extraction and electricity generation, and of hydrogen required for upgrading. However, a tightening North American natural gas market has resulted in higher and more volatile gas prices. Oil sands operators are seeking ways to reduce their exposure to natural gas. Several developing alternatives to using natural gas could be available.
A number of projects are planned that feature the gasification of bitumen residue in various forms to produce hydrogen for use in upgrading and a synthetic gas for thermal extraction purposes and electricity generation. The Long Lake SAGD/Upgrader project operated by OPTI Canada and Nexen Inc. will be the first project in Canada’s oil sands to utilize gasification of bitumen, while Suncor Energy Inc. is considering plans to gasify petroleum coke for its Voyageur 2 upgrader in 2012. North West Upgrading plans an independent upgrader that will use residual hydrocracked bottoms to produce hydrogen and synthetic fuel. Quadrise Canada has developed a process termed Multiphase Superfine Atomized Residue (MSAR) that features the combustion of a bitumen/water emulsion as a fuel source. This process has been tested at the TOTAL Joslyn SAGD project and offers the advantage of being a lower cost fuel than natural gas.
Petrobank Inc. has been pilot testing its in-situ combustion process, termed THAITM (toe-to-heel air injection) at its Whitesands project. As most of the required energy is derived from the reservoir, natural gas use is significantly reduced.
In order to improve recovery and process efficiency, and thereby reduce natural gas usage, the addition of solvent to injected steam volumes in both cyclic steam stimulation (CSS) and SAGD projects has been tested by Imperial Oil and Encana, among others. Vapour extraction processes, which feature the injection of a cold solvent vapour, is being piloted in several projects. An industry consortium, GeoPower in the Oil Sands (GeoPOS) has been formed to investigate the economic and technical feasibility of employing geothermal energy for oil sands production. Geothermal energy could potentially provide a constant, predictable, price-stable source of energy that releases virtually no greenhouse gas (GHG) emissions or other airborne pollutants.
Nuclear energy for oil sands use has been proposed and, similar to geothermal, offers the advantage of a constant, reliable source of energy with little GHG emissions. However, high initial capital costs, security issues and concerns on the part of the general public regarding safe disposal of radioactive waste may preclude early implementation of this technology.
Additional information on natural gas requirements for oil sands can be located on several industry and government web sites:
Canadian Association of Petroleum Producers; Energy Resources Conservation Board; Quadrise Canada Corporation; Petrobank and Bruce Power Alberta.
In Continuing Trends, the effect of ongoing efficiency improvements and adoption of alternative fuels reduces the purchased natural gas intensity from 0.67 Mcf/b in 2005 to 0.47 Mcf/b in 2030. Total purchased natural gas requirements, excluding on-site electricity requirements, reach 53.8 million m³/d (1.9 Bcf/d) by 2030.
Supply and Demand Balances
The supply and demand balances for Continuing Trends from 2000 to 2015 are the same as for the Reference Case. Petroleum product demand increases from 392 400 m³/d (2.47 million b/d) in 2015 to 486 300 m³/d (3.06 million b/d) in 2030.
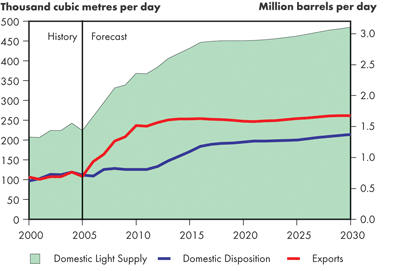
Light Crude Oil - Supply and Demand Balance
Exports of light crude oil remain relatively constant from 258 300 m³/d (1.63 million b/d) in 2015 to 266 900 m³/d (1.68 million b/d) in 2030 (Figure 4.15).
Figure 4.15
Supply and Demand Balance, Light Crude Oil – Continuing Trends
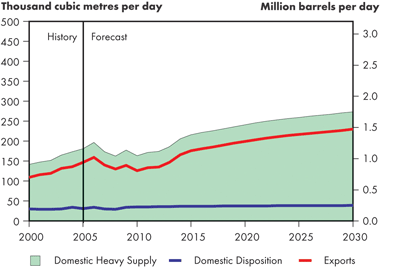
Heavy Crude Oil – Supply and Demand Balance
Exports of heavy crude oil increase from 178 900 m³/d (1.1 million b/d) in 2015 to 233 900 m³/d (1.47 million b/d) in 2030 (Figure 4.16).
Figure 4.16
Supply and Demand Balance, Heavy Crude Oil – Continuing Trends
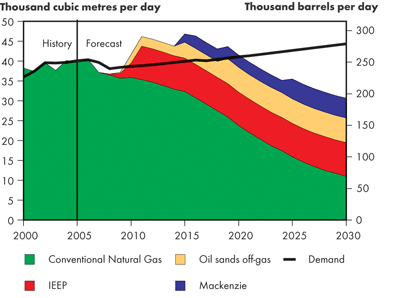
Natural Gas Supply
Canadian Natural Gas Resource Base
Continuing Trends adopts the same estimate for the Canadian natural gas resource base as the Reference Case. The relatively greater draw on conventional natural gas resources over the 2005 to 2015 period results in the remaining resource base in Western Canada at the beginning of 2016 being slightly less weighted toward conventional resources (i.e., 2 351 billion cubic metres of conventional compared to remaining unconventional resources of 1 501 trillion cubic metres [83 trillion cubic feet of conventional compared to remaining unconventional resources of 53 trillion cubic feet]). By the end of 2015, roughly 765 billion cubic metres (27 trillion cubic feet) of the original 1 416 billion cubic metres (50 trillion cubic feet) of established conventional reserves will have been consumed, with another 425 billion cubic metres (15 trillion cubic feet) used between 2016 and 2030.
Production and LNG Imports
Relative to the almost 484 million m³/d (17.1 Bcf/d) of annual output in 2005, Canadian natural gas production is expected to decline by almost 40 percent to 297 million m³/d (10.5 Bcf/d) by the end of 2030, as shown in Figure 4.17. The production decline represents a relatively constant level of natural gas drilling at roughly 18 000 wells drilled per year and ongoing reductions in initial well productivity. After 2015, WCSB conventional gas provides just 60 percent of production, while unconventional production accounts for 22 percent (compared to 79 percent and 12 percent, respectively, for the 2005 to 2015 period). Assuming no significant new discoveries, offshore Nova Scotia gas production (Sable and Deep Panuke[49]) would likely have ended operations by 2020.
[49] Deep Panuke project is subject to obtaining regulatory approval and a commercial decision to proceed.
Figure 4.17
Natural Gas Production Outlook – Continuing Trends

By 2017, it is assumed that sufficient oil production will have occurred from projects on the Grand Banks of Newfoundland and that the associated gas formerly retained for pressure maintenance would start to become available for market. Production volumes are projected to increase to 28 million m³/d (1 Bcf/d) and produce almost 99 billion cubic metres (3.5 trillion cubic feet) through 2030. Possible options for delivering this gas to regional markets may include compressed natural gas (CNG) tankers, a liquefied natural gas (LNG) project, or a sub-sea pipeline.
Subject to regulatory approval and a commercial decision to proceed, a Mackenzie gas pipeline is assumed to deliver 34 million m³/d (1.2 Bcf/d) until 2025, when throughput would increase to 54 million m³/d (1.9 Bcf/d). Throughput in excess of 23 million m³/d (0.8 Bcf/d) reflects production from sources outside the three anchor fields discovered in the 1970s and could include offshore projects in the Beaufort Sea.
By 2030, LNG imports average 81 million m³/d (2.9 Bcf/d) or the equivalent of roughly 27 percent of Canadian domestic natural gas production. This level of imports may be accommodated through an estimated five import terminals ranging in capacity from 14 to 28 million m³/d (0.5 to 1.0 Bcf/d).
Supply and Demand Balance
After 2015, growth in gas demand for oil sands operations slows due to the adoption of alternative technologies and fuels in the latest generation of projects. The use of natural gas for power generation continues to increase, but slows somewhat toward the end of the scenario as new clean coal and nuclear facilities enter service.
Figure 4.18
Supply and Demand Balance, Natural Gas – Continuing Trends
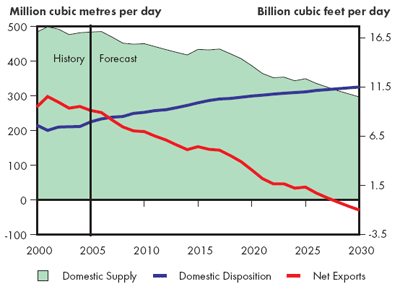
By 2028, Canadian domestic gas consumption is estimated to be equivalent to Canadian domestic gas production and Canada's position as a net gas exporter would potentially come to an end, as shown in Figure 4.18. Physical exports and imports of natural gas between the U.S. and Canada would likely continue on a region-specific and seasonal basis in response to varying market conditions. Liquefied natural gas imports into Canada and the U.S. would supplement production in both countries to maintain balanced market conditions and enable the relatively stable pricing conditions incorporated in the scenario.
Natural Gas Liquids
Supply and Disposition
Continuing Trends indicates excess volumes of propane and butanes available for export throughout the projection period[50].
[50] Further detail on propane and butane supply, demand and potential exports can be found in Appendix 3.
Ethane Supply and Demand Balances
In Continuing Trends, the decline in conventional ethane supply continues through 2030, reflecting the long-term decline of WCSB natural gas production (Figure 4.19). Similarly, ethane feedstock demand is assumed to grow at the same rate as the Reference Case; however, demand for improved oil recovery (IOR) is lower in the Continuing Trends Scenario than in the Reference Case, as some of the miscible flood projects are likely to end by 2015. In addition, increments of ethane supply related to straddle plant capacity expansion, oil sands off-gas and development in the Mackenzie Delta are expected to play a bigger role in supplementing supplies from conventional gas production in the longer term. In particular, it is expected that incremental ethane supplies from unconventional sources will contribute about 64 percent of total ethane supply by 2030, with about 5 000 m³/d (31 thousand b/d) from Mackenzie Delta gas (assuming the natural gas stream contains about four percent ethane and the project proceeds) and about 14 600 m³/d (92 thousand b/d) from enhanced deep-cut facilities and oil sands off-gas. However, even with incremental ethane supply, demand from Alberta ethylene plants exceeds supply by 2025, with the shortfall increasing to about 13 700 m³/d (86 thousand b/d) by 2030.
Figure 4.19
Canadian Ethane Supply and Demand Balance – Continuing Trends
Electricity Supply
Capacity and Generation
In the Continuing Trends Scenario, demand growth encourages the development of both traditional generation sources and alternatives to conventional generation. However, generation capacity additions moderate from the relatively high growth of the Reference Case. Generation capacity will increase 34 percent between 2005 and 2030, and 12 percent, or 19 600 MW, between 2016 and 2030 (Figure 4.20). Generation growth averages one percent annually over the latter half of the forecast period (Figure 4.21).
Figure 4.20
Canadian Generating Capacity – Continuing Trends
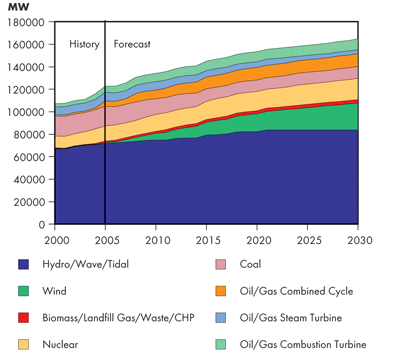
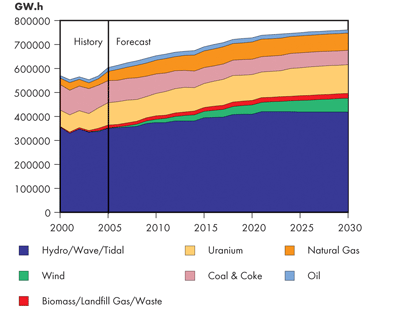
Figure 4.21
Canadian Generation – Continuing Trends
Hydro
Hydroelectric generation will continue to play an important role in meeting Canadian electricity demand, with the share of hydro-based generation increasing from 65 percent in 2016 to 68 percent in 2030. This will constitute additions of 4 400 MW between 2016 and 2030, for a total of 12 000 MW of new hydroelectric energy added between 2005 and 2030.
Between 2016 and 2030, several hydro facilities will be constructed, including the Peace River Site C (900 MW) in British Columbia, Conawapa (1 380 MW) and Gull/Keeyask (600 MW) in Manitoba, and 1 125 MW of new hydroelectric generation in Quebec.
Nuclear
In the Continuing Trends Scenario, nuclear additions occur in Ontario and New Brunswick. In Ontario, a 1 000 MW Advanced Canadian Deuterium (CANDU) Reactor (ACR) is added in 2016 to replace retiring coal units, and two 1 000 MW units are added in 2028 and 2030 when the units at Pickering Station A are retired. In New Brunswick, a 1 000 MW ACR is added in 2024 to replace retiring oil-fired and Orimulsion-fired steam units.
Natural gas-fired
Investment in gas-fired generation slows relative to the Reference Case, due to lower demand. Combined-cycle generation adds 790 MW. There are 910 MW of combustion turbine and cogeneration facilities constructed, and there is a decrease of 2 000 MW of steam turbine generation. From 2016 onward, the share of output from natural gas-fired generation remains constant, meaning that gas will continue to be relied upon to meet demand, but there will not be an increasing use of gas-fired generation.
Coal-fired
Total coal-fired generation capacity is projected to increase by 331 MW during the forecast period. In Alberta, new cogeneration and integrated gasification combined cycle (IGCC) generation is employed in order to help meet load requirements and to replace retiring traditional pulverized coal-fired generation. Five new 360-MW IGCC units are added in the last two decades of the outlook period. Combined with retirement of existing units, these additions result in total coal capacity in Alberta declining by 517 MW. An additional 360 MW of IGCC coal-fuelled generation is added in each of New Brunswick, Ontario and Saskatchewan and Nova Scotia.
Oil-fired
During the Continuing Trends Scenario, declines in the share of oil-fired generation continue. Older steam units continue to be replaced by natural gas-fuelled combined-cycle generation units and those remaining continue to be employed less and less frequently. Diesel internal combustion generation units continue to be the main source of energy in the Territories. In 2020, retiring oil-fired generation in Newfoundland is replaced with a 180 MW natural gas-fired combined-cycle generation unit.
Emerging Technologies
The pace of wind development is still strong in the Continuing Trends Scenario, although it slows relative to the Reference Case, as the increasing amount of wind generation makes it more of a challenge to integrate wind in the grid. Wind power almost doubles its share of the total generation mix, increasing from just over nine percent in 2016 to 20 percent in 2030. Total wind power increases from 11 400 MW in 2016 to 24 000 MW in 2030. Likewise, the rate of growth for wind power generation decreases but continues to grow. By 2030, 57 000 GW.h will be generated by wind power, whereas 29 600 GW.h are forecast for the year 2016. The pace of growth for other emerging generation technologies slows, but overall expands by 23 percent or 675 MW.
Exports, Imports and Interprovincial Transfers
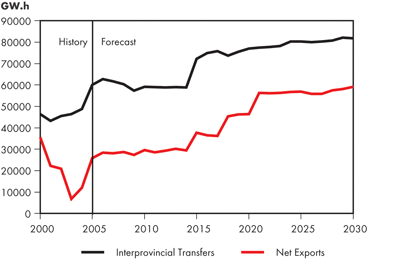
Canadian net exports increase by 108 percent from 2006 to 37 600 GW.h in 2030, due in large part to expansion of hydro generation in Manitoba, British Columbia and Labrador. A 30 percent increase in interprovincial transfers to 81 800 GW.h in 2030 also allows hydro provinces to buy cheap power during off peak periods, saving water in reservoirs for export sales during peak hours (Figure 4.22).
Figure 4.22
Interprovincial Transfers and Net Exports – Continuing Trends
Coal
Supply and Demand
Despite economic growth, domestic demand and imports of thermal coal are down due to the eventual closure of all Ontario coal-fired generation. Also, it is assumed that new coal-fired generation utilizes advanced technology. Integrated Gasification Combined Cycle is used especially after 2019 when the technology is employed for new baseload generation, replacing ageing plants in the western provinces, Nova Scotia and New Brunswick.
Coal demand and production is highest in Continuing Trends due to the high demand. Coal production decreases to 62 Mt in 2030 from 68 Mt in 2005, which is nonetheless the highest production among the three scenarios. This growth is due to stronger metallurgical and thermal demand. Higher than historical natural gas prices, depleting gas reserves and volatile oil prices gradually drive economic decisions toward coal. The replacement of ageing coal-fired power plants, located primarily in Western Canada and parts of the Maritimes, provides the necessary dependable capacity to meet electricity needs.
The closure of Ontario's coal-fired generating plants reduces Canadian imports of thermal coal by approximately 16 percent and metallurgical coal by four percent between 2015 and 2030. Over this same period, Canadian thermal exports and metallurgical exports increase 13 percent corresponding with the increase in inter-regional trade of coal used for power generation and the high U.S. demand for coal to be used in steel production.
Exports of thermal and metallurgical coal are highest in Continuing Trends, both increasing by 12 percent between 2005 and 2015. Increasing world iron and steel production and the continued use of coal-fired generation lead to this increase. Thermal and metallurgical coal exports also grow by 12 percent between 2015 and 2030. Thermal imports increase eight percent compared to 2015 values, due to the addition of coal-fired plants in the Maritimes. Imports of metallurgical coal are up 22 percent based on strong demand in Continuing Trends. Between 2015 and 2030, Continuing Trends indicates the greatest net exports, increasing 16 percent.
Wind Integration: Opportunities and Challenges
While wind power has a number of unique benefits, the intermittent nature of wind power presents a challenge in integrating large amounts of wind power into existing power systems.
Because of variability of wind resources, wind power at a specific location may not always be available. This variability may have a direct impact on electric system reliability, since wind cannot be relied upon for base-load requirements. Intermittent wind power therefore implies that some other energy source must be available to cover periods when wind is unavailable.
There are a number of measures that can mitigate wind intermittency concerns, including geographic diversity, forecasting and synergy with hydroelectric systems.
If wind turbines span a large geographic region, it is less likely that they will all be without wind at the same time. However, wind power developers want to site units in places with the highest average wind speed to maximize output. Advanced daily or hourly forecasts for wind speed and wind turbine generation are valuable, as this provides system operators with time to respond to changes.
Hydro and wind systems have a natural synergy. Hydro units can vary their output quickly, compensating for changes in wind generation. Wind power can be a useful supplement, providing energy when the wind blows, allowing hydro facilities to save water for future generations.
The amount of wind power an electric power system can absorb depends on its configuration. Based on technical studies and experience in Europe and in the U.S., a predominantly thermal system is expected to be able to function normally with up to 10 percent of its installed generating capacity being wind turbines, whereas a mainly hydro-based system could support up to 20 percent installed wind capacity. With additional investment in transmission, control systems and back-up generation installed capacity of wind generation can be increased to 15 percent for predominantly thermal systems and 30 percent for hydro systems.
For further information on wind energy, please refer to the Board’s Energy Market Assessment (EMA), Emerging Technologies in Electricity Generation - March 2006, available on the NEB web site at www.neb-one.gc.ca.
Cogeneration
A cogeneration, or combined heat and power, plant simultaneously produces thermal and electrical energy from the same fuel or fuels. Using the output of one process to drive the other provides substantial gains in energy efficiency compared to the independent production of both products. Construction and operating costs of a cogeneration facility are also comparable to conventional power plants and boilers. Since they are also normally connected to the provincial power grid cogeneration also increases reliability. Having several smaller plants distributed across the province means there is less likelihood of a single point of failure than one large plant, and the cogenerator benefits as they can draw on the grid if a plant encounters problems.
Cogeneration is not more prevalent primarily because it requires a facility that needs both electricity and thermal energy. Also, there must be a mechanism in place wherein the owner of the cogeneration facility can be compensated for the benefits the facility brings to the grid and for any excess power that the plant produces.
There are a number of interesting new developments in the field of cogeneration.
First is the development of a process sometimes referred to as trigeneration. Currently employed at a few commercial sites such as universities and colleges, trigeneration provides electricity, heat and cooling. Conventional air conditioners use a mechanical pump, typically driven by electricity, to provide cooling. Trigeneration adds a technology known as the absorption chiller to a regular cogeneration facility. An absorption chiller is a refrigeration or air conditioning system that is driven by waste heat from the generator instead of electricity. This is not only more efficient, but also does not require a generator and a motor, and as such has a lower capital cost. It can also improve the economics of cogeneration by providing a use for waste heat in the summer months. As cogeneration penetrates the commercial market, trigeneration will become more common.
Secondly, companies in the oil sands are starting to work on using bitumen as a fuel instead of natural gas. Raw bitumen is not a suitable fuel for the combustion turbines used in most oil sands cogeneration plants, so the proposal is to gasify bitumen to produce synthesis gas, a mixture of carbon monoxide (CO) and hydrogen (H2). Some of the H2 is used to upgrade the bitumen produced to more valuable synthetic crude, while the rest of the synthesis gas is used to produce steam and electricity to extract more bitumen from the oil sands.
Finally, research continues into technologies that can extend cogeneration to the residential market. Typical cogeneration facilities are much too large for residential use, but new technologies such as Stirling cycle engines, fuel cells and thermionics all offer potential for small, reliable units suitable for residential use. For more details on these possibilities please refer to the Energy Market Assessment (EMA) Emerging Technologies in Electricity Generation - March 2006, available at www.neb-one.gc.ca.
Greenhouse Gas Emissions
Canadian total GHG emissions in the Continuing Trends Scenario grows at a rate of 1.5 percent over the 2004 to 2015 period and 0.9 percent over the 2015 to 2030 period (Figure 4.23). This is lower than the historical growth rate of 1.7 percent from 1990 to 2004, largely due to a lower GDP growth rate, higher commodity prices, energy efficiency improvements, the expansion of alternative energy resources (e.g., ethanol, wind power), and retiring of older fossil fuel-fired generation plants.
Figure 4.23
Canadian Total GHG Emissions by Sector – Continuing Trends
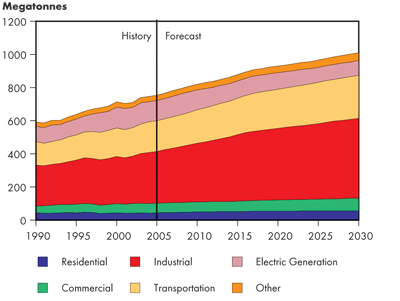
Greenhouse gas shares and growth rates vary by province. The three largest GHG emitters in 2030 are Alberta, Ontario and Quebec. In 2004, Alberta accounted for 31 percent of total Canadian GHG emissions, and accounts for 34 percent in 2030. Ontario's share remains 27 percent, while Quebec's share rises from 13 to 15 percent.
Greenhouse gas levels do increase in Canada but the GHG emissions intensity in Canada declines over the outlook period (Figure 4.24). In Continuing Trends, the GHG emissions intensity decline at 1.3 percent per year, which is slightly more rapid than the historical rate of 1.1 percent as energy efficiency improvements take place and alternative and emerging fuel use increases.
Figure 4.24
Canadian Total GHG Intensity – Continuing Trends

Continuing Trends Issues and Implications
- Strong energy demand growth and changing energy supply profiles will require investments in additional infrastructure. The development of this infrastructure is contingent on public acceptance.
- Oil sands are expected to account for over 85 percent of the total Canadian oil supply by 2030 requiring sufficient take-away pipeline capacity and the development of additional markets.
- The decline in conventional natural gas production and growing gas demand for oil sands in Western Canada result in a gradual decline in the volume of gas exiting Western Canada. Gas flows outside Western Canada might readjust as a result.
- As well, gas flow patterns and utilization of transmission infrastructure will change across North America, as LNG imports enter coastal markets and production shifts between regions. The growing share of LNG imports will increasingly link North American natural gas markets to the rest of the world. Current LNG supplies are tight, but major capacity additions are under construction or planned.
- Significant development of transmission lines will be required.
- Canada's role as a net gas exporter will gradually change to net importer by the end of the period. This could have implications for the balance of trade, although growing crude oil exports should compensate.
- The key risks and uncertainties surrounding the Continuing Trends outlook include:
- Oil sands production is assumed for Saskatchewan in 2017. Although initial exploration is promising, no official reserves have been published, so this assumption remains speculative.
- Energy demand management policies are not as well developed in this scenario as in other scenarios. Policies and programs that are in place at the beginning of the outlook period are carried forward until the end of the scenario. However, programs that are under development or are being contemplated are not included. Increased consumer awareness and support for environmental issues makes the implementation of these types of programs more likely and is a potential risk associated with the Continuing Trends Scenario.
- Date modified: