ARCHIVED - Canada's Energy Future - Reference Case and Scenarios to 2030 - Energy Market Assessment
This page has been archived on the Web
Information identified as archived is provided for reference, research or recordkeeping purposes. It is not subject to the Government of Canada Web Standards and has not been altered or updated since it was archived. Please contact us to request a format other than those available.
Chapter 3: Reference Case

Reference Case Overview (2005-2015)
The Reference Case is the National Energy Board's (the NEB or the Board) view of the most likely development of energy demand and supply over the next ten years given current energy market trends, the assumed macroeconomic outlook, assumed energy prices and the existing suite of government programs[28].
[28] The government programs considered are only those that are fully articulated and currently employed. Announced programs, such as the federal government's intention to finalize regulations for industrial air emissions by 2010, are not included in the Reference Case. New programs will be considered in the Reference Case of subsequent reports of Canada's Energy Future as they are adopted. In this report, consideration of these announced programs are only accounted for in the Triple E Scenario.
Macroeconomic Outlook
The macroeconomic outlook provides information on the Canadian economy necessary to develop energy demand and supply projections. Key drivers include total goods and services produced, disposable income, population, productivity and financial indicators[29].
[29] Using inputs such as the Reference Case assumptions and scenario storylines, as outlined in Chapters 3 to 6, Informetrica Limited provided the macroeconomic forecast for the Reference Case and scenarios.
Canadian long-term economic growth is dependent on labour force and productivity assumptions. The more rapidly the labour force or productivity levels grow, the higher the pace of economic growth, all other factors held constant. A common thread across the three scenarios is a notable deceleration of growth in the labour force that intensifies over the projection period. This result is driven by demographic factors, such as an ageing population and low birth rates. Altering levels of immigration across scenarios provide variations in the demography, but it does not reverse the overall trend.
In the Reference Case, it is assumed that population growth slows over the next 10 years to 0.8 percent per year from 1.0 percent per year from 1990 to 2004 (Table 3.1). This poses implications for labour force growth, which also slows to 1.1 percent per year from 1.3 percent per year. It is also assumed that productivity, measured as output per employee, improves to 1.6 percent per year over the Reference Case period.
Table 3.1
Key Macroeconomic Variables – Reference Case 2004-2015[1]
| 1990-2004 | 2004-2015 | |
|---|---|---|
| Population | 1.0 | 0.8 |
| Labour force | 1.3 | 1.1 |
| Productivity | 1.4 | 1.6 |
| Gross domestic product | 2.8 | 2.9 |
| Goods | 2.5 | 3.1 |
| Service | 3.0 | 2.8 |
| Real disposable income | 1.6 | 3.0 |
| Exchange rate (average cents US/Cdn dollar) | 74 | 93 |
| Inflation Rate (average %) | 2.3 | 1.7 |
| [1] Comparing personal disposable income growth over the forecast period to the historic period of 1990 to 2004 is
somewhat misleading because this historic time period captures two relatively low periods of growth, including the recession in the early 1990s, and Federal and provincial government policies of actively reducing Canadian debt. (Annual Average Growth Rate (% per year) unless otherwise specified). |
||
As a result, there is continued strong growth in Canadian gross domestic product (GDP) of 2.9 percent per year. The continued strong economic growth translates into personal disposable income growth of 3.0 percent per year.
By 2015, there is no change in the relative share of the goods producing industry or service sector compared to 2004 levels. The goods producing industry continues to account for roughly one-third of gross domestic product (GDP) and the service sector accounts for two-thirds. The regional distribution of Canadian economic growth has important implications for the energy demand projection because industries and regions have built-in biases for certain fuels.
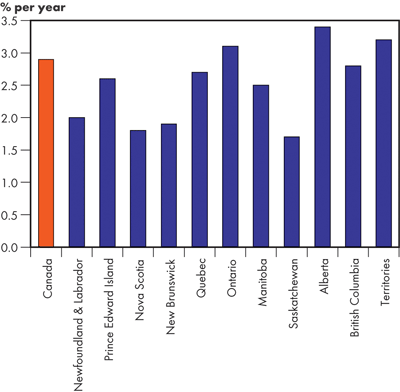
The Reference Case shows economic growth in Canada being led by Ontario, Alberta, Northwest Territories and British Columbia, consistent with trends over the last 15 years (Figure 3.1).
Figure 3.1
Real GDP Growth Rates – Reference Case 2004-2015
Energy Prices
Crude Oil Prices
Although Canada is ranked as one of the largest oil producers in the world, Canada produces less than three percent of total daily world production and is therefore a price-taker. The West Texas intermediate (WTI) crude oil price at Cushing, Oklahoma is one of the major world benchmarks for crude oil. Canadian crude is priced relative to WTI because the U.S. has traditionally been Canada's main export market. The U.S. is also the world's largest market for crude oil.
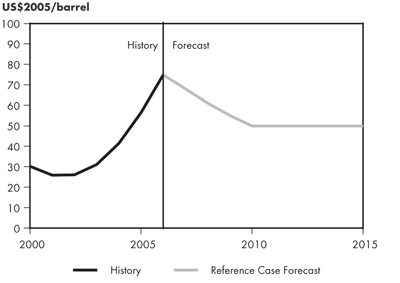
Crude oil prices are determined by the interaction of energy supply and demand. As discussed in Chapter 2, there has been a significant increase in energy prices in recent years as a result of high global energy demand and tight energy supply. It is expected that higher energy prices would encourage conservation and bring on additional supplies of energy leading to a moderation of energy prices in the near term. The Reference Case assumes that real crude oil prices will decrease from the high levels experienced in recent years to US$50/barrel and remain at this level until the end of the reference period (Figure 3.2).
Figure 3.2
West Texas Intermediate Crude Oil Price at Cushing, Oklahoma – Reference Case
Conventional heavy oil and bitumen blends command a lower market value than light oil because they are more difficult to refine and yield fewer high-value products. The light/heavy oil differential varies depending on supply and demand conditions and refining values in major markets. The assumption of a light/heavy differential of 30 percent is based on the historical average over the last decade and is applied in the Reference Case and all three scenarios.
Natural Gas Prices
Natural gas prices are primarily determined on a continental basis as a result of the integrated nature of the North American natural gas demand and supply market, and limited import capacity and liquidity in the global liquefied natural gas (LNG) market. Demand is primarily affected by weather and competing fuel prices. Some industrial demand has the capability to switch between using oil or natural gas, particularly in the U.S. Northeast. As a result, natural gas prices tend to track crude oil prices[30]. In the Reference Case, the historic relationship between natural gas and crude oil continues with natural gas at 84 percent of the crude oil price, at a 6:1 energy content parity (roughly 6 MMBtu of natural gas per barrel of crude oil). This results in a Henry Hub (Louisiana) price of natural gas at US$6.65/GJ (US$7/MMBtu).
[30] No. 2 heating oil generally provides an upper bound, while 1 percent sulphur residual fuel oil (RFO) generally provides a lower bound.
Figure 3.3
Natural Gas Price at Henry Hub, Louisiana – Reference Case
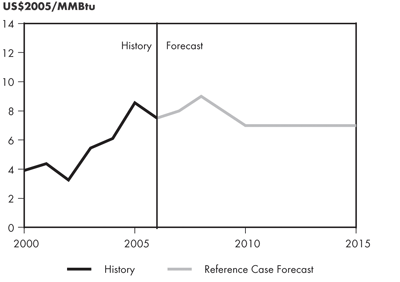
This assumed natural gas price level is relatively close to the average index price for Canadian gas supply over the 2003 to 2006 period (measured by the Nova Inventory Transfer [NIT] price in Alberta). This level of pricing is considerably higher than average annual price over the last decade and reflects the expectation of tighter North American supply and demand balance.
Electricity Prices
Electricity prices are determined in regional markets. Consumer prices for electricity are composed of generation, transmission and distribution costs. Prices are lowest in the hydro-based provinces (e.g., British Columbia, Manitoba, and Quebec), which benefit from a high proportion of low-cost heritage assets, such as hydro generating stations that are often many decades old and whose capital costs are largely amortised[31]. For example, in Quebec the supply price of the heritage portion (165 TW.h) is set by law at 2.79 cents/k.Wh. In 2006-2007, this heritage portion will account for 95 percent of the electricity distributed by Hydro-Québec, and the cost of the remaining 5 percent will reflect market prices.
[31] Heritage assets are an amount of energy and capacity determined by the existing generation assets that resulted from past decisions under a previous market regime. This energy is generally sold into the marketplace at a price reflecting historical costs.
Prices in most jurisdictions are based on the cost of providing service to consumers including a regulated rate of return on generation, transmission and distribution assets. Costs are approved by provincial and, in some cases, municipal regulators. When required, the cost of new generation, usually higher than heritage costs, must also be approved and rolled in, resulting in higher average costs. This model is followed in all provinces and the territories except Alberta, where generation costs are based on competitive wholesale markets. Ontario is a hybrid of the two methodologies, with a blend of heritage pricing for coal, nuclear and hydro plants and market-based prices for new generation.
Within a given province, prices tend to be higher for residential customers and lower for large volume commercial and industrial customers, reflecting the cost of serving these markets. In addition, large customers may have access to power at lower costs than can be obtained from the provincial or municipal electric utility. This requires open access to transmission systems (or wholesale access). All provinces have some form of wholesale access.
In the Reference Case, prices rise steadily as increasing demand requires new generation to be added at higher cost. Depending on the province, new generation facilities include a diversity of conventional technologies, including natural-gas-fired generation, coal-fired units, and nuclear refurbishments as well as alternative or emerging technologies, including wind or biomass.
Coal Prices
Canadian coal prices for power generation vary substantially by region, with prices in Western Canada being generally lower, reflecting the cost of integrated mining and power generation (mine mouth power plants). Prices of coal imported to Nova Scotia, New Brunswick and Ontario reflect the competitive international market. Western Canadian coal is not usually competitive in Ontario, after taking into account quality differences and transportation costs.
In the near term, high oil and gas prices inflate coal prices. However, through the Reference period it is expected competitive pressures and productivity increases in mining and rail transportation will result in price declines.
Energy Demand
The outlook for energy demand is determined by the macroeconomic environment, energy prices, energy efficiency improvements, government policies and the weather[32]. The Reference Case is based primarily on historic trends. There has been an unprecedented rate of technological change in the last few decades and this trend is expected to continue. The trajectory of future technological improvements is based on the historical rate of change.
[32] Weather assumptions are based on climate normals, which assume a 30-year historical average.
The Reference Case acknowledges literally hundreds of energy efficiency, demand management, research and development, emerging or alternative energy programs and policies that were in place in Canada at the start of the outlook period.
Total Secondary Energy Demand Trends
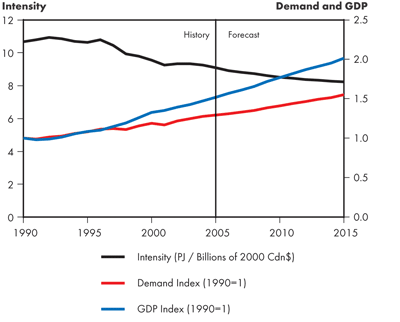
Canadian total secondary (or end-use) energy demand for the Reference Case grows at 1.8 percent over the 2004 to 2015 period and the energy intensity of the Canadian economy improves by 1.1 percent per year (Figure 3.4). This intensity improvement reflects higher energy prices in the Reference Case than has been historically experienced. As a result, there is an increase in the uptake of the more readily-accessible energy efficiency improvements, as well as more energy conservation action than witnessed in the last 15 years. Despite this, energy demand continues to be robust. Overall, energy demand remains defined by established devices, industries, services and habits. Projected strong economic and income growth maintain energy demand growth levels.
One of the fastest and most significant areas of energy demand growth is projected to be in the energy producing sector, particularly in the oil sands. As a result, Alberta's share of total Canadian energy demand in 2015 shows the greatest increase, from 26 to 30 percent, which puts Alberta's energy demand on par with Ontario, also at 30 percent[33].
[33] Appendix 2 contains detailed energy demand information by province.
Figure 3.4
Canadian Total Secondary Energy Demand Intensity – Reference Case
Residential Secondary Energy Demand
Canadian residential secondary energy demand grows at 1.8 percent per year over the Reference Case (Figure 3.5). Higher personal disposable income translates into increased consumer spending on larger homes, appliances, electronics, and lighting. This profusion of consumer goods outweighs energy efficiency gains and leads to residential energy demand growth.
Figure 3.5
Canadian Residential Secondary Energy Demand by Fuel – Reference Case

Regional availability of fuel, energy prices, and end-use demand determines the mix of fuel that is used across Canada. Space and water heating account for approximately 80 percent of residential energy demand. In Atlantic Canada, residential demand has been met with electricity, oil and biomass as natural gas was historically unavailable. Hydro-rich provinces, such as Quebec, Ontario, Manitoba and British Columbia, rely more heavily on electricity to meet residential energy demand than other provinces, as electricity prices tend to be competitive with other fuels. Similarly, Alberta and Saskatchewan rely more heavily on natural gas than other regions as there is an abundant supply of this fuel in the region.
Some fuel-switching occurs over the Reference Case. Higher electricity prices in the forecast moderate some of the electricity demand growth that would occur as a result of higher personal disposable income. Moderate natural gas prices encourage further expansion of gas networks.
In recent years, residential and commercial natural gas infrastructure has been constructed in Nova Scotia and New Brunswick. High natural gas prices in 2005 and 2006 as a result of Hurricanes Katrina and Rita resulted in a slowing of natural gas demand in the provinces. However, the more moderate natural gas prices in the Reference Case are assumed to allow for further penetration of natural gas in the residential market. By 2015, natural gas accounts for two percent of residential energy demand in Nova Scotia and five percent in New Brunswick.
Residential energy demand is highly influenced by weather trends. A warmer winter will result in decreased energy demand as space heating requirements are lower and a warmer summer will result in increased demand for space cooling. This influence can be seen in the jagged historic energy demand profile for the residential sector in Figure 3.5. It is important to note that the NEB assumes normal weather patterns, which is to say weather follows the 30-year historic average. Over the last decade, Canadian temperatures have been warmer than the 30-year average would suggest. Therefore, residential energy demand could be incorrectly estimated if weather patterns during the outlook period are more similar to the past 10 years than they are to the 30-year historic average.[34]
[34] An exact estimate of the degree of error is unavailable. However, the Office of Energy Efficiency estimates that changes in weather accounted for between a 2 percent decrease and a 4 percent increase in residential energy demand between 1997 and 2004.
Commercial Secondary Energy Demand
Canadian commercial secondary energy demand is projected to grow at 1.4 percent per year over the 2004 to 2015 period (Figure 3.6). More moderate service industry economic growth and higher energy prices drive this result. Energy prices in the Reference Case are expected to trigger an energy demand response in the commercial sector where there is still considerable energy efficiency potential.
Figure 3.6
Canadian Commercial Secondary Energy Demand by Fuel – Reference Case

As with the residential sector, fuel shares reflect regional availability and markets. Generally, the fuel shares over the forecast period remain fairly constant, although there is some shifting into natural gas demand as a result of the higher electricity prices[35].
[35] Some commercial sector data allocation issues may also distort fuel shares. Historically, the commercial sector acts as a catch-all for miscellaneous energy demands and, as a result, commercial oil shares have been increasing over the last few years.
Industrial Secondary Energy Demand
Canadian industrial secondary energy demand grows at a moderate rate of two percent per year over the 2004 to 2015 period (Figure 3.7). The industrial sector consists of energy demand from manufacturing, forestry, fisheries, agriculture, construction, and mining. The majority of industrial energy demand is found in a handful of energy-intensive industries, such as iron and steel, aluminium manufacturing, cement manufacturing, chemicals and fertilizers, pulp and paper, petroleum refining, and oil and gas extraction[36]. These relatively mature industries are facing increasing global competition and higher Canadian exchange rates. These economic factors temper energy demand growth.
[36] In 2004, energy-intensive industries accounted for 80 percent of industrial energy demand. Industries outside of energy-intensive industries, such as light manufacturing, agriculture, forestry and construction, each account for a relatively small proportion of industrial energy demand, but taken together they account for about 20 percent.
Figure 3.7
Canadian Industrial Secondary Energy Demand by Fuel – Reference Case

('Other' fuel includes coal, coke, coke oven gas, steam, naphtha)
One notable exception to the large-industry demand trend is the oil and gas industry. The strength of this industry drives much of the industrial sector energy demand growth. Oil sands operations are energy intensive, requiring significant amounts of natural gas, as well as other fuels, such as oil (e.g., still gas, petroleum coke, diesel[37]) and electricity. Energy demand expectations are dependent on the oil sands production outlook, which is discussed in more detail in the oil section. A discussion of energy requirements for the oil sands industry can also be found in this section.
[37] For the purposes of this report, diesel fuel use is captured under off-road transportation.
In 2015, Alberta accounts for 44 percent of industrial energy demand in Canada and 86 percent of this demand is from the oil and gas industries. Ontario is the second largest at 24 percent and Quebec follows at 15 percent. Fuel shares by province vary significantly, depending on the types of industries and their energy intensities, along with the availability of fuels.
Transportation Energy Demand
Canadian transportation energy demand grows at 1.6 percent per year over the 2004 to 2015 period (Figure 3.8). This is slightly lower than the historical rate of 1.9 percent, and indicates energy efficiency effects tempering increased personal income and GDP growth effects. This sector is driven by macroeconomic conditions, energy prices and government standards.
The transportation sector is split into six different modes, including passenger transportation, on-road freight transportation, off-road transportation, rail, air and marine (Figure 3.9). Passenger transportation is the largest subsector and is primarily fueled by motor gasoline. Ethanol and other transportation fuels make up a very small component of passenger transportation demand. The ethanol share grows from near zero percent to one percent by 2015 due to the planned ethanol policies in Ontario and Saskatchewan[38]. The moderate energy prices in the Reference Case combined with strong personal disposable income growth leads to strong passenger transportation and gasoline demand growth.
[38] The Ontario assumption is 5 percent ethanol volume (3.4 percent energy) of total gasoline use in the province by 2007. The Saskatchewan assumption is 7.5 percent ethanol volume (5.1 percent energy) of total gasoline use in the province by 2007.
Figure 3.8
Canadian Transportation Energy Demand by Fuel – Reference Case
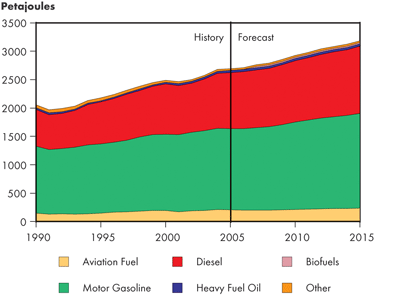
Figure 3.9
Canadian Transportation Energy Demand by Mode – Reference Case
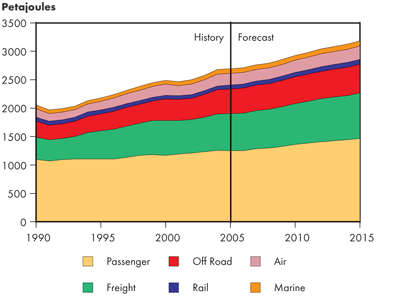
On-road freight and off-road transportation is primarily fueled by diesel. Strong industrial growth drives an increase in freight volumes, which in turn increases diesel consumption. Off-road transportation includes vehicle use that takes place primarily off paved or public roads, such as in agriculture, construction and mining activities. The off-road share remains strong due to projected growth in the oil sands, agriculture and construction industries.
In 2004, air, rail and marine demand accounted for roughly 14 percent of transportation energy demand. These shares are not expected to undergo significant changes over the Reference Case outlook.
Oil Supply
Crude Oil and Equivalent
Crude Oil and Bitumen Resources
Canadian crude oil and bitumen resources remain constant in the Reference Case and in all three scenarios. Current estimates place Canada's remaining established oil reserves at 28.2 billion cubic metres (178 billion barrels), with Alberta's oil sands deposits accounting for 27.5 billion cubic metres (173 billion barrels), and conventional oil reserves in the WCSB at 483 million cubic metres (3.0 billion barrels). At current rates of Canadian production, this equates to 181 years of supply. Eastern Canada and Frontier Area resources are estimated to be 211 million cubic metres (1.3 billion barrels)[39].
[39] Further detail on Canada's oil resources can be found in Appendix 3.
Total Canadian Oil Production
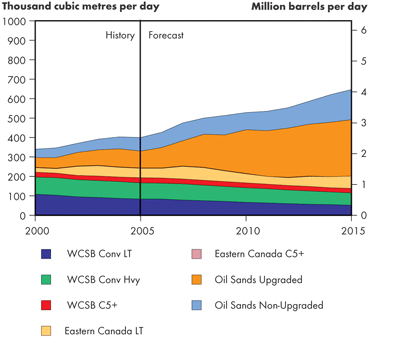
In the Reference Case, oil prices remain sufficiently buoyant and oil sands supply expands steadily. Declining Western Canada Sedimentary Basin (WCSB) conventional oil production is more than offset by increasing oil sands and east coast production. The east coast allotment would include connection of several satellite pools, as well as a new 80 million m³ (500 million b) discovery. By 2015, the Reference Case production levels increase by 61 percent above 2005 levels, reaching 642 000 m³/d (4.05 million b/d), which in today's terms would rank Canada as the world's fourth largest producer (Figure 3.10).
Figure 3.10
Total Canada Oil Production – Reference Case
Conventional Crude Oil - WCSB
The projections in the Reference Case are based on extrapolation of historical decline trends, consideration of remaining reserves, potential for new discoveries, potential for improved oil recovery (IOR) and trends in initial production rates for new wells.
The high oil-to-gas price ratio has resulted in a shift to more oil-directed drilling. As well, recent success in exploiting the Bakken oil deposits of the Williston Basin in southeast Saskatchewan and in southwestern Manitoba has led to increased light crude oil production. The effect of these events is a softening of the production decline in the WCSB for several years, after which historical decline trends are expected to resume, consistent with a mature supply basin and the level of remaining reserves.
Due to the WCSB being a mature supply basin, exploration efforts yield increasingly smaller pools, but development drilling and IOR, primarily waterflooding, make up a larger portion of reserves additions.
Following the success of IOR through carbon dioxide (CO2) flooding at the Weyburn and Midale Fields in Saskatchewan, it is expected that CO2 flooding in mature oil reservoirs will increase across the WCSB.
Figure 3.11
WCSB Conventional Oil Production – Reference Case
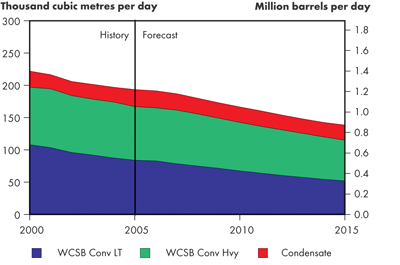
In the Reference Case, production of conventional crude oil and equivalent from the WCSB is projected to resume its decline in the 2009-2010 timeframe, for both light and heavy crude oil, with 2015 production levels of 52 000 m³/d (328 thousand b/d) for conventional light crude oil and 63 300 m³/d (399 thousand b/d) for conventional heavy crude oil (Figure 3.11). By 2015, conventional crude oil from the WCSB has declined by about 30 percent compared to 2005 production levels. Condensate is derived primarily from the processing of natural gas; therefore, projections of condensate production are consistent with the natural gas production projections. In the Reference Case, condensate production levels decline to 22 300 m³/d. (140 thousand b/d) by 2015.
Eastern Canada Light Crude Production
Projections for eastern Canada oil production are dominated by the east coast offshore, with only minor amounts of production expected from Ontario.
Figure 3.12
Eastern Canada Light Crude Production – Reference Case

The White Rose Field offshore Newfoundland and Labrador became the third producing field in 2005, after Hibernia and Terra Nova. Total production levels are predicted to reach 66 000 m³/d (416 thousand b/d) in 2007, as White Rose expands and Terra Nova returns to full capacity after maintenance work in 2006 (Figure 3.12). The Hebron Field begins production in 2013. Contributions from smaller satellite pools in the Jeanne d'Arc Basin are also included, beginning in 2010[40].
[40] The estimates presented above reflect the thinking at the time of analysis. Some of these estimates are speculative and may need revisions as more information is received. These revisions will be reflected in the Board's future analyses.
It is also assumed that a new 80 million m³ (500 million b) field is found in the relatively unexplored regions of the East Coast, potentially in the Flemish Pass region or in the Deepwater Scotian Shelf. The pool comes on-stream in 2015, increasing production levels to 75 000 m³/d (473 thousand b/d).
Oil Sands Supply
The projections of oil sands derived production in the Reference Case are largely based on the June 2006 NEB Energy Market Assessment (EMA) titled, Canada's Oil Sands - Opportunities and Challenges to 2015: An Update.
The energy prices assumed in the Reference Case generate sufficient cash flow for oil sands operators to actively expand production levels. Bitumen supply is derived from surface mining and in-situ recovery operations. The bulk of in-situ supply comes from steam assisted gravity drainage (SAGD) and cyclic steam stimulation (CSS) thermal processes, while the contribution from the toe-to-heel air injection (THAITM) and vapourized extraction (VAPEX) processes is anticipated to increase over time. Primary or 'cold production' levels are assumed to increase at an annual rate of one percent over the course of the projection.
Figure 3.13
Canadian Oil Sands Production – Reference Case
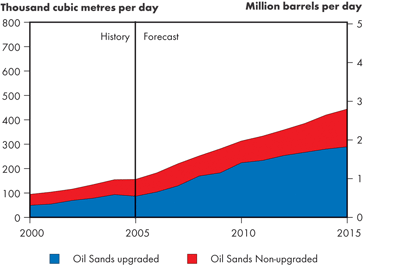
Upgraded bitumen supply includes bitumen from mining, in-situ and primary sources. This upgraded supply includes shipments to dedicated (on-site) and stand-alone (Edmonton refinery corridor) upgraders. Upgraded bitumen levels expand to 290 000 m³/d (1.82 million b/d) by 2015 and represent 65 percent of total bitumen supply (Figure 3.13). The non-upgraded bitumen supply falls as a result of additional upgrading capacity coming on-stream. In the Reference Case, non-upgraded bitumen levels expand to 154 000 m³/d (970 thousand b/d) by 2015.
The oil sands industry is a large user of natural gas and has been seeking ways to reduce its dependence on this fuel. Over the past decade, the energy efficiency in oil sands operations has improved on the order of one percent annually. In the Reference Case, this rate of improvement is maintained to 2015. In addition, the adoption of alternative fuels in certain new projects is considered. Bitumen gasification will provide the bulk of the fuel requirements and feedstock for the OPTI/Nexen Long Lake SAGD/Upgrader project, scheduled to begin operations in 2007. It is assumed that the application of bitumen gasification will gradually gain momentum in both in-situ and upgrading operations. As well, the application of the THAITM and Multiphase Superfine Atomized Residue (MSAR) technologies will begin to play a role in the 2010-2012 timeframe. In the Reference Case, the purchased natural gas intensity is reduced from 0.67 Mcf/b in 2005 to 0.59 Mcf/b in 2015. Total purchased natural gas requirements, excluding on-site electricity requirements, increase from 18.4 million m³/d (0.65 Bcf/d) in 2005 to 51.0 million m³/d (1.8 Bcf/d) by 2015.
Oil Sands Opportunities and Challenges
Worldwide economic growth and the consequent construction boom that has resulted in sharp increases in demand for labour and in prices of construction materials, especially steel and cement, combined with a very active construction environment in Alberta, has led to increased construction costs in the province. Oil sands developers are acutely aware of the challenges in construction and commissioning of large facilities. An overheated economy has resulted in shortages of engineers, project managers, skilled labour, trades and even materials. In addition, the influx of capital and people have severely strained supporting infrastructure, as shortage of schools, housing, healthcare and other essentials have impacted budgets and timelines. The result has been an escalation in capital costs for oil sands producers in the order of 40 to 50 percent over the last two years. For example, capital costs for adding integrated mining and upgrading capacity, to come on in the 2010-2011 timeframe, are estimated to be in the range of $80 000 to $100 000 per flowing barrel.
Volatile oil and gas prices, as well as volatile light/heavy crude oil price differentials, add considerable risk in predicting rates of return on investment for oil sands projects. In addition, because the oil price is denominated in U.S. dollars, a stronger Canadian dollar has a significant negative impact on project economics. Recent changes in tax policy, concerning removal of the Accelerated Capital Cost Allowance (ACCA) have also had an effect.
The oil sands industry faces additional uncertainties regarding environmental compliance, as both provincial and federal government regulations regarding greenhouse gas (GHG) emissions are not yet fully defined. Provincial regulations concerning water use, air quality, and land use are also not yet fully defined. As well, Alberta’s provincial government has undertaken a review of oil and gas royalties, including oil sands royalties, with a final report to be released in the fall of 2007.
These challenges have slowed the pace of activity somewhat, and a number of companies are reassessing the economics of their projects.
The challenges faced by the oil sands industry are counter-balanced by the opportunities. At a time of increasing resource nationalism around the world, Canada’s huge oil sands reserves, set in a climate of relatively stable political and economic policy, represent an attractive target for investment. The potential for technological innovation to reduce the costs of bitumen extraction and upgrading is an additional attraction. Given the outlook for continued higher oil prices, return on investment should be sufficient to drive oil sands expansion.
Supply and Demand Balances
The crude oil feedstock requirements for Canadian refineries are based on projected demand and assumed levels of exports and imports of petroleum products. Total domestic demand for petroleum products was 290 900 m³/d (1.83 million b/d) in 2005. By 2015, it increases to 392 400 m³/d (2.47 million b/d).
Canada's refineries are located in four main regions: Western Canada, Ontario, Quebec and Atlantic Canada. There is very little spare processing capacity in Canada. Two of the three refineries in Atlantic Canada produce petroleum products primarily destined for the export market. With the exception of Shell Canada's refinery in Scotford, Alberta, most Canadian refineries are over 30 years old. The Reference Case assumes most companies will focus on optimizing production and flow-through at existing refineries rather than investing in new refineries.
Refineries in Quebec and the Atlantic do not have access to western Canadian crude oil and rely on imports for most of their feedstock requirements. East Coast offshore production can reach Ontario and Quebec; however, the suitability of the crude quality and stability of supply, combined with import economics, will limit the displacement of imported volumes in these markets.
Light Crude Oil[41] - Supply and Demand Balance
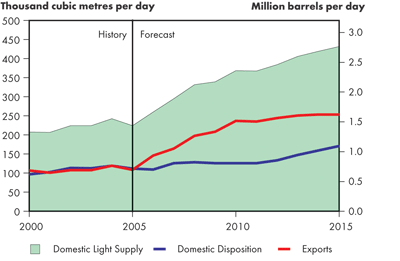
Exports of light crude oil increase steeply from 110 200 m³/d (694 thousand b/d) in 2005 to 258 300 m³/d (1.63 million b/d) in 2015 (Figure 3.14). Most of the refineries in Western Canada will run greater volumes of synthetic crude oil, which will displace potentially 11 700 m³/d (74 thousand b/d) of conventional light crude oil that could, in turn, be exported.
[41] To remain consistent with Statistics Canada (StatCan) data, 'light crude oil' refers to all crude oil of 26 API and greater while 'heavy crude oil' refers to all crude less than 26 API. This report reclassifies the export statistics currently available on the NEB website, which combines medium crude oil, with an API between 25 and 30, with heavy crude oil.
Figure 3.14
Supply and Demand Balance, Light Crude Oil – Reference Case
Heavy Crude Oil - Supply and Demand Balance
Exports of heavy crude oil increase from 149 200 m³/d (940 thousand b/d) in 2005 to 178 900 m³/d (1.13 million b/d) in 2015 but vary somewhat during the forecast period (Figure 3.15). It is assumed that some of the refineries in Western Canada will also be able to process some bitumen directly, which translates into increased domestic demand for heavy crude oil.
Figure 3.15
Supply and Demand Balance, Heavy Crude Oil – Reference Case

Natural Gas Supply
Canadian Natural Gas Resource Base
Under the pricing conditions of the Reference Case, Canada's remaining marketable natural gas resource base is estimated at 12 011 billion cubic metres (424 trillion cubic feet). Conventional gas in Western Canada represents almost a third of the remaining resource base and is expected to be the source of almost 80 percent of projected Canadian natural gas production through 2015.
Western Canada also contains significant unconventional natural gas resources, including coalbed methane (CBM), tight gas and shale gas. These unconventional natural gas resources comprise 1 841 billion cubic metres (65 trillion cubic feet) or 15 percent of estimated remaining natural gas resources.
Other natural gas resources are designated as frontier supply. Frontier resource areas are estimated to contain 6 374 billion cubic metres (225 trillion cubic feet) or 53 percent of Canada's remaining marketable natural gas resources, but only minor amounts are likely to be accessible within the time period of the Reference Case[42].
[42] A detailed breakdown of Canada's remaining marketable natural gas resource base is provided in Appendix 4.
Figure 3.16
Natural Gas Production Outlook – Reference Case
Production and LNG Imports
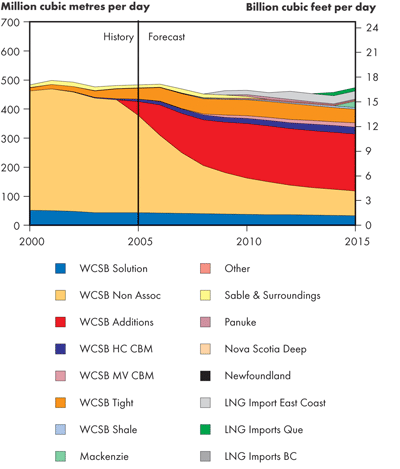
The Reference Case estimate of Canadian marketable natural gas production and LNG imports is indicated in Figure 3.16. Western Canada is expected to continue to be the primary source of gas production in the Reference Case. After lagging from 2006 to 2008, natural gas drilling in Western Canada recovers to roughly 18 000 gas wells per year by 2009 and will maintain that level through 2015. Natural gas drilling slowed in the second half of 2006 and into 2007 due to reduced margins resulting from escalating drilling costs and softening gas prices. A gradual recovery in natural gas drilling activity is expected to begin in 2008 as drilling costs weaken due to lower utilization (compounded by growth in the drilling rig fleet) and natural gas prices strengthen.
Unconventional Natural Gas
Unconventional gas includes CBM, tight gas, shale, and gas hydrates.
Coalbed methane consists of methane bonded or adsorbed into the large internal surface area of the coal. CBM resources are primarily located in the shallow Horseshoe Canyon Formation and the deeper Mannville Formation in Alberta.
Canada does not currently have a specific definition for tight gas. The usual practice has been to incorporate the estimated 368 billion cubic metres (13 trillion cubic feet) of resources in the low permeability or tight gas plays that are currently producing gas as conventional gas. For the purposes of this report, it is useful to recognize these volumes separately and the conventional category has been reduced accordingly. Further, the NEB believes that the gas resources attributed to these producing plays understates additional volumes that could also be recognized as tight gas and so has increased the remaining marketable natural gas resource estimate for the Reference Case to a total of 595 billion cubic metres (21 trillion cubic feet). Tight gas is expected to be producible from along the mountain front of Alberta and British Columbia in a region known as the 'Deep Basin', in the Jean Marie Formation of northeast B.C., and possibly in the shallow gas deposits of southeastern Alberta and southwestern Saskatchewan.
At present, there are no large scale production programs from shale horizons in Canada. Several shales in Western Canada qualify as targets and there is some ongoing testing of shales in select locations. Fracturing, both natural and induced, is generally required to provide flow pathways to the well bore. There are occasional wells in Alberta that do produce gas or oil from highly fractured shales. For the Reference Case, 244 billion cubic metres (8.6 trillion cubic feet) of remaining marketable resources have been assigned to shale gas.
Gas hydrates are another potential source of unconventional natural gas. Gas hydrates consist of methane molecules trapped in and encased by a cage of frozen water molecules. Gas hydrates are found at the ocean bottom or on land under permafrost areas. The likelihood of achieving commercial methane production from gas hydrates by 2030 is very low and so has not been included in the unconventional resource estimate.
Despite the resumption of strong drilling activity, a continued downward trend in new well productivity leads to a gradual decline in production over the period, as shown in Figure 3.16. Coalbed methane production in Western Canada increases steadily, reaching 38 million m³/d (1.4 Bcf/d) by 2015.
Conventional natural gas production from the East Coast contributes an average of 12.2 million m³/d (0.43 Bcf/d) over the Reference Case period and includes the Sable project offshore Nova Scotia, the onshore McCully field in New Brunswick, and CBM production in Nova Scotia. Also included is offshore production from the proposed Deep Panuke project starting in 2010, subject to the project obtaining regulatory approval and a commercial decision to proceed. Significant volumes of discovered gas are associated with offshore oil projects on the Grand Banks of Newfoundland, but this gas is expected to be used for reservoir pressure maintenance or otherwise stored in reservoirs until oil production slows down beyond the end of the Reference Case.
Three LNG import terminals are expected to be operational by 2015 with annual import volumes assumed to average 39.7 million m³/d (1.4 Bcf/d). Currently one LNG facility, and its connecting pipeline, has approvals and construction is under way with deliveries expected to start in 2008.
Supply and Demand Balance
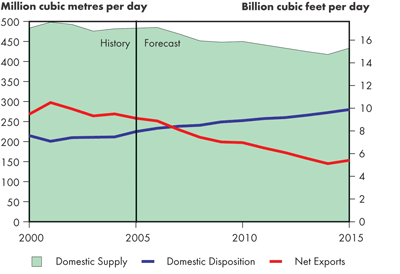
Demand for natural gas increases steadily in the Reference Case, led by gas use in expanding oil sands operations and greater use as a fuel to generate electricity. With production initially declining and then remaining relatively flat for much of the period, rising gas demand results in a gradual tightening between supply and demand (Figure 3.17). While physical export and import flows of natural gas between Canada and the U.S. will likely vary from year to year and between specific regions on the basis of relative market conditions, a gradual reduction in net natural gas export capability is a consequence of the Canadian production and demand projections in the Reference Case.
Although not part of the analysis for this report, any reduction in net Canadian gas exports over the period is likely to be offset by increased LNG imports into the U.S. and by growing U.S. unconventional gas production. As a result, relatively balanced supply and demand conditions are expected to persist in North American natural gas markets over the Reference Case period and maintain an average gas price of $6.65/GJ (US$7.00/ MMBtu).
Figure 3.17
Supply and Demand Balance, Natural Gas – Reference Case
Natural Gas Liquids
Supply and Disposition
The natural gas liquids supply outlooks are primarily derived from the natural gas production outlooks[43]. However, a portion of propane and butane supply comes from oil refining. Therefore, as gas declines and oil production increases in all scenarios, the share of natural gas liquids (NGL) from oil increases.
[43] Liquids associated with LNG are assumed to remain in the natural gas stream and therefore do not contribute to Canadian NGL supply in any scenario.
Under all scenarios, extraction of liquids from natural gas is assumed to be economic over the long-term given the price assumptions. In addition, NGL volumes are augmented by liquids extracted from Mackenzie Delta gas, (subject to regulatory approval and a commercial decision to proceed), oil sands off-gas, as well as enhanced deep-cut expansion at Alberta straddle plants. The enhanced deep-cut and off-gas sources reflect the Alberta government's Incremental Ethane Extraction Policy (IEEP) introduced in 2006.
In the Reference Case, excess volumes of propane and butane are available for export throughout the entire projection period. The butane supply and demand balance becomes tight in the middle of the outlook period; however, demand for butane as bitumen diluent is assumed to disappear around 2015. The commencement of service on one or two of the currently proposed condensate import lines would result in the loss of butane diluent demand[44].
[44] Further detail on propane and butane supply, demand and potential exports can be found in Appendix 3.
Ethane Supply and Demand Balances
The ethane supply and demand balance is expected to be tight early in the period, as supply declines with the decrease in conventional WCSB natural gas production and little incremental supply is available from oil sands off-gas or extraction facility expansions (Figure 3.18). The tightness is likely to ease by 2010, as new ethane extraction facilities and oil sands off-gas add about 5 800 m³/d (36 thousand b/d) of incremental ethane with another 6 600 m³/d (42 thousand b/d) added in 2015. Consequently, a small amount of excess supply is available for export during the period of 2010 to 2015.
Figure 3.18
Canadian Ethane Supply and Demand Balance – Reference Case
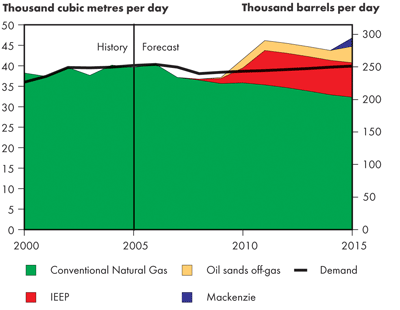
The ethane supply outlook does not include ethane from the East Coast, British Columbia offshore, or Arctic Islands resources – this is the case under all scenarios. In addition, there is insufficient ethane to support development of a petrochemical industry in the Atlantic Provinces. As a result, in the Reference Case and the scenarios, ethane is left in the natural gas streams in these areas.
Of the ethane extracted in 2005, about 94 percent was consumed by the Alberta petrochemical sector as feedstock to produce ethylene, with the remaining volume used for IOR miscible flood projects or shipped to other provinces. Demand for ethane is projected to grow at a slow rate, as the ethylene market in North America is considered to be saturated; therefore, it is assumed that no new ethylene plants will be built during the forecast period under all scenarios. Some volumes of propane are currently being used to supplement ethane supplies at petrochemical facilities, and this is expected to continue through the forecast period.
Electricity Supply
Capacity and Generation
Generation capacity increases by 18 percent between 2005 and 2015 (Figure 3.19). These capacity additions are required to meet projected load requirements during peak periods, while maintaining adequate reserve margins for reliability. Generation growth averages two percent annually over the period, with new electricity supply coming from both traditional and emerging sources. Investment requirements are being examined using a portfolio approach that considers a variety of factors in addition to cost, such as environmental impact, fuel price volatility and security of supply. This approach will enable investments in projects of all types, including conventional sources such as large hydro, nuclear, natural gas, coal and oil emerging technologies such as wind, biomass, solar, tidal and small hydro.
Hydro
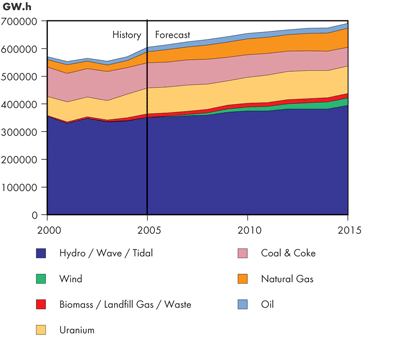
Hydroelectric generation will continue to be the major source of electricity during the Reference Case timeframe, increasing its share from about 60 percent of Canadian electricity generation to 65 percent (Figure 3.20). Hydro-based capacity, excluding small hydro is projected to reach 79 300 MW by 2015, an increase of roughly 7 600 MW from 2005.
Figure 3.19
Canadian Generating Capacity – Reference Case
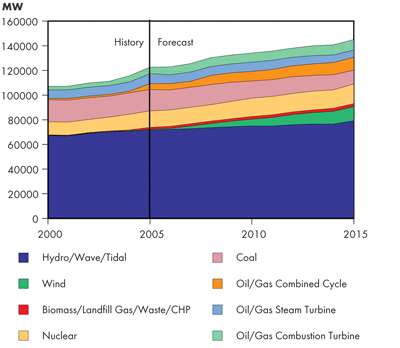
Figure 3.20
Canadian Generation – Reference Case
There will be extensive development of new hydro projects in Quebec, Manitoba, British Columbia and Newfoundland and Labrador and smaller hydroelectric projects in Alberta and Ontario. The Reference Case assumes that the 2 260 MW Lower Churchill facility in Newfoundland and the 200 MW Wuskwatim project in Manitoba are built, and that announced hydro projects, including expansion of existing facilities, in Quebec (3 194 MW) and British Columbia (1 389 MW) are constructed.
Many of these projects are located far from the customer base and will require major transmission investments.
Nuclear
Total nuclear capacity increases by 2 650 MW (20 percent) during the period of the Reference Case. Nuclear additions occur in Ontario, with the return to service of two 825 MW Bruce A units in 2009 and 2010, and the subsequent construction of a 1 000 MW Advanced Canadian Deuterium (CANDU) reactor (ACR) in 2015 to replace retiring coal units. It is assumed that the Point Lepreau (New Brunswick) and Gentilly-2 (Quebec) generating stations will be refurbished.
Natural gas-fired
Investment in natural gas-fired generation is forecast to increase despite the rise in the relative level and volatility of natural gas prices. The following increments are forecast to occur during the period of the Reference Case: an additional 5 000 MW of combined-cycle generation; 3 000 MW of combustion turbine/cogeneration facilities; and a decrease of 1 400 MW of steam turbine generation. Such investments illustrate that natural gas will continue to be relied on to meet increased electricity demand. Annual natural gas-fired generation output is forecast to increase from 39 000 GW.h to 69 000 GW.h over the forecast period, increasing its share of total generation from seven percent to 11 percent.
In the near term, investment in combined-cycle generation is planned for Ontario, British Columbia, Saskatchewan and Newfoundland and Labrador. In Ontario, combined-cycle gas will be relied on to help meet demand following the phase out of coal-fired generation. In British Columbia, the Burrard steam turbine generator will either be converted to combined-cycle units or replaced with new combined-cycle generation. In Newfoundland, oil steam units will be replaced by a 360 MW combined-cycle oil-fired facility in 2012.
There is a general decrease in natural gas-fired steam generation as older plants are replaced by more efficient combined-cycle facilities, except in Ontario where some coal-fired generation is converted to natural gas.
Combustion turbine generation will be added in the Northwest Territories as part of the Mackenzie Valley pipeline project starting in 2015.
Also included in the combustion turbine total is cogeneration. Cogeneration units will be added in Alberta, Ontario and Quebec. Of note, 1 500 MW of natural gas and bitumen-fired cogeneration facilities are developed in Alberta in conjunction with the growing number of oil sands and in-situ bitumen projects. In Quebec, Bécancour is the only gas-fired generation addition.
Coal-fired
Total coal-fired generation capacity is projected to decrease by 36 percent or 6 300 MW in the Reference Case. As a result, coal's share of total generation will fall from 14 percent in 2005 to 8 percent in 2015. Output from coal-fired generation will decrease 27 percent. The largest change occurs in Ontario, as coal-fired generation decreases by 87 percent or 6 600 MW. During the period of the Reference Case, new conventional coal-fired generation will be constructed in Alberta and Nova Scotia.
At the time of writing, SaskPower (a Crown Corporation that is the principal supplier of electricity in Saskatchewan) was working on an innovative Clean Coal Project that would result in the construction of a 300 MW coal power plant that would have up to 90 percent of its CO2 emissions captured. Our analysis assumes that this unit comes into service in 2012. The experience gained will allow the addition of carbon capture and storage (CCS) systems to coal power plants built after 2018, although for economic reasons this technology is only widely employed in the Triple E Scenario.
Oil-fired
Oil-fired power facilities provide generation during peak demand periods or in areas where other fossil fuelled generation is not available, such as the Yukon, Nunavut and Northwest Territories. The Reference Case indicates declining shares of oil-fired generation, as older steam units are replaced with natural gas-fuelled combined-cycle generation.
Emerging Technologies
The term 'emerging technologies' includes all alternatives to traditional generation sources such as coal, hydro with storage, natural gas, oil and nuclear. The share of installed unconventional generation remains small relative to the more centralized conventional sources, yet large changes are expected to occur. Wind power experiences exceptionally strong growth, and total wind power capacity is projected to grow from 495 MW in 2005 to 11 400 MW by 2015. During the outlook period, the largest volume of wind power additions occur in Quebec (4 365 MW), Ontario (2 852 MW) and Alberta (1 140 MW). Output from wind generation shows a corresponding increase, from 945 GW.h in 2005 to 29 605 GW.h in 2015.
Other generation technologies, such as biomass, landfill gas, waste heat, solar and tidal grow by 50 percent to 812 MW. The majority of this output is from biomass.
Market-Based Prices for Electricity
Although there are some exceptions, the prices Canadians pay for electricity are based on regulated rates approved by provincial public utility boards. Such rates tend to be based on the historical costs of power developments (heritage assets) and are thus lower than the replacement, or marginal cost. With a preponderance of low-cost heritage hydro resources, this enables Canadians to enjoy among the lowest electricity prices in the developed countries. In contrast, electricity sales in interprovincial and international trade, occur at market-based prices, which are higher than provincially-regulated prices.
Regulated prices can be justified on the basis of the provincial market structure, where there is limited competition (in many provinces, electricity generation is dominated by Crown corporations) and a desire to maintain stable and reasonable prices. Some provinces have encouraged the development and use of low-cost power as an economic development strategy for attracting electric-intensive industry.
Proponents of market-based pricing argue that both consumers and producers need market signals to encourage efficient outcomes. For example, anticipated supply shortages would cause increasing prices, thus encouraging development of new supply and providing a signal to consumers to reduce consumption. Currently, Alberta and Ontario have made the most progress toward implementing market pricing for electricity consumers.
Exports, Imports and Interprovincial Transfers
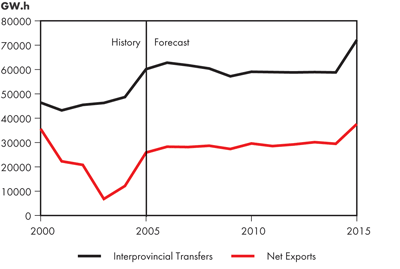
Canadian net exports increase by 32 per cent from 2006 to 37 600 GW.h in 2015, due in large part to the commissioning of the Lower Churchill hydro development in Labrador (Figure 3.21). This also leads to an increase in interprovincial transfers as this power must be wheeled through Quebec before it can be exported.
Figure 3.21
Interprovincial Transfers and Net Exports – Reference Case
Coal
Canadian Resources and Reserves
Coal resources include those deposits that occur in coal seams within specified limits of thickness and reflect the technical feasibility of exploitation and probable ultimate use. Ninety-eight percent of Canadian coal resources are found in Western Canada, of which over half consists of sub-bituminous deposits in Alberta (45 percent) and lignite in Saskatchewan (14 percent). Approximately 41 percent of western coal reserves are from bituminous and anthracite coal resources.
Supply and Demand
Global demand for total coal appears to have started slowing down in 2005. However, global thermal coal demand continues to be strong, particularly in developing countries that use coal for heat and electricity generation. Canada's 2005 domestic demand for coal is estimated to be slightly higher than the average level of the past decade. In 2005, Canadian electricity generation consumed about 51 Mt, of which 34 Mt was sourced domestically and 17 Mt was imported. Canada's steel, cement and other industries consumed about 4 Mt of coal. Canada produced about 68 Mt of coal in 2005, a slight increase over the past decade's coal production of 62 Mt. Canada exported 28.2 Mt of coal, a decrease from mid-1990 levels of 34 Mt.
Both nationally and internationally, there does not appear to be significant resource constraints on coal production. Canadian coal production is projected to decrease by about four percent by 2015. This decrease is primarily driven by a lower domestic demand in power generation, which accounts for 80 percent of Canadian coal consumption in 2015. Metallurgical coal production is forecast to increase by 13 percent between 2005 and 2015, while end-use and net exports are slated to increase by 16 and 59 percent respectively. Overall, Canadian production decreases to 60 Mt in 2015 from 68 Mt in 2005. Canadian coal production will be affected by power generation choices and the competitiveness of Canadian coal in international markets.
Between 2005 and 2015, the reduction of coal-fired generating capacity in Ontario leads to a decrease in domestic demand from 55 Mt in 2005 to 39 Mt in 2015. Canadian net exports of coal are expected to increase 65 percent between 2005 and 2015. The majority of increased exports will come from metallurgical coal used in the iron and steel industry.
In 2005, Canada exported coal to 21 countries on five continents, with an annual value of approximately $2 billion. Global thermal coal demand continues to be strong, particularly in developing countries that use coal for heat and electricity generation.
Greenhouse Gas Emissions
Heightened concern over climate change in recent years has led governments to develop policies to manage emissions. In addition, research and development is underway in an effort to develop more energy efficient equipment and other technological solutions, such as CCS, to reduce GHG emissions. In Canada, many of these programs, policies and technologies are still in the development phase and are therefore not included in the Reference Case or in the Continuing Trends Scenario. Instead, the significant impact that these programs will have on future energy demand and supply trends is explored in the Triple E Scenario.
Greenhouse gas emissions are a function of population, economic growth and energy demand decisions. In the Reference Case, increasing population and economic growth lead to increases in energy demand. As well, GHG intensive fuels, such as refined petroleum products continue to play a dominant role in meeting Canadian's growing need for energy. This results in increased GHG emissions. Total GHG emissions in the Reference Case grow at 1.5 percent annually between 2004 and 2015, close to the historical growth rate of 1.7 percent from 1990 to 2004. The industrial sector has the most rapid GHG emissions growth rate (Figure 3.22). A large portion of this growth can be attributed to expanding oil sands extraction and upgrading. The electric generation sector has the slowest GHG emissions growth (a negative growth rate) as a result of retiring coal-fired generation units.
Figure 3.22
Canadian Total GHG Emissions by Sector – Reference Case
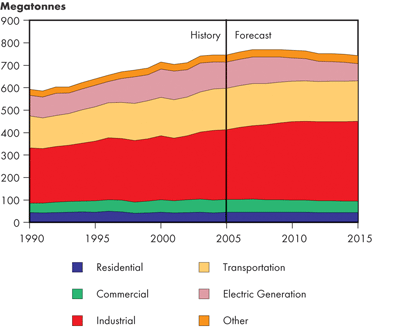
Figure 3.23
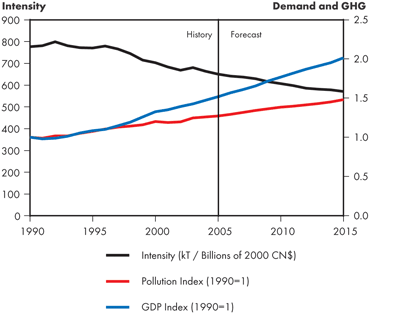
Canadian Total GHG Intensity – Reference Case
Greenhouse gas shares and growth rates vary by province. The three largest GHG emitters are Alberta, Ontario and Quebec. In 1990, Alberta accounted for 28 percent of total Canadian GHG emissions. This share increases to 35 percent in 2015. Ontario's share was 30 percent in 1990 and declines to 26 percent in 2015, while Quebec's share drops slightly from 15 to 13 percent.
Overall, GHG emissions levels increase in Canada over the Reference Case; however, GHG emissions intensity, measured as megatonnes of GHG emissions per unit of GDP, declines (Figure 3.23). This implies that fewer GHGs are emitted to produce the same amount of goods and services. This reflects improvements in energy efficiency and a shift towards less GHG intensive fuels (e.g., retiring of Ontario's coal plants). During the Reference Case timeframe, the GHG intensity level declines at 1.4 percent per year, slightly higher than the historical decline rate of 1.1 percent. This increased rate occurs as clean energy technology and efficiency improvements gain momentum.
Reference Case Issues and Implications
- Despite higher energy prices than experienced throughout the 1990s, energy demand growth is expected to be robust. This is a result of strong economic performance and growth in personal disposable income. As well, significant changes to energy demand are restricted by established energy using stock.
- Over the immediate decade, Canadians will witness the impact of energy supply decisions and realities, including the following:
- Rapidly expanding oil sands developments. Changes to refinery configurations will be required to process the synthetic crude oil and bitumen blends produced from the oil sands. As well, this will have implications for pipeline infrastructure.
- Canada has a large remaining natural gas resource base, but because of the long lead times to access frontier resources, we will remain largely reliant on producing areas of Western Canada.
- It is expected that coal will be phased out in Ontario and nuclear capacity will be largely restored. Emerging technologies, particularly wind energy, will begin to have a noticeable impact on the generation mix across Canada. Decisions will also be made with respect to large hydro developments in Newfoundland and Labrador, Quebec, Manitoba and British Columbia, posing implications for substantial and unprecedented additions to transmission systems.
- The changing energy landscape during the Reference Case has implications for energy consumers, producers, governments and regulators. Effective development of resources will require goodwill and consideration from all participants.
- The key risks and uncertainties surrounding the Reference Case outlook include the following:
- An additional 80 million m³ (500 million b) field is assumed to be found in the relatively unexplored regions of the East Coast, potentially in the Flemish Pass region or in the Deepwater Scotian Shelf, coming on stream in 2015. While these regions have been assigned considerable undiscovered potential, the discovery of such a field, and its timing, is somewhat speculative and depends in large part on the availability of suitable drilling rigs.
- A pipeline to access gas from the Mackenzie Delta is assumed to begin operating near the end of the period, but such a pipeline will be subject to both obtaining regulatory approval and a commercial decision to proceed.
- Energy and environmental programs in place today are included in the energy supply and demand projections. This includes Alberta's Climate Change and Emissions Management Act scheduled to come into effect on 1 July 2007, which requires existing large industrial facilities to reduce their GHG emissions intensity by 12 percent. However, announced programs or plans for policy development, such as the federal government's plan to introduce industrial GHG emissions targets by 2010, are not included in the Reference Case[45]. The adoption of these programs could have implications for Canada's energy market and the Reference Case outlook.
[45] These programs are given consideration in the Triple E Scenario and will be included in future Reference Cases as more details become available.
- Generation additions reflect the latest information available at the time the analysis was conducted. If Saskatchewan decides not to proceed with the proposed clean-coal project, the province will need an additional source of generation, such as natural gas-fired units. A decision to move ahead with nuclear generation in Alberta would displace other base load generation in the province, either natural gas-fired co-generation or coal-fired units.
- Date modified:
