The CER has issued an errata to correct several errors in the report
Towards Net-Zero: Electricity Scenarios

A key objective of the 2015 Paris Agreement is to hold the increase in the global average temperature to well below 2 degrees Celsius and pursuing efforts to limit the temperature increase to 1.5 degrees above pre-industrial levels. Scientific assessments have shown that limiting the temperature increase at those levels requires deep GHG emission reductions, with a key milestone being achieving net-zero emissions or, carbon neutrality by 2050.Footnote 41 As of August 2021, about 130 countries, including Canada, have set or are considering net-zero by 2050 emissions targets.Footnote 42 Canada has set targets to reduce the country’s GHG emissions by 40-45% below 2005 levels by 2030 and to achieve net-zero GHG emissions by 2050.
Over 82% of Canada’s GHG emissions are from energy producing and consuming processes. To achieve net-zero emissions by 2050, transformational changes are required to the way Canadians produce and consume energy. The pathway to achieving net-zero will likely require a greater level of change than we model in EF2021 or previous reports in the Canada's Energy Future series.
In this section, we introduce six new scenarios that explore net-zero pathways for Canada’s electricity sector. This analysis is an important step in modeling related to a net-zero energy system in Canada’s Energy Future series.
What is “Net-Zero”?
“Net-zero” GHG emissions refers to the concept of balancing human-caused GHG emissions with removals from the atmosphere. This includes non-energy emissions from land use, agriculture, and industrial production, in addition to emissions from the energy system. Reaching net-zero emissions does not necessarily require eliminating all emissions everywhere. Instead, residual emissions can be balanced by enhancing biological sinks and using negative emission technologies. What the exact balance might be between removing and emitting GHGs into the atmosphere is uncertain. However, it is clear that Canada’s likelihood of achieving our net-zero target increases as our energy system emissions fall.
See the Towards Net-Zero section in our Energy Futures 2020 report for a discussion of what “Net-Zero” means, and what achieving net-zero GHG emissions could mean for Canada’s energy system.
Why the Electricity Sector?
In this analysis, we focus on the electricity sector, recognizing the pivotal role of electricity in the pathway to net-zero. Many climate modeling and energy system assessment studies have shown that an electricity sector with net-zero or net-negative emissions, and an increasing share of electricity in the end-use fuel mix, is a cornerstone of an energy system in a carbon neutral world. For example, the IPCC Special Report on Global Warming of 1.5 °C shows that pathways that would limit global warming below 1.5 °C include a rapid decline in the carbon intensity of electricity and an increase in electrification of energy end-use.
There are some unique aspects of electricity that make it an important part of most deep decarbonization pathways. Mature and commercially ready technologies exist for decarbonizing electricity. The costs of many low or zero GHG emission generation technologies have declined over the past decade, making them attractive for electric utility investors. Electricity is also a highly versatile form of energy. Converting electricity into end-use energy services can be done at high efficiencies and without any emissions at the point of consumption.
One major challenge for economy-wide deep decarbonization is the distributed nature of GHG emissions. For example, millions of vehicles emit GHGs when fossil fuels are combusted to move the vehicles around. Similarly, millions of buildings combust fossil fuels for space heating, emitting a significant amount of GHGs. When energy end-uses are electrified, no GHGs are emitted at the point of consumption. When energy end-uses are electrified in a decarbonized electricity sector (i.e. where the electricity is generated with low or zero GHG emissions), economy-wide deeper GHG reductions can be achieved. As such, policy makers around the world consider electrification of energy end-use as a critical component of climate action.
In pursuit of net-zero emissions, the electricity sector in Canada has an early advantage. About 82% of Canada's electricity already comes from non-GHG emitting sources such as hydro, nuclear power, wind, and solar. This share has been growing, and emissions associated with the remaining generation have declined significantly over the past two decades. The GHG emissions intensity of Canada’s electricity generation has declined by 45% from 220 grams CO2 equivalent (gCO2e)/kWh in 2005 to 120 gCO2e/kWh in 2019.Footnote 43
The critical role of Canada’s electricity sector in achieving net-zero emissions has received the attention of policy makers across Canadian jurisdictions. As outlined in the Policy Appendix, many programs and policies have been implemented by the federal, provincial, and territorial governments of Canada to reduce GHG emissions from the electricity sector and to promote electrification of end-use energy. For example, Canada's strengthened climate plan, A Healthy Environment and a Healthy Economy, commits about $4 billion of investment to expand the supply of cleaner electricity, modernize Canada's electricity systems, and make electrification of energy end-uses affordable.
Methods and Assumptions
The basis for our modelling of Canada’s electricity sector in a net-zero world begins with the electricity production and consumption results of the Evolving Policies Scenario. We build on those results in three main ways:
- We dive deeper into the electric power sector by applying an electric power system planning and operations simulation model. It selects and operates the optimal set of power generation technologies that minimize the total cost while satisfying future power demand.
- For each province, we assume a specific higher electricity demand level than the Evolving Policies Scenario to capture an increased level of energy end-use electrification consistent with expectations of a net-zero future.
- We assume more stringent climate action in the form of a higher carbon price than the Evolving Policies Scenario. The expected result is that a sufficiently high carbon price will drive the electricity sector towards net-zero emissions.
Given the uncertainty around the costs and viability of different low-carbon technologies, there are many potential pathways to achieve a net-zero electricity system. For this reason, the analysis is developed around six scenarios that explore some of the key uncertainties. Across scenarios we change key inputs such as demand, carbon prices, and technology availability. The main scenario we developed for this part of the analysis is called Net Zero Electricity (NZE) Base scenario. The premise and main characteristics of the NZE Base and other alternative scenarios are presented in Table NZ.1.
Table NZ.1: Premise and Characterizing Features of Net-Zero Electricity Scenarios
| Scenario | Scenario Rationale | Allowable Capacity Expansions | Other Features |
|---|---|---|---|
| NZE Base | Continually increasing Canadian climate policies may lead to a higher carbon price and a higher level of end-use energy demand electrification than the assumptions made in the Evolving Policies scenario. | Generation technologies: natural gas fired combined cycle, natural gas fired simple cycle, and natural gas fired combined cycle with CCSTable Note a units, wind, solar, hydro, conventional nuclear, and SMR. Electricity storage. Inter-provincial transmission. |
Electricity demand is 10-30% higher than the Evolving Policies Scenario, depending on the province. Carbon pricing is higher than the Evolving Policies Scenario, reaching $2020 300/tonnes CO2 by 2050. |
| High Carbon Price | It is plausible that more aggressive climate action is needed to drive the energy systems towards net-zero, leading to a higher carbon price than the value assumed in the NZE Base scenario. | Same as NZE Base. | Same electricity demand as NZE Base. Carbon pricing reaches $2020 800/tCO2 by 2050. |
| Higher Demand | A higher level of electrification is possible due to uncertainty around specific climate action and technology development. | Same as NZE Base. | Electricity demand is 15-45% higher than the Evolving Policies Scenario, depending on the province. Same carbon pricing as NZE Base. |
| Limited Transmission | Interprovincial transmission expansion is costly, and the timing of investments is uncertain. Therefore, new interprovincial transmission development may not be feasible. | Same as NZE Base, but no new inter-provincial transmission is allowed. | Same electricity demand and carbon pricing as NZE Base. |
| Hydrogen | There is a high level of interest in hydrogen as a technology path to decarbonize the economy. Accordingly, there is the possibility of low-cost low/zero carbon hydrogen being available for electricity generation. | All NZE Base options and hydrogen-fired generation technologies. | Same electricity demand and carbon pricing as NZE Base. |
| BECCS | Negative emissions technologies feature prominently in previous net-zero scenarios. Within that scope, biomass-fired electricity generation with CCS is attractive as it simultaneously produces electricity and removes carbon dioxide from the atmosphere. Therefore, it is plausible that biomass-fired electricity generation with CCS is available in the near future. | All NZE Base options and biomass CCSTable Note a generation technology. | Same electricity demand and carbon pricing as NZE Base. |
A core set of assumptions including technology costs, fuel prices, and hourly demand profile shapes were held constant across scenarios. Assumed capital costs of generation and storage technologies are listed in Table NZ.2.
Table NZ.2: Assumed Technology Capital Costs ($2020 CDN/kW) by Investment Year
| Technology | Aggregated Group | Capital Cost in Investment Year | ||
|---|---|---|---|---|
| 2030 | 2040 | 2050 | ||
| Natural Gas Simple Cycle | Natural Gas | 950 | 950 | 950 |
| Natural Gas Combined Cycle | Natural Gas | 1 300 | 1 300 | 1 300 |
| Natural Gas Combined Cycle with CCS | Natural Gas CCS | 3 000 | 2 500 | 2 000 |
| Solar | Solar | 972 | 604 | 376 |
| Wind | Wind | 1 115 | 868 | 676 |
| Hydropower | Hydro | 4 000 | 4 000 | 4 000 |
| Nuclear | Nuclear | 7 000 | 7 000 | 7 000 |
| Small Modular Reactor | Nuclear | 7 000 | 6 000 | 5 000 |
| Hydrogen Simple Cycle | Hydrogen | 1 625 | 1 560 | 1 430 |
| Hydrogen Combined Cycle | Hydrogen | 1 813 | 1 813 | 1 813 |
| Biomass with CCS | Biomass CCS | 4 752 | 4 512 | 4 299 |
| Battery Electricity Storage (4 h storage duration) | Storage | 425 | 275 | 190 |
|
Notes: Where applicable, capital cost reduction due to technology development and learning is considered. |
||||
Other simplifying assumptions in the net zero electricity analysis:
- The analysis is limited to the ten provinces. Electricity systems of the three territories are excluded from the analysis.
- A few other low carbon generation technologies that have attracted recent interest, including geothermal, tidal, conventional biomass, and offshore wind are excluded.
- Electricity storage is limited to battery electric storage with four-hour storage capacity.
- Demand-side management and distributed electricity resources are excluded.
- Only grid-connected generation is modelled.
- Electricity trade with the U.S. is not modelled.
This analysis is based on the hourly electricity module of the Energy Futures Modeling System (see Appendix 2). It optimizes the capacity investments and operations of the provincial electricity systems at one-hour intervals. Interprovincial electricity trade is also modelled. The main objective of the model is to construct and operate an optimal generating unit fleet that would minimize the total cost of satisfying electricity demand in Canada under the particular scenario assumptions. We complete this analysis for the period 2030-2050. Here we present the results for 2030 and 2050, the two years for which Canada has set major emission reduction targets.
Approach to Electricity Sector Emissions in this Net Zero Electricity Analysis
The net-zero electricity scenarios described in this section are intended to explore how Canada’s electricity system might evolve in the broader context of Canada moving towards net-zero for the entire energy system. In an economy-wide net-zero transition, it is possible that some specific sectors could continue to emit GHGs, which would have to be offset by emission removals in other sectors at a given price.
Therefore, in our analysis, we do not force the electricity sector to be purely non-emitting in any year. Rather, we use the assumed carbon price, which serves as a proxy for the cost of carbon removal, as well as potential technology options to determine the ultimate carbon emissions of the sector. Our emission intensity results show that if bioenergy with CCS is available, the electricity sector could be negative emitting. Other scenarios show a dramatic reduction in grid emission intensity compared to current levels, but achieving net-zero could require moderate levels of offsets from carbon removal options such as nature-based solutions or direct air capture.
Results
NZE Base Scenario Electricity Supply
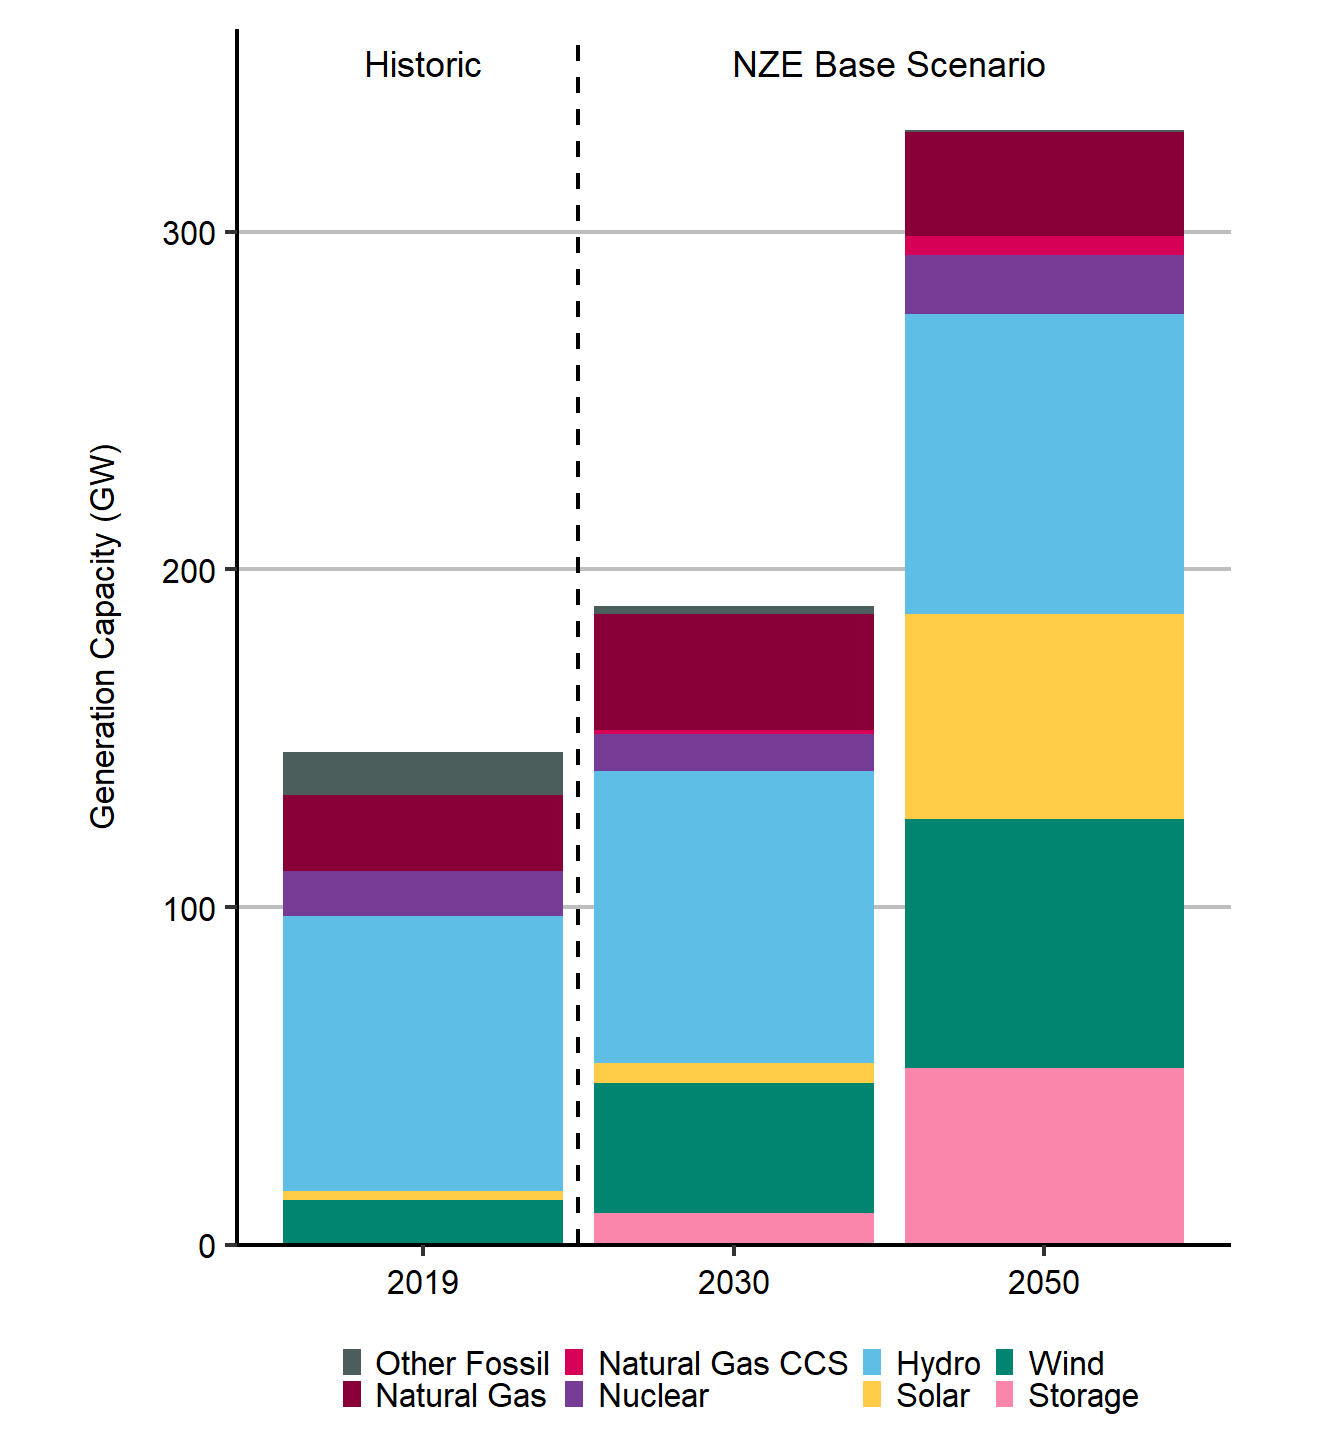
We first discuss the results for the NZE Base scenario and visit the other scenario results later in the section. Figure NZ.1 shows the installed electricity generation capacity mix in Canada by technology in the NZE Base scenario.
In the NZE Base scenario, non-emitting generation technologies (i.e., hydro, nuclear, solar, and wind) and electricity storage account for 80% of the installed generation capacity in 2030. By 2050, that share increases to 89%. Additionally, low-emitting natural gas CCS units are built in Alberta and Saskatchewan. Our results see an addition of about 5.6 GW of natural gas CCS units by 2050. Natural gas CCS account for about 2% of all provincial capacity and 8% of capacity in Alberta and Saskatchewan.
At a combined capacity of 134 GW, which is about 41% of the installed capacity, solar and wind dominate the electricity generation fleet in 2050. Wind capacity doubles from 2019 levels by 2030, and is five times greater by 2050. Solar capacity is twenty times larger compared to 2019 levels by 2050. Electricity storage is installed to facilitate the operations of variable renewables and support grid operations. At an average annual growth rate of about 1.7 GW/year, storage sees a rapid growth throughout the analysis period. From 2019 capacity of about 0.01 GW, storage capacity reaches 52 GW by 2050.
New hydropower capacity additions are relatively small and only see a cumulative new capacity addition of about 4.2GW in the period 2030 to 2050, a 5% increase from 2019. Similarly, the growth of nuclear power is also comparatively small. All new nuclear additions are through small modular reactor (SMR) technology. About 6.6 GW of SMR units are added by 2050. Based on our cost assumptions, no new nuclear capacity is added until 2040. In combination, hydropower and nuclear represent 5% of new capacity additions. Despite the lower share of new capacity additions, as discussed later in this section, hydropower and nuclear power play an important role in supporting Canada’s electricity supply on the path towards net-zero.
Fossil fuel-based technologies, mainly natural gas units, represent approximately 20% of total generating capacity in 2030 and decline to 11% by 2050. Natural gas unit additions are dominated by simple cycle gas turbines and primarily provide grid balancing.
Figure NZ.1: Installed Electricity Generation Capacity in Canada in the NZE Base Scenario
Description
Description: This chart shows installed electricity generation capacity in the NZE Base scenario by fuel in the years 2019, 2030, and 2050. In 2019, natural gas is 22.6 gigawatts (GW), natural gas CCS is 0 GW, hydro is 81.4 GW, wind is 13.2 GW, nuclear is 13.34 GW, solar is 2.7 GW, storage is 0 GW, and other fossil is 12.55 GW. In 2030, natural gas is 34.36 GW, natural gas CCS is 1.2 GW, hydro is 86.6 GW, wind is 38.5 GW, nuclear is 10.7 GW, solar is 5.9 GW, storage is 9.44 GW, and other fossil is 2.6 GW. In 2050, natural gas is 30.82 GW, natural gas CCS is 5.6 GW, hydro is 88.9 GW, wind is 73.86 GW, nuclear is 17.3 GW, solar is 60.59 GW, storage is 52.3 GW, and other fossil is 0.8 GW.
Key Trends: Electricity Supply in the NZE Base Scenario
- Wind and solar dominate new capacity additions. These two technologies account for 59% of new capacity additions through 2050.
- Electricity storage sees a rapid growth and reaches 15% of total installed capacity in 2050.
- New demand growth is primarily satisfied by wind and solar with other low carbon technologies such as SMR, hydropower, and natural gas CCS providing supplemental energy.
- All new nuclear additions are SMR units, which begin to make inroads after 2040.
- Natural gas CCS plays an important role but is restricted to the provinces with greater carbon storage potential.
- Almost all conventional fossil fuel-fired electricity supply comes from natural gas simple cycle units.
- The importance of hydropower remains high. However, there are not major hydropower capacity additions due to relatively high assumed capital costs.
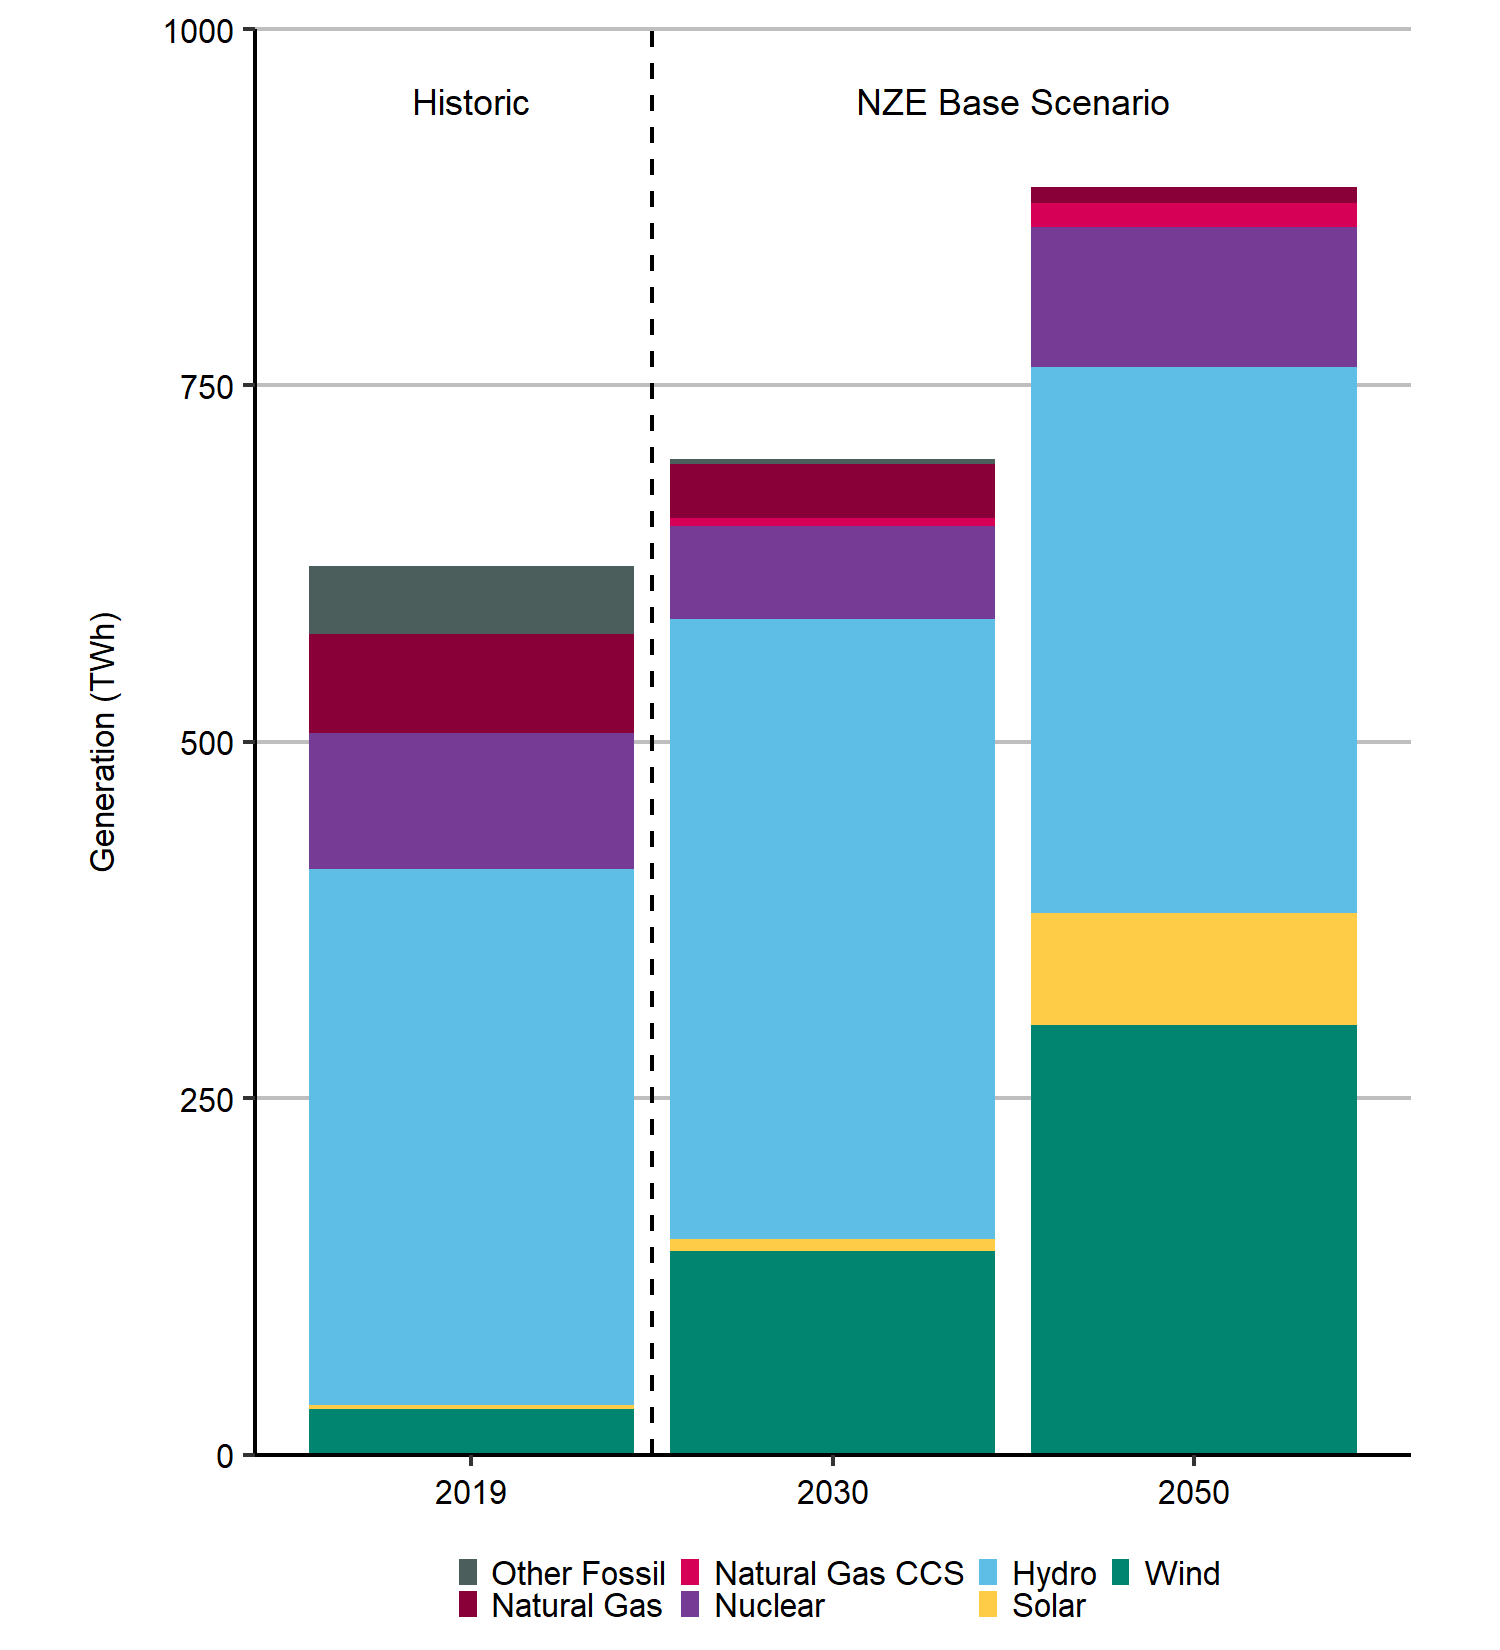
Figure NZ.2: Electricity Generation in Canada by Technology in the NZE Base Scenario
Description
Description: This chart show electricity generation in Canada by technology is the NZE Base scenario in the years 2019, 2030, and 2050. In 2019, natural gas is 69.59 TWh, natural gas CCS is 0 TWh, hydro is 376 TWh, wind is 32.3 TWh, nuclear is 95.5 TWh, solar is 2.2 TWh, , and other fossil is 47.8 TWh. In 2030, natural gas is 11.1 TWh, natural gas CCS is 16.7 TWh, hydro is 383 TWh, wind is 301.5 TWh, nuclear is 98.1 TWh, solar is 78.7 TWh, and other fossil is 0 TWh. In 2050, natural gas is 37.4 TWh, natural gas CCS is 5.5 TWh, hydro is 435 TWh, wind is 142.7 TWh, nuclear is 65.4 TWh, solar is 8.7 TWh, , and other fossil is 3.8 TWh.
Figure NZ.2 Notes: Since storage is not a primary generator of the electricity it stores and ultimately dispatches, it is not included in this figure. By 2050, storage is primarily used to store electricity produced by wind and solar in low demand periods, for use in high demand periods. About 7.5% of the electricity produced in 2050 by solar and wind is first stored in storage units and later delivered to the consumers.

Figure NZ.2 shows electricity generation by technology in the NZE Base scenario. In general, the electricity system must constantly balance electricity generation with electricity use. Electricity use varies with minute-to-minute changes in demand by homes, businesses, and industry. Electricity generation then must vary to match this demand. Some generation types are flexible and can be altered by system operators to meet demand. Other resources are less flexible, and others, such as wind and solar, are not flexible and instead vary based on wind or sunlight availability. Our model takes these factors into account and chooses the optimal generation mix based on level of demand, relative costs, and resource constraints.
In the NZE Base Scenario, non-emitting generation (e.g., hydro, nuclear, solar, and wind) produces 93% of electricity in 2030, and 97% in 2050. Overall, by 2030, 94% of electricity is generated by low- and non-emitting technologies (renewables, nuclear, and CCS-enabled fossil fuel), rising to 99% in 2050. Hydropower and nuclear power provide the largest share of the electricity supply in both periods. However, the amount of electricity provided by those two technologies remains relatively unchanged from 2019 levels, at roughly 50 TWh throughout the projection period. New demand growth is primarily satisfied by wind and solar, with electricity storage systems and to a lesser degree, simple cycle gas turbines, ensuring system reliability.
The current share of fossil fuel-based electricity generation is 19%, and this decreases over the projection period. By 2050, the total share of electricity produced by natural gas-fired generation reaches 3% of the total electricity supply. About two-thirds of that comes from natural gas units equipped with CCS technology. The remainder consists of natural gas simple cycle units that provide some grid balancing services to maintain system reliability.
Storage systems do not produce electricity but rather store electricity produced by other generating units for later delivery to consumers. This is a critical service needed to operate electricity systems with larger shares of variable generating sources such as solar and wind. Our results show that storage is primarily used to move electricity produced by wind and solar in low demand periods to high demand periods. We find that about 7.5% of the electricity produced by solar and wind is first stored in storage units and later delivered to the consumers.
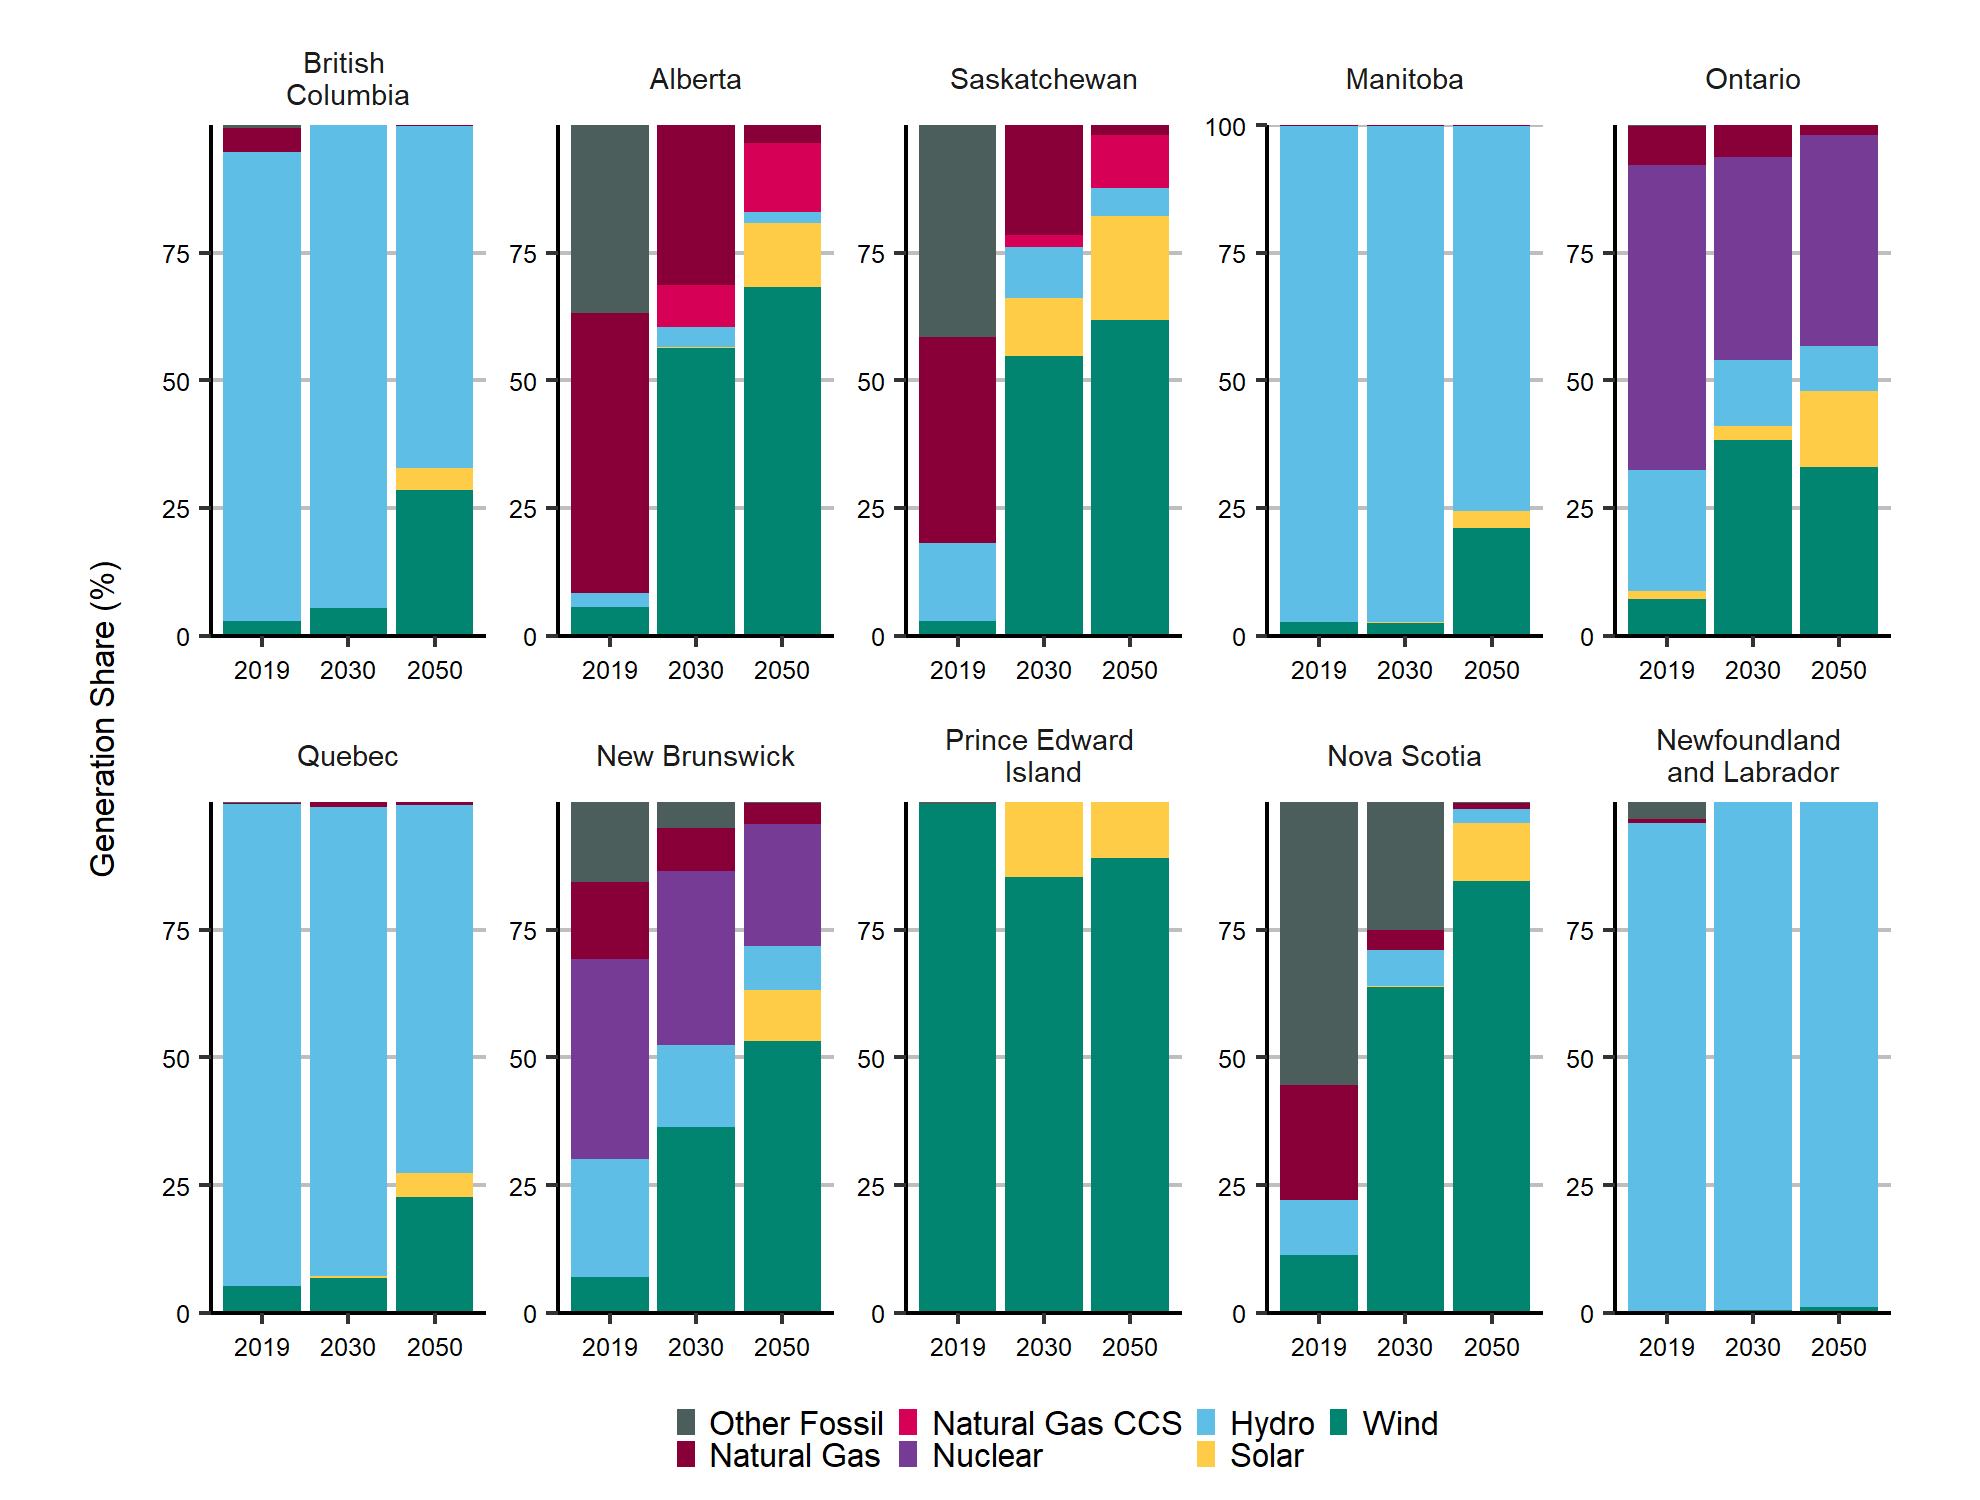
Canada has a diverse energy system. Figure NZ.3 shows the generation mix for each province in the NZE Base scenario. We find that electricity generation in B.C., Manitoba, Quebec, and Newfoundland and Labrador continues to see the supply dominated by hydropower. In the three former provinces, however, new demand is satisfied by wind and solar. Nuclear powerFootnote 44 is limited to Ontario and New Brunswick and represents about 41% and 24%, respectively of the provincial electricity supply in 2050.
Natural gas-fired electricity generation remains a relatively important share, about 12% and 15%, respectively of the electricity supply of Alberta and Saskatchewan in the NZE Base scenario in 2050. However, by 2050, about 80% of the natural gas-fired generation in these two provinces is from natural gas CCS units.
In the NZE Base scenario, inter-provincial electricity transmission capacity expansions increase, mostly among the four western provinces. The combined electricity transfer capacity of the three western inter-provincial electricity corridors (i.e., B.C.–Alberta, Alberta–Saskatchewan, Saskatchewan–Manitoba) almost triples in the NZE Base scenario. Outside of the western region, only the New Brunswick–Prince Edward Island inter-provincial corridor sees transmission expansion at about 30% growth compared to current levels.Footnote 45
Figure NZ.3: Shares of Electricity Generation by Technology in Canadian Provinces in the NZE Base Scenario
Description
Description: This chart provides electricity generation shares in percentages by technology for each of the provinces, as follows:
Alberta
| Technology | 2019 | 2030 | 2050 |
|---|---|---|---|
| Hydro | 3 | 4 | 2 |
| Natural Gas | 55 | 31 | 4 |
| Natural Gas CCS | 0 | 8 | 13 |
| Nuclear | 0 | 0 | 0 |
| Other Fossil | 37 | 0 | 0 |
| Solar | 0 | 0 | 13 |
| Wind | 6 | 56 | 68 |
British Columbia
| Technology | 2019 | 2030 | 2050 |
|---|---|---|---|
| Hydro | 92 | 95 | 67 |
| Natural Gas | 5 | 0 | 0 |
| Natural Gas CCS | 0 | 0 | 0 |
| Nuclear | 0 | 0 | 0 |
| Other Fossil | 1 | 0 | 0 |
| Solar | 0 | 0 | 4 |
| Wind | 3 | 5 | 29 |
Manitoba
| Technology | 2019 | 2030 | 2050 |
|---|---|---|---|
| Hydro | 97 | 97 | 75 |
| Natural Gas | 0 | 0 | 0 |
| Natural Gas CCS | 0 | 0 | 0 |
| Nuclear | 0 | 0 | 0 |
| Other Fossil | 0 | 0 | 0 |
| Solar | 0 | 0 | 3 |
| Wind | 3 | 3 | 21 |
New Brunswick
| Technology | 2019 | 2030 | 2050 |
|---|---|---|---|
| Hydro | 23 | 16 | 9 |
| Natural Gas | 15 | 9 | 4 |
| Natural Gas CCS | 0 | 0 | 0 |
| Nuclear | 39 | 34 | 24 |
| Other Fossil | 16 | 5 | 0 |
| Solar | 0 | 0 | 10 |
| Wind | 7 | 36 | 53 |
Newfoundland and Labrador
| Technology | 2019 | 2030 | 2050 |
|---|---|---|---|
| Hydro | 96 | 100 | 99 |
| Natural Gas | 1 | 0 | 0 |
| Natural Gas CCS | 0 | 0 | 0 |
| Nuclear | 0 | 0 | 0 |
| Other Fossil | 3 | 0 | 0 |
| Solar | 0 | 0 | 0 |
| Wind | 0 | 0 | 1 |
Nova Scotia
| Technology | 2019 | 2030 | 2050 |
|---|---|---|---|
| Hydro | 11 | 7 | 3 |
| Natural Gas | 23 | 4 | 1 |
| Natural Gas CCS | 0 | 0 | 0 |
| Nuclear | 0 | 0 | 0 |
| Other Fossil | 55 | 25 | 0 |
| Solar | 0 | 0 | 11 |
| Wind | 11 | 64 | 85 |
Ontario
| Technology | 2019 | 2030 | 2050 |
|---|---|---|---|
| Hydro | 24 | 13 | 9 |
| Natural Gas | 8 | 6 | 2 |
| Natural Gas CCS | 0 | 0 | 0 |
| Nuclear | 60 | 40 | 41 |
| Other Fossil | 0 | 0 | 0 |
| Solar | 1 | 3 | 15 |
| Wind | 7 | 38 | 33 |
Quebec
| Technology | 2019 | 2030 | 2050 |
|---|---|---|---|
| Hydro | 94 | 92 | 72 |
| Natural Gas | 0 | 1 | 1 |
| Natural Gas CCS | 0 | 0 | 0 |
| Nuclear | 0 | 0 | 0 |
| Other Fossil | 0 | 0 | 0 |
| Solar | 0 | 1 | 5 |
| Wind | 5 | 7 | 23 |
Prince Edward Island
| Technology | 2019 | 2030 | 2050 |
|---|---|---|---|
| Hydro | 0 | 0 | 0 |
| Natural Gas | 0 | 0 | 0 |
| Natural Gas CCS | 0 | 0 | 0 |
| Nuclear | 0 | 0 | 0 |
| Other Fossil | 0 | 0 | 0 |
| Solar | 0 | 15 | 11 |
| Wind | 100 | 85 | 89 |
Saskatchewan
| Technology | 2019 | 2030 | 2050 |
|---|---|---|---|
| Hydro | 15 | 10 | 5 |
| Natural Gas | 40 | 22 | 2 |
| Natural Gas CCS | 0 | 2 | 10 |
| Nuclear | 0 | 0 | 0 |
| Other Fossil | 41 | 0 | 0 |
| Solar | 0 | 11 | 20 |
| Wind | 3 | 55 | 62 |
As noted above, in the NZE Base scenario the share of electricity supplied by technologies with zero carbon intensities increases to about 97%, while another 2% is from low-emissions natural gas CCS units. This is driven by two main factors. First, the capital cost of wind, solar, and electricity storage declines significantly in this scenario, thereby reducing their average cost of production. Second, the increasing carbon price leads to higher generation costs for fossil fuel-fired generating units, making them less competitive against other options.
Similar results were observed in other scenarios, but some noteworthy observations are discussed below.
Electricity Supply in Alternative Scenarios
In this section, we compare the results in other electricity scenarios with the NZE Base scenario. All alternative scenarios see a nearly identical level of inter-provincial transmission expansion as the NZE Base scenario. The exception is the Limited Transmission scenario, where no additional transmission expansions are allowed. Furthermore, similar to the NZE Base scenario, most of the new demand is satisfied by wind and solar, while high GHG emission generation technologies see rapid decline.
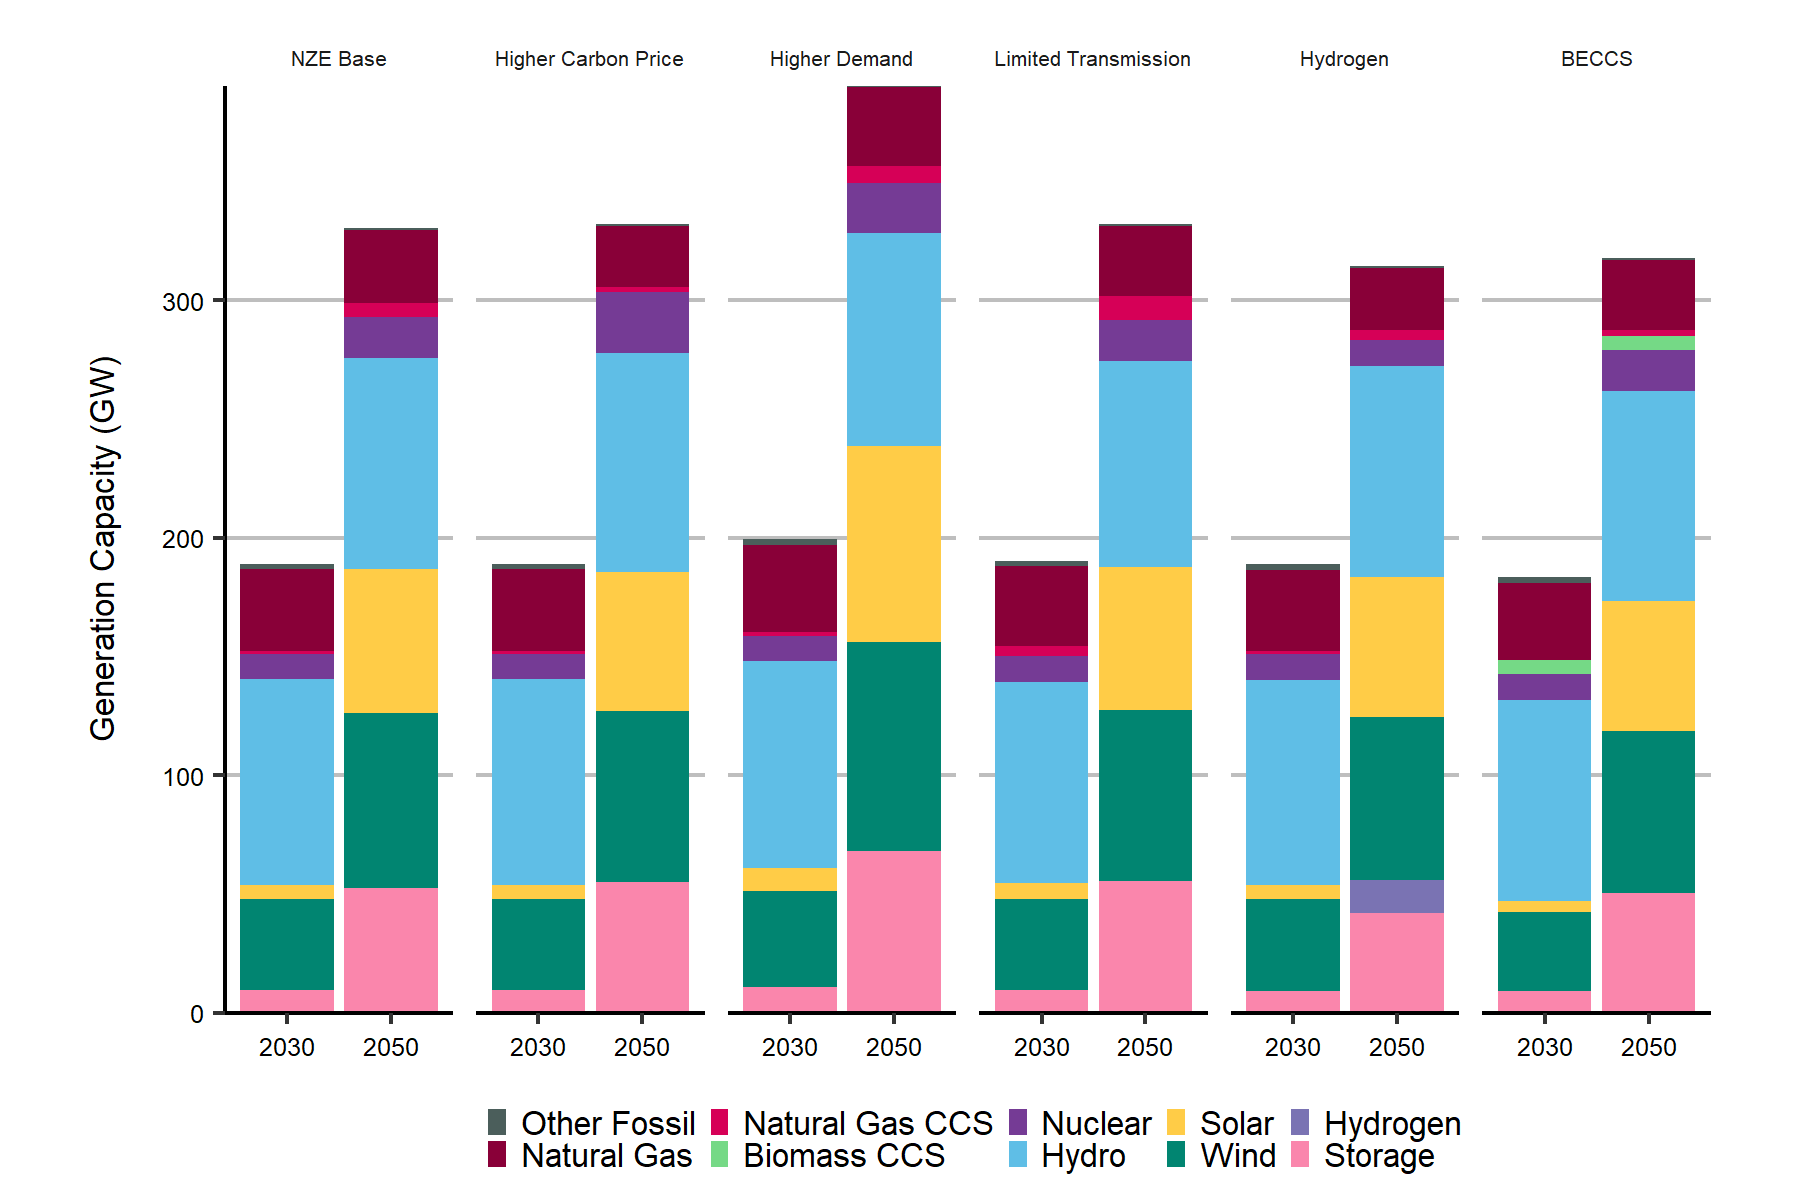
Figure NZ.4 shows installed capacity by technology in different scenarios. Figure NZ.5 shows the cumulative new capacity additions by technology type by 2050 in different scenarios. Figure NZ.6 shows the amount of electricity generation.
Figure NZ.4: Installed Capacity by Technology in Different Scenarios
Click to enlarge
Figure NZ.5: Cumulative New Capacity Additions by 2050 in Different Scenarios

Click to enlarge
Figure NZ.6: Electricity Generation by Technology in Different Scenarios

Figure NZ.4 Description
Description: This chart shows installed electricity generation capacity by technology in 2030 and 2050 for the following scenarios: NZE Base, Higher Carbon Price, Higher Demand, Limited Transmission, Hydrogen, and BECCS. Installed capacity, given in gigawatts, is as follows:
NZE Base
| Technology | 2030 | 2050 |
|---|---|---|
| Other Fossil | 2.35 | 0.76 |
| Natural Gas | 34.36 | 30.82 |
| Natural Gas CCS | 1.18 | 5.60 |
| Biomass CCS | 0 | 0 |
| Nuclear | 10.71 | 17.32 |
| Hydro | 86.56 | 88.93 |
| Solar | 5.92 | 60.59 |
| Wind | 38.49 | 73.86 |
| Hydrogen | 0 | 0 |
| Storage | 9.44 | 52.34 |
Higher Carbon Price
| Technology | 2030 | 2050 |
|---|---|---|
| Other Fossil | 2.35 | 0.76 |
| Natural Gas | 34.36 | 25.39 |
| Natural Gas CCS | 1.18 | 2.20 |
| Biomass CCS | 0 | 0 |
| Nuclear | 10.71 | 25.65 |
| Hydro | 86.56 | 92.45 |
| Solar | 5.92 | 58.50 |
| Wind | 38.49 | 72.05 |
| Hydrogen | 0 | 0 |
| Storage | 9.44 | 54.88 |
Higher Demand
| Technology | 2030 | 2050 |
|---|---|---|
| Other Fossil | 2.35 | 0.76 |
| Natural Gas | 36.44 | 33.14 |
| Natural Gas CCS | 1.78 | 7.31 |
| Biomass CCS | 0 | 0 |
| Nuclear | 10.71 | 20.69 |
| Hydro | 86.92 | 89.89 |
| Solar | 9.93 | 82.65 |
| Wind | 40.51 | 87.93 |
| Hydrogen | 0 | 0 |
| Storage | 10.66 | 68.01 |
Limited Transmission
| Technology | 2030 | 2050 |
|---|---|---|
| Other Fossil | 2.35 | 0.76 |
| Natural Gas | 33.62 | 29.51 |
| Natural Gas CCS | 4.24 | 10.13 |
| Biomass CCS | 0 | 0 |
| Nuclear | 10.71 | 17.32 |
| Hydro | 85.03 | 86.62 |
| Solar | 6.61 | 60.24 |
| Wind | 38.29 | 72.08 |
| Hydrogen | 0 | 0 |
| Storage | 9.52 | 55.35 |
Hydrogen
| Technology | 2030 | 2050 |
|---|---|---|
| Other Fossil | 2.35 | 0.76 |
| Natural Gas | 34.31 | 25.91 |
| Natural Gas CCS | 1.18 | 4.47 |
| Biomass CCS | 0 | 0 |
| Nuclear | 10.71 | 10.71 |
| Hydro | 86.56 | 88.92 |
| Solar | 5.89 | 59.03 |
| Wind | 38.45 | 68.79 |
| Hydrogen | 0.06 | 13.90 |
| Storage | 9.27 | 41.84 |
BECCS
| Technology | 2030 | 2050 |
|---|---|---|
| Other Fossil | 2.35 | 0.76 |
| Natural Gas | 32.53 | 29.51 |
| Natural Gas CCS | 0.00 | 2.54 |
| Biomass CCS | 6.00 | 6.00 |
| Nuclear | 10.71 | 17.32 |
| Hydro | 84.72 | 88.57 |
| Solar | 4.63 | 54.55 |
| Wind | 33.50 | 68.27 |
| Hydrogen | 0 | 0 |
| Storage | 9.00 | 50.35 |
Figure NZ.5 Description
Description: This chart shows cumulative additions by 2050 for the following net-zero scenarios: NZE Base, Higher Carbon Price, Higher Demand, Limited Transmission, Hydrogen, and BECCS. Cumulative new capacity additions, given in gigawatts, are as follows:
NZE Base
| Technology | Cumulative Capacity |
|---|---|
| Natural Gas | 13.97 |
| Natural Gas CCS | 5.60 |
| Biomass CCS | 0 |
| Nuclear | 6.61 |
| Hydro | 4.21 |
| Solar | 57.59 |
| Wind | 60.81 |
| Hydrogen | 0 |
| Storage | 52.34 |
Higher Carbon Price
| Technology | Cumulative Capacity |
|---|---|
| Natural Gas | 9.83 |
| Natural Gas CCS | 2.20 |
| Biomass CCS | 0 |
| Nuclear | 14.94 |
| Hydro | 7.73 |
| Solar | 55.50 |
| Wind | 59.00 |
| Hydrogen | 0 |
| Storage | 54.88 |
Higher Demand
| Technology | Cumulative Capacity |
|---|---|
| Natural Gas | 17.10 |
| Natural Gas CCS | 7.31 |
| Biomass CCS | 0 |
| Nuclear | 9.99 |
| Hydro | 5.17 |
| Solar | 79.65 |
| Wind | 74.89 |
| Hydrogen | 0 |
| Storage | 68.01 |
Limited Transmission
| Technology | Cumulative Capacity |
|---|---|
| Natural Gas | 12.67 |
| Natural Gas CCS | 10.13 |
| Biomass CCS | 0 |
| Nuclear | 6.61 |
| Hydro | 1.90 |
| Solar | 57.24 |
| Wind | 59.03 |
| Hydrogen | 0 |
| Storage | 55.35 |
Hydrogen
| Technology | Cumulative Capacity |
|---|---|
| Natural Gas | 10.41 |
| Natural Gas CCS | 4.47 |
| Biomass CCS | 0 |
| Nuclear | 0 |
| Hydro | 4.20 |
| Solar | 56.03 |
| Wind | 55.75 |
| Hydrogen | 13.90 |
| Storage | 41.84 |
BECCS
| Technology | Cumulative Capacity |
|---|---|
| Natural Gas | 12.66 |
| Natural Gas CCS | 2.54 |
| Biomass CCS | 6.00 |
| Nuclear | 6.61 |
| Hydro | 3.85 |
| Solar | 51.55 |
| Wind | 55.22 |
| Hydrogen | - |
| Storage | 50.35 |
Figure NZ.6 Description
Description: This chart shows electricity generation by technology in 2030 and 2050 in the following net-zero scenarios: NZE Base, Higher Carbon Price, Higher Demand, Limited Transmission, Hydrogen, and BECCS. Electricity generation in terrawatt hours is as follows:
NZE Base
| Technology | 2030 | 2050 |
|---|---|---|
| Other Fossil | 3.76 | 0.04 |
| Natural Gas | 37.43 | 11.08 |
| Natural Gas CCS | 5.54 | 16.69 |
| Biomass CCS | 0 | - |
| Nuclear | 65.41 | 98.11 |
| Hydro | 434.95 | 382.99 |
| Solar | 8.67 | 78.73 |
| Wind | 142.70 | 301.54 |
| Hydrogen | 0 | 0 |
Higher Carbon Price
| Technology | 2030 | 2050 |
|---|---|---|
| Other Fossil | 3.76 | 0.03 |
| Natural Gas | 37.43 | 4.45 |
| Natural Gas CCS | 5.54 | 4.90 |
| Biomass CCS | 0 | 0 |
| Nuclear | 65.41 | 131.04 |
| Hydro | 434.95 | 379.31 |
| Solar | 8.67 | 75.21 |
| Wind | 142.70 | 293.47 |
| Hydrogen | 0 | 0 |
Higher Demand
| Technology | 2030 | 2050 |
|---|---|---|
| Other Fossil | 3.71 | 0.04 |
| Natural Gas | 41.69 | 12.70 |
| Natural Gas CCS | 8.33 | 22.02 |
| Biomass CCS | 0 | 0 |
| Nuclear | 66.69 | 120.79 |
| Hydro | 443.06 | 371.95 |
| Solar | 14.10 | 112.02 |
| Wind | 150.22 | 353.28 |
| Hydrogen | 0 | 0 |
Limited Transmission
| Technology | 2030 | 2050 |
|---|---|---|
| Other Fossil | 3.76 | 0.04 |
| Natural Gas | 37.17 | 10.26 |
| Natural Gas CCS | 21.02 | 32.90 |
| Biomass CCS | 0 | 0 |
| Nuclear | 65.41 | 98.11 |
| Hydro | 420.11 | 380.08 |
| Solar | 9.24 | 77.53 |
| Wind | 141.74 | 290.30 |
| Hydrogen | 0 | 0 |
Hydrogen
| Technology | 2030 | 2050 |
|---|---|---|
| Other Fossil | 3.82 | 0.04 |
| Natural Gas | 37.54 | 6.38 |
| Natural Gas CCS | 5.54 | 14.26 |
| Biomass CCS | 0 | 0 |
| Nuclear | 65.42 | 67.27 |
| Hydro | 434.91 | 394.24 |
| Solar | 8.74 | 78.94 |
| Wind | 142.46 | 286.88 |
| Hydrogen | 0.02 | 41.14 |
BECCS
| Technology | 2030 | 2050 |
|---|---|---|
| Other Fossil | 3.76 | 0.04 |
| Natural Gas | 32.17 | 10.60 |
| Natural Gas CCS | 0.00 | 7.26 |
| Biomass CCS | 42.05 | 42.05 |
| Nuclear | 65.41 | 98.11 |
| Hydro | 424.91 | 380.34 |
| Solar | 7.00 | 73.59 |
| Wind | 123.11 | 276.86 |
| Hydrogen | 0 | 0 |
Key Trends: Electricity Supply in Alternative Net Zero Electricity Scenarios
- The Higher Carbon Price scenario increases nuclear and hydro but reduces natural gas generation, relative to the NZE Base scenario.
- The Limited Transmission scenario increases natural gas CCS generation in Alberta and Saskatchewan, relative to the NZE Base scenario.
- The BECCS scenario provides a technology pathway for economy wide GHG emissions reductions.
- Increased demand in the Higher Demand Scenario is mainly satisfied by solar, wind, and nuclear power.
- The Hydrogen scenario reduces the capacity and generation levels of all other low/zero-carbon emissions technologies except those of hydropower, relative to the NZE Base scenario.
Higher Carbon Price Scenario
In the Higher Carbon Price scenario, we see reductions in capacity and electricity generation by natural gas units in 2050 compared to the NZE Base scenario. Cumulative new natural gas capacity additions are 30% lower than NZE Base by 2050. Compared to NZE Base, natural gas-fired generation is 60% lower in 2050. Natural gas CCS is also impacted by the higher carbon price. Our assumption is that any residual CO2 emissions that are not captured by the CCS process (10% of the combustion emissions) will see the full carbon price. Even though the carbon price only applies to this 10%, the higher carbon price increases the average cost of electricity produced by natural gas CCS by about 50% relative to the NZE Base scenario. That makes natural gas CCS less competitive. Compared to NZE Base, natural gas CCS cumulative capacity additions are 60% lower and electricity generation is 70% lower. The reductions in natural gas-fired generation capacity is offset by an increase in hydropower and nuclear SMR. Hydropower and SMR see a doubling of cumulative new capacity additions compared to the NZE Base scenario. Furthermore, this is the only scenario where we observe the addition of SMR units outside of Ontario and New Brunswick, with Alberta, Saskatchewan, and Nova Scotia seeing SMR additions.
Higher Demand Scenario
The Higher Demand scenario assumes a higher level of electrification and therefore about 12% higher electricity demand overall, or about 104 TWh in 2050. In 2050, the higher electricity demand in this scenario is satisfied by increased solar (+33 TWh), wind (+51 TWh), nuclear (+23 TWh), and natural gas CCS (+5 TWh) generation compared to NZE Base. Compared to the NZE Base scenario, those four technologies see a supply increase of 42%, 17%, 23%, and 31%, respectively. The installed storage capacity is 30% or about 16 GW higher than NZE Base. The level of hydropower generation remains relatively unchanged.
Limited Transmission Scenario
The Limited Transmission scenario only sees notable changes in the four western provinces. In the NZE Base scenario the hydropower resources in B.C. and Manitoba partially provide system flexibility to manage variable wind and solar power supply in Alberta and Saskatchewan. This process is facilitated by the addition of new transmission capacity. The Limited Transmission scenario inhibits new transmission capacity additions and consequently the combined wind and solar power generation declines by about 5% relative to NZE Base. This reduction in generation is filled by a higher level of natural gas CCS units in Alberta and Saskatchewan. Compared to NZE Base, the Limited Transmission scenario sees a doubling of natural gas CCS capacity and generation.
Hydrogen Scenario
In many net-zero scenarios in previous studies,Footnote 46 low-carbon hydrogen plays an important role in many sectors, and hydrogen production increases. Our Hydrogen scenario assumes the existence of a relatively mature market for hydrogen in Canada, where hydrogen costs through electrolysis and natural gas with CCS have fallen significantly and supplies of low-carbon hydrogen are accessible for electricity producers. This supply of hydrogen is assumed to be exogenous to the producers, that is, they do not have to produce the hydrogen themselves, but purchase hydrogen at a delivered price, assumed to be about 2020 US$1.00/kg by 2050. We assume two hydrogen-fired generation technologies, hydrogen combined cycle and hydrogen simple cycle. In this scenario, we observe a cumulative hydrogen-fired generation capacity addition of 13 GW. Hydrogen technologies impact other technologies in a complex manner.
Under the assumed conditions, hydrogen technologies have lower overall economic costs compared to all natural gas technologies. Consequently, we see a 25% reduction in 2050 of non-CCS natural gas capacity (i.e., combined cycle and simple cycle) compared to NZE Base. Furthermore, the GHG emissions intensity of hydrogen combined cycle technology is lower than natural gas CCS. Therefore, natural gas CCS sees a 20% capacity reduction in 2050 compared to NZE Base.
The Hydrogen scenario also sees a 10% reduction in wind and solar capacity relative to NZE Base in 2050. The overall economics of the use of hydrogen for electricity supply is more favorable than building wind, solar and the additional flexible capacity they necessitate to balance supply and demand. Similarly, hydrogen technologies are more competitive than nuclear under the assumed conditions in most of the analysis period. Therefore, no new nuclear growth is seen in this scenario. Hydropower capacity remains unchanged compared to NZE Base.
Finally, hydrogen units also displace 32% of the storage capacity in 2050 compared to NZE Base as hydrogen-fired generating technologies can partially satisfy the overall electric power system’s flexible capacity requirements.
BECCS Scenario
The BECCS scenario assumes the availability of biomass CCS units for electricity generation in Alberta and Saskatchewan. Biomass CCS is considered to have negative GHG emissions, and we assume that the technology would get credit for carbon removal from the atmosphere. The credit is assumed to be calculated using the full carbon price. As the carbon price increases, biomass CCS units become a negative cost generation option, where its average cost of electricity in 2050 is -$85/MWh. Therefore, biomass CCS partially displaces all other generation technologies in Alberta and Saskatchewan. Relative to NZE Base, we estimate the resulting reduction in natural gas CCS generation in 2050 to be 56% and that of combined wind and solar to be about 15%.
The cumulative biomass CCS capacity addition by 2050 is 6 GW. Due to the limitations in available biomass resources, we assume this is the maximum possible biomass CCS capacity. At higher carbon prices, it may be economically competitive to import biomass for electricity production from other regions into Alberta and Saskatchewan, where CCS is viable. However, further analysis is required to verify this assumption.
Due to the carbon removal capability of biomass CCS, the electricity system in Canada becomes a net negative emissions economic sector in the BECCS scenario.
GHG Emissions Intensity of Electricity Sector in Canada
Figure NZ.7 shows the GHG emissions intensity of the electricity sector in Canada in 2030 and 2050 in all scenarios we considered, compared to 2005 and 2019 levels.
In all scenarios, except the BECCS scenario, the GHG emissions intensity of Canada’s electricity sector reaches about 27 grams of carbon dioxide equivalent per kilowatt-hour (gCO2/kWh) in 2030. The value is 78% lower than the electricity sector emissions intensity in 2019. The emissions intensity further reduces in 2050 but varies across scenarios. The NZE Base scenario emissions intensity in 2050 is 8 gCO2/kWh, a 93% reduction compared to the emissions intensity in 2005. The Higher Carbon Price scenario sees the 2050 emissions intensity declining to 3 gCO2/kWh. While significant emissions reductions are achieved, none of the scenarios, except BECCS, see the overall electricity sector reaching net-zero.
Almost all of the remaining emissions come from natural gas-fired conventional units, which generate electricity infrequently, and uncaptured emissions from natural gas CCS units. Blending renewable natural gas with natural gas could potentially further reduce the small amount of remaining emissions in the sector, or provide a pathway for negative emissions if coupled with CCS. However, we have not assessed the potential of renewable natural gas to decarbonize Canada’s electricity sector in this analysis.
The BECCS scenario sees the emissions intensity of the electricity sector going net negative, through carbon removal by the biomass CCS units. This would provide some emissions allowances for other economic sectors in Canada’s path towards a net-zero future.
Figure NZ.7: GHG Emissions Intensity of the Electricity Sector in Canada in Different Scenarios

Description
Description: This chart shows the emissions intensity, given in grams of carbon dioxide equivalent per kilowatt-hour (gCO2/kWh), of the electricity sector in Canada in the following net-zero scenarios: NZE Base, Higher Carbon Price, Higher Demand, Limited Transmission, Hydrogen, BECCS. In the NZE Base scenario, the CO2 emissions intensity is 26.7 in 2030 and 7.5 in 2050. In the Higher Carbon Price scenario, the CO2 emissions intensity is 26.7 in 2030 and 2.9 in 2050. In the Higher Demand scenario, the CO2 emissions intensity is 28.3 in 2030 and 8 in 2050. In the Limited Transmission scenario, the CO2 emissions intensity is 28.2 in 2030 and 8.6 in 2050. In the Hydrogen scenario, the CO2 emissions intensity is 26.8 in 2030 and 5.5 in 2050. In the BECCS scenario, the CO2 emissions intensity is -22 in 2030 and -25.8 in 2050.
Key Uncertainties: Net-Zero Electricity Results
- Economics: The results and trends presented in this section are driven by the economic assumptions made on capital and operating costs of generating technologies, storage, and transmission lines. Any changes to our assumptions, particularly the ones made for variable renewables and storage, could potentially alter the results.
- Policy Assumptions: The analysis makes hypothetical carbon pricing assumptions. The level of stringency and mechanisms of the carbon pricing system could potentially change the results.
- Transmission System Representation: The current analysis does not model intra-provincial transmission systems. A need for significant increases in intra-provincial transmission in a given scenario can vary the results.
- Demand profile: The demand profiles (i.e., how electricity demand changes over different time periods) used are constructed using historic observations. Changes to end-use energy demand, particularly under higher electrification, could impact the results.
- Technology Representation: The analysis models only a limited number of generation technologies. Several other zero/low-emissions technologies as well as grid management options such as demand side management exist. The inclusion of them could potentially change the comparative results.
The electricity sector could play an important role in achieving deeper emissions reductions in Canada’s energy system, both by reducing emissions from generating electricity and by reducing emissions in other sectors by electrification. Our analysis shows that there are many technological pathways to achieve significant emission reductions in the electricity sector. The majority of technologies required are available today, and Canadian electric utilities have experience in building and operating them. In Canada’s pathway towards a net-zero future, the country’s electricity sector will have multiple roles, including the supply of energy and potentially carbon removal through investing in negative emissions technologies.
- Date modified: