
Market Snapshot: Montney Well Performance Continues to Improve: An Update on Production Trends in Canada’s Dominant Natural Gas Formation
Connect/Contact Us
Please send comments, questions, or suggestions for Market Snapshot topics to snapshots@cer-rec.gc.ca
Release date: 2026-09-23
Natural gas production in Canada continues to grow and is projected to increase further. Much of this growth is concentrated in the Montney Formation, reflecting geological characteristics, increased drilling activity, and improved well performance.
The Montney Formation is a 130,000 km2 area spanning from northwestern Alberta to northeastern British Columbia. It is a Lower Triassic-aged siltstone formation containing natural gas, natural gas liquids, and light crude oil. In terms of natural gas production, the Montney Formation primarily produces tight gas using the same technology used to produce shale gas elsewhere in North America (multi-stage hydraulic fracturing and horizontal drilling).Footnote 1
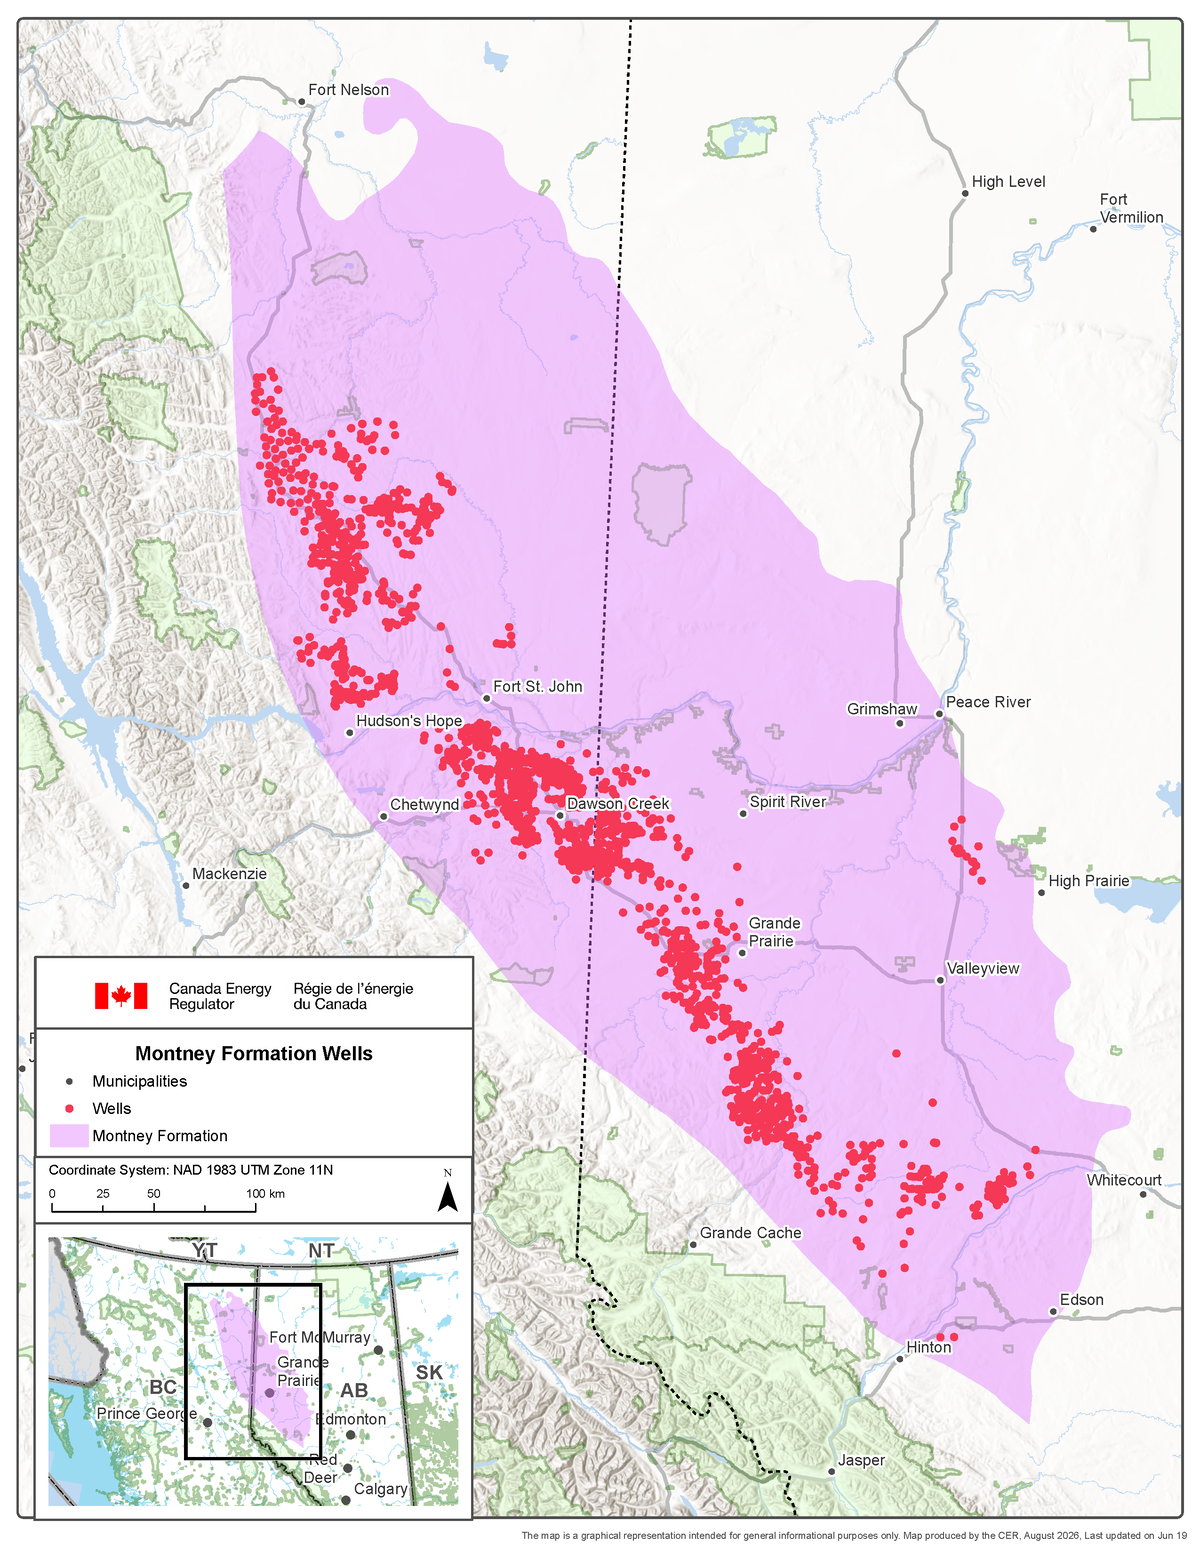
Figure 1 shows the extent of the Montney Formation area and the location of its natural gas wells. Since 2005, over 9,500 wells have been drilled in the Montney (note that, given the scale of the map, not all individual wells are distinguishable). The majority of wells are on the south and western sides of the formation because this side has higher pressures relative to other zones in the formation. Higher reservoir pressures are one factor contributing to well productivity, or a well’s ability to produce natural gas.
Figure 1: Montney Formation Area and Natural Gas Wells Drilled from 2005 to 2025
Source and Text Alternative
Source: GeoCarta well data for well coordinates and the Atlas of the Western Canada Sedimentary Basin for the location of the Montney Formation.
Text Alternative: This map shows the location of the Montney Formation, stretching from southwest Alberta near Edson and Hinton, to northeast British Columbia near Fort Nelson. The map also shows the location of over 9,500 Montney wells drilled from 2005 to 2025. The majority of the wells are located on Montney's south and western sides.
Montney Natural Gas Production Trends
The Canada Energy Regulator’s Energy Futures 2026 data show that tight gas, particularly from the Montney Formation, makes up the largest share of Canadian natural gas production in recent years and increasingly into the future. Figure 2 depicts natural gas production measured in billion cubic feet per day (Bcf/d) in Canada by type from the Energy Futures 2026 Current Measures scenario.Footnote 2 Tight gas in the Montney made up 22% of Canadian gas production in 2015 (3.3 of 15.2 Bcf/d) and 45% in 2024 (8.3 of 18.3 Bcf/d). Looking ahead, the Energy Futures 2026 modelling suggests that as Canada’s total gas production rises, Montney tight gas could account for 63% of Canadian production by 2035 (15.3 of 24.4 Bcf/d) and 71% by 2050 (19.4 of 27.2 Bcf/d), though these levels and shares depend heavily on factors such as future LNG export levels and natural gas prices.
Figure 2: Natural Gas Production in Canada by Type (Energy Futures 2026, Current Measures Scenario)
Source and Text Alternative
Source: CER, Energy Futures Report 2026
Text Alternative: This figure shows natural gas production, measured in billion cubic feet per day (Bcf/d), by type in Canada from 2015 to 2050. In general, tight gas in the Montney makes up the largest share of natural gas production in Canada, followed by tight gas in other regions (which are grouped together), solution gas, conventional gas, shale gas, and coal bed methane. The Energy Futures 2026 modelling suggests that these trends could continue through 2050.
Growth in natural gas production in the Montney reflects increased drilling activity and overall improved well performance. The decline curves in Figure 3 compare monthly gas production from average Montney Formation gas wells drilled from 2010 to 2024 in British Columbia and Alberta. Decline curves track how natural gas production changes over time, starting from when a well’s production first begins. Montney wells typically follow a similar pattern of gas production ramping up initially, followed by a steep decline, then a more gradual decline. Decline curves are a key tool for analyzing well productivity because they can provide insight into metrics such as initial production rates and how much gas a well could produce over its lifetime (known as the estimated ultimate recovery). For example, prior to 2015, initial production rates were below 3 MMcf/d, whereas recent wells range from an average of over 4 MMcf/d in Alberta to nearly 7 MMcf/d in British Columbia.
Figure 3: Montney Natural Gas Decline Curves: British Columbia (left) and Alberta (right)
Source and Text Alternative
Source: CER and Divestco for underlying production data (as of 2024)
Text Alternative: These graphs show the monthly natural gas production from average Montney Formation gas wells drilled from 2010 to 2024 in British Columbia and Alberta, starting from when well production first begins. Prior to 2015, initial production rates were below 3 MMcf/d, while recent wells range from an average of over 4 MMcf/d in Alberta to nearly 7 MMcf/d in British Columbia.
The Montney’s Geological Characteristics and Technological Advancements
The Montney’s geological characteristics and ongoing advancements in technology contribute to the region’s productivity and its role as the largest source of Canadian natural gas production. The Montney Formation contains silt grains and cement. In these silt grains and cements are hard minerals that make the formation brittle and prone to fracturing when high pressures are applied.
The Montney Formation is made of silt grains and cement that are both composed of hard minerals. These hard minerals make the formation brittle and prone to fracturing when high pressures are applied. Moreover, because the silt grains were propped up against each other during burial (over 200 million years ago), these layers in the formation are relatively resistant to compaction. As a result, sufficient porosity remains between the silt grains to store natural gas. A useful analogy is stacking layers of marbles in a container. The marbles prop each other up and resist compaction, creating spaces between the marbles that are similar to the pore spaces that remain between silt grains in the Montney Formation. Once the rock is hydraulically fractured, the stored gas can flow at commercial rates.
Additionally, the Montney Formation is very thick, typically ranging from 100 m to 300 m, but reaching over 300 m in some areas. This thickness means that one well can be drilled to produce gas from three or more levels in the formation.
Further, many areas of the formation contain “wet gas”, meaning the natural gas contains natural gas liquids such as propane and butane as well as condensate, a heavier natural gas liquid used as diluent in oil sands production. Liquids-rich gas can improve well economics because natural gas liquids provide additional revenue beyond the value of the natural gas itself.
While geology has remained the same, the productivity of wells has increased because producers and service companies are continually improving technology. Producers learn more about the reservoirs with each well they drill and service companies improve the tools used to develop the wells. Some of these technological advancements include:
- Increasing well lateral lengths: Companies have been drilling longer well laterals in Montney wells, including to over 5,000 m.Footnote 3 Longer lateral lengths enable access to a larger extent of the reservoir and lower development costs by decreasing the number of drilled wells needed to produce the same amount of gas.
- Increasing proppant use: Proppant injected into fractures during hydraulic fracturing helps improve reservoir flow by propping the fractures open as pressure in the reservoir depletes. For example, in British Columbia wells, proppant injected into the producing formation has increased from an average of 117 tonnes per 100 m of horizontal leg to 197 tonnes per 100 m of horizontal leg from 2015 to 2024.Footnote 4
- More precise reservoir targeting: Ongoing advancements in engineering and geoscience have enabled better identification and targeting of higher-quality reservoir zones.
- Date modified: