
Market Snapshot: Canada’s heat pump market has grown nearly sixfold since 2000
Connect/Contact Us
Please send comments, questions, or suggestions for Market Snapshot topics to snapshots@cer-rec.gc.ca
Release date: 2026-08-12
Heat pump adoption and share in the overall heating technology mixFootnote 1 has increased substantially over the past two decadesFootnote 2. The numbers rose from a total of 238,000 units in 2000 to 1,335,000 units in 2023, a near sixfold increaseFootnote 3. Overall, heat pumps accounted for 7.9% of residential heating systems in 2023, which is up from 1.9% in 2000Footnote 4.
Quebec has added the most heat pumps, making up 36% of heat pump additions across Canada from 2000 to 2023, followed by British Columbia at 16%, Ontario at 15% and New Brunswick at 13%. Single detached homes make up the majority of heat pump installations, accounting for 83%.
Figure 1: Total Heat Pump Stock by Province (2000-2023 Territories Excluded)
Source and Text Alternative
Source: National Energy Use Database | Natural Resources Canada
Text Alternative: This stacked bar chart visual illustrates total heat pump stock in Canada between the years 2000 to 2023. The data can be filtered by year, building type, and province. Heat pump stock rises from a total stock of 238,000 units in 2000, to 1,335,000 units in 2023. The majority of heat pump installations are in single detached homes, making up 1,108,000 units out of the 1,335,000 units total in 2023 (83%).
What is a heat pump?
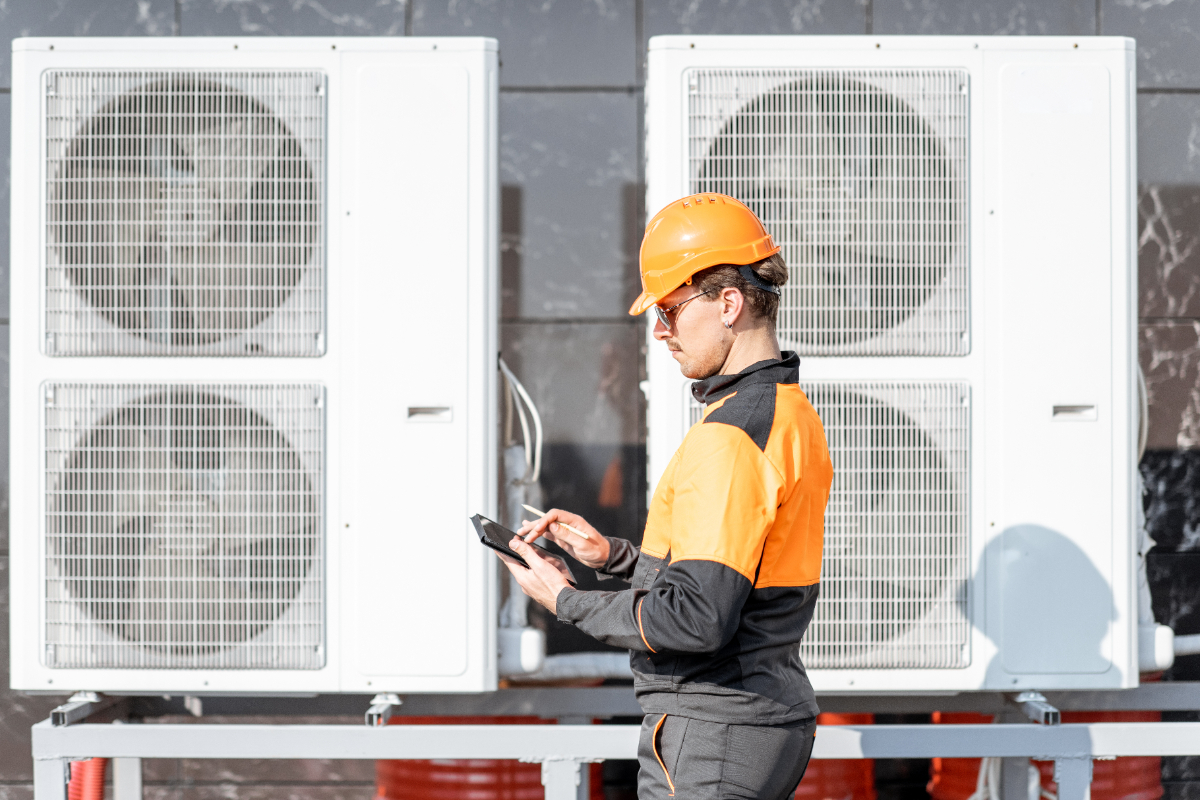
Heat pumps are used for both space heating and cooling whereas other technologies like a furnace or an air conditioner only have one of these functions. During the summer months, a heat pump cools indoor spaces by removing the heat from inside the building, transferring it outside. In winter, heat pumps draw available heat energy from the outdoor air and transfer it indoors, creating a warm indoor environmentFootnote 5.
The heat transferring property allows heat pumps to operate at much higher efficiencies relative to traditional heating equipmentFootnote 6. This makes heat pumps two times more efficient than Canada’s most common sources of residential indoor heating, which are high efficiency natural gas furnaces or electric baseboard heating systemsFootnote 7Footnote 8.
For more about how heat pumps work see: Electric heat pumps – Natural Resources Canada and, Market Snapshot: Growing heat pump adoption – how does the technology work?
Figure 2 illustrates the growth of heat pumps in the context of the total evolution of residential heating system stock in Canada. From 2000 to 2023, total residential heating systems grew by 4.35 million. The growth of heat pumps has coincided with strong growth in electric and high-efficiency natural gas systems, and declining heating oil and low- and medium-efficiency natural gas systems.
Figure 2: Total Heating System Stock (2000-2023)
Source and Text Alternative
Source: National Energy Use Database | Natural Resources Canada
Text Alternative: This stacked bar chart visual illustrates total heating stock mix separated into technology types, and efficiency tiers within technology types for 2000 to 2023 (latest available data). Heat pump stock increased from 238,000 in year 2000 to 1,335,000 in year 2023, while high efficiency natural gas stock increased from 1,060,000 in year 2000, to 6,027,000 in year 2023.
Heat Pump Share Growth Across Atlantic Canada
The Atlantic Canada region has higher heat pump adoption rates compared to rest of Canada. In 2023, heat pumps accounted for 40% off all home heating systems in New Brunswick, Prince Edward Island followed at 23%, with Nova Scotia at 21.5%, and Newfoundland and Labrador at 16%. As federal and provincial support for energy-efficient technologies grew, the number of homes using heating oil decreased. Over the past two decades, New Brunswick saw the number of homes using heating oil decrease by 34,705 (a 59% drop), while the number of heat pumps increased by 142,414 units. Newfoundland and Labrador saw a reduction of 32,843 homes using heating oil (a 55% drop), with an increase of 38,260 heat pumps. Nova Scotia saw a reduction of 78,261 homes using heating oil (a 39% drop) and an increase of 90,379 heat pumps. Prince Edward Island saw a reduction of 10,135 homes using heating oil (a 28% drop) and an increase of 16,073 heat pumps.
Atlantic Canada has had a historically higher reliance on heating oil compared to rest of CanadaFootnote 9. As of 2023, 19% of households in Atlantic Canada use heating oil, compared with 2% of households in the rest of Canada.
The reliance on heating oil exposes households to the volatility in international oil prices. In 2023, Natural Resources Canada estimated cost savings of $1,500 to $4,500 a year on energy bills when switching from heating oil-based systems to heat pumps.Footnote 10
Figure 3: Share of heat pumps in total heating system stock by province (2000-2023)
Source and Text Alternative
Source: National Energy Use Database | Natural Resources Canada
Text Alternative: This stacked bar chart visual illustrates total heat pump share by province in Canada between the years 2000 to 2023. The data can be filtered by year, building type, and province. Showing heat pump shares in all provinces (territories excluded), notably, New Brunswick leading at 40% share, followed by Prince Edward Island at 23%, and Nova Scotia at 21.5% in 2023.
Federal and Provincial Policy Support
The Canada Greener Homes Initiative (CGHI), launched in 2021, includes grant and loan programs that have successfully promoted and supported the installation of close to 300,000 heat pumps to date. The recently concluded Canada Greener Homes Grant (CGHG) program provided grants up to $5,000 for eligible retrofits, while the Canada Greener Homes Loan provided interest-free loans up to $40,000 for qualifying retrofits, with heat pumps being the top retrofit across both programs. The ongoing Oil to Heat Pump Affordability (OHPA) program provides targeted support for low- to median-income Canadian households that rely on heating oil to transition to heat pumps with grants of up to $10,000, increasing to $15,000 in qualifying provinces. Further, the new Canada Greener Homes Affordability Program (CGHAP), the latest program under the CGHI, provides funding to partners in provinces and territories to deliver region-specific home energy retrofits, including heat pumps, at no cost for low- to median-income Canadians.
Heat Pump Overview Dashboard:
The dashboard below is a comprehensive summary and overview of Canada’s current heat pump stock and share analysis. Including data and visuals at both the national level and provincial level (Territories excluded). Included analysis presents:
- Year-over-year change
- Heat pump stock and share
- Start vs. end year comparison.
- Yearly and provincial filters
- Annualized growth rate of heat pumps
- Period change of heat pumps
- Heat pump growth contributions
- Heat pump share at end year
- Provincial heat pump index with year 2000 = 100
- KPI Cards on heat pump growth and change
- Total heating stock inventory
Figure 4: Heat Pumps Overview Dashboard
Source and Text Alternative
Source: National Energy Use Database | Natural Resources Canada
Text Alternative: The dashboard is an overview of Canada’s current heat pump stock and share analysis. It includes data and visuals at both the national level and provincial level (Territories excluded). Included analysis presents: year-over-year change, heat pump stock and share, start vs. end year comparison, yearly and provincial filters, annualized growth rate of heat pumps, period change of heat pumps, heat pump growth contributions, heat pump share at end year, provincial heat pump index with year 2000 = 100, KPI Cards on heat pump growth and change, and total heating stock inventory.
Dashboard usage description:
“Navigator” allows for switching between a broader Canada overview into a more province-specific view.
In the Canada overview tab:
The “Province” slicer can alter each visual to become province specific.
“Heating Technology Stock, Start Year vs End year” visual represents a comparison of various heating technology stock across Canada, with the navy-blue column representing the stock of respective technologies at any given start year, and the orange column representing the ending heating stock at any given end year. Start years and end years can be chosen by the “Year” slicer at the top of the dashboard.
“Heat Pump Year-over-Year Growth” represents the percentage growth of heat pumps specifically relative to the previous year.
“Heating Tech Stock by Year and Heating System Group” represents total heating stock in thousands for Canada or any given province.
“Heat Pump Stock & Share” Represents growth of heat pump stock in thousands compared to Share.
In the Provincial tab:
“Heat Pump Index” indexes heat pumps at year 2000 for reference. Tracking relative growth and share in each province, the scroll bar allows for navigation through various provinces.
“Heat Pump Analysis Panel” allows for various pre-set data transformations to be applied. The Slicer “Analysis Metric” only applies to the analysis panel.
- Annualized heat pump growth rate is the compound growth rate for heat pumps, calculated using the standard Compound Annual Growth Rate (CAGR) formula.
- Heat Pump Period Change represents the raw change in heat pump stock represented in thousands for a specific period, dictated by the “Year” slicer located at the top of the slide.
- Heat Pump Growth Contribution represents each province’s contribution towards total heat pump growth as a percentage for any given period.
- Heat Pump share shows percentage of heating stock made up of heat pump for a given end year and province.
The “Data Table” show province-specific statistics, updating depending on “Year” slicer selection, separating start years and end year statistics.
- Date modified: