Market Snapshot: In 2020 fossil fuel use decreased, while renewable electricity generation increased
Connect/Contact Us
Please send comments, questions, or suggestions for Market Snapshot topics to snapshots@cer-rec.gc.ca
Release date: 2021-05-19
The COVID-19 pandemic had a significant impact on Canada’s energy demand and sources of energy supply in 2020. Lockdowns and travel restrictions imposed during the year had the largest effect on the demand for transportation fuels, which saw substantial declines throughout the year. Demand for other energy sources varied, and on the power production side, renewable electricity generation actually increased in 2020.

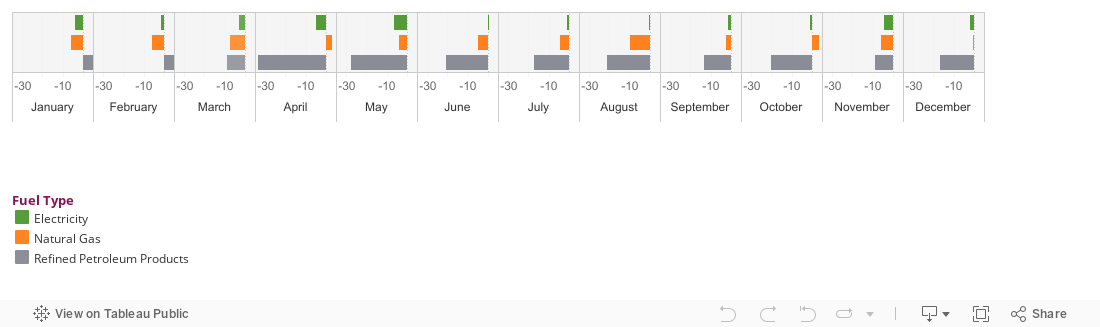
Figure 1. 2020 Monthly Energy Demand % Change Versus 2019
Source and Description
Source: Statistics Canada: Table 25-10-0081-01, Table 25-10-0055-01, and Table 25-10-0015-01.
Description: This bar chart shows percent change of monthly national demand for electricity, natural gas, and refined petroleum products for the 2020 calendar year, relative to 2019.
- In January, consumption of electricity decreased by 4.1%, natural gas decreased by 6.1%, and refined petroleum products increased by 4.8%.
- In February, consumption of electricity decreased by 1.4%, natural gas decreased by 5.7%, and refined petroleum products increased by 4.8%.
- In March, consumption of electricity decreased by 3.1%, natural gas decreased by 7.4%, and refined petroleum products decreased by 8.6%.
- In April, consumption of electricity decreased by 4.9%, natural gas increased by 2.9%, and refined petroleum products decreased by 33.4%.
- In May, consumption of electricity decreased by 6.3%, natural gas decreased by 4.0%, and refined petroleum products decreased by 27.7%.
- In June, consumption of electricity increased by 0.3%, natural gas decreased by 5.0%, and refined petroleum products decreased by 20.5%.
- In July, consumption of electricity decreased by 0.9%, natural gas decreased by 4.4%, and refined petroleum products decreased by 17.4%.
- In August, consumption of electricity decreased by 0.5%, natural gas decreased by 9.7%, and refined petroleum products decreased by 21.3%.
- In September, consumption of electricity decreased by 1.5%, natural gas decreased by 9.7%, and refined petroleum products decreased by 13.5%.
- In October, consumption of electricity decreased by 1.1%, natural gas increased by 3.7%, and refined petroleum products decreased by 20.2%.
- In November, consumption of electricity decreased by 4.2%, natural gas decreased by 5.8%, and refined petroleum products decreased by 9.0%.
- In December, consumption of electricity decreased by 2.1%, natural gas decreased by 0.5%, and refined petroleum products decreased by 16.8%.
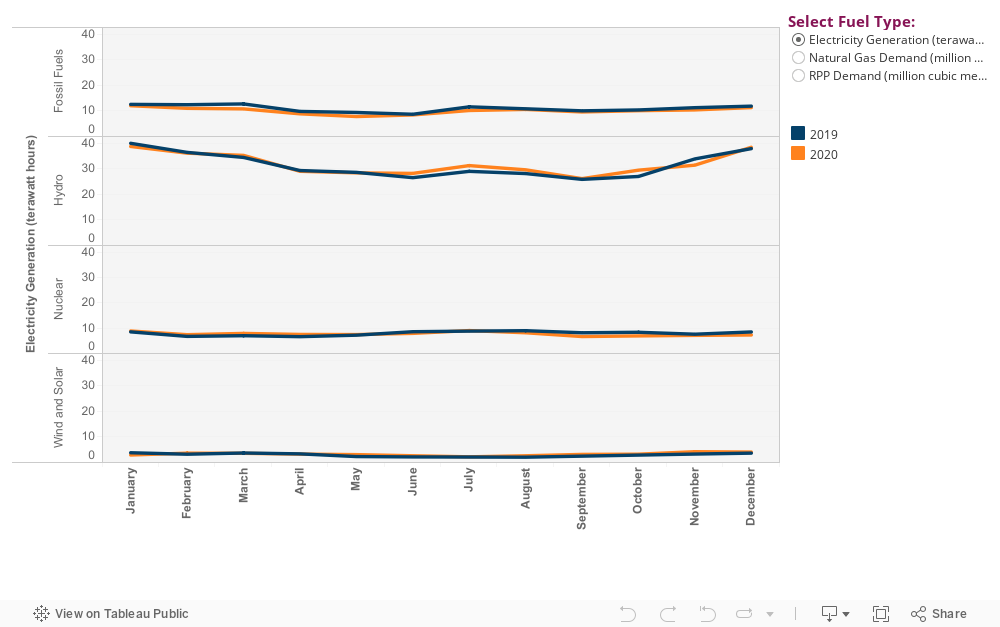
Figure 2. Comparison of 2019 and 2020 End-Use Energy Supply/Demand by Fuel
Source and Description
Source: Statistics Canada: Table 25-10-0081-01, Table 25-10-0055-01, and Table 25-10-0015-01.
Description: This line chart shows national level consumption of refined petroleum products, consumption of natural gas, and electricity generation by month for both 2019 and 2020. Consumption of refined petroleum products is disaggregated into diesel fuel, gasoline, and jet fuel. Natural gas consumption is disaggregated into commercial, industrial, and residential categories. Electricity generation is disaggregated by primary fuel type into fossil fuels, hydro, nuclear, and wind and solar categories.
In 2019, diesel fuel consumption remained relatively flat at 2.8 million cubic metres per month. In 2020, diesel fuel consumption was similar to 2019 in January, February, and March, but then fell to 2.0 million cubic metres in April before increasing through the summer months to about 2.8 million cubic metres in September.
In January, February, March, and April of 2019, gasoline consumption ranged from 3.2 to 3.5 million cubic metres before increasing to close to 4.0 million cubic metres from June to August. Gasoline consumption then decreased slightly from September to December, 2019, ranging from 3.7 to 3.5 million cubic metres. In 2020 gasoline consumption decreased from 3.6 million cubic metres in January through February and March to 2.0 million cubic metres in April, before increasing to about 3.5 million cubic metres per month from June to September. Then, gasoline consumption decreased to 3.2 million cubic meters in October, and about 3.0 million cubic metres in both November and December.
Jet fuel consumption was relatively flat throughout 2019, and in January, February, and March of 2020 at about 700 thousand cubic metres per month. In April 2020, jet fuel consumption decreased to about 100 thousand cubic metres. Jet fuel consumption remained close to that level for the rest of 2020, ranging between 100 thousand and 300 thousand cubic metres per month.
Commercial natural gas consumption trends were similar in both 2019 and 2020. Consumption was about 2.7 million cubic metres in January, and declined to about 2.2 million cubic metres in March, before dipping to annual lows of about 400 thousand cubic metres in July. Then, commercial natural gas consumption increased in both 2019 and 2020 to 2.3 and 2.1 million cubic metres, respectively, by December.
Industrial natural gas consumption in 2019 was between 7.5 and 7.0 million cubic metres per month from January to March, before decreasing to between 6.5 and 6.0 million cubic metres per month from April to October. Consumption increased in November and December 2019 to 6.8 and 7.0 million cubic metres respectively. In 2020, industrial natural gas consumption was between 7.2 and 6.8 million cubic metres per month from January to March, before decreasing to between 5.9 and 6.3 million cubic metres per month from April to September. Industrial natural gas consumption increased from 6.6 to 7.3 million cubic metres per month from October to December 2020.
In 2019, residential natural gas consumption decreased from 3.0 million to 400 thousand cubic metres from January to August, then increased to 2.4 million cubic metres by December. In 2020, residential natural gas consumption decreased from 2.7 million to 400 thousand cubic metres from January to August, then increased to 2.2 million cubic metres by December.
In 2019, fossil fuel electricity generation was between 2.4 and 2.7 terawatt-hours from January to March, before decreasing to 8.7 terawatt-hours in June. Then, monthly fossil fuel electricity generation increased to 11.9 terawatt-hours by December. In 2020, monthly fossil fuel electricity generation decreased from 12.0 terawatt-hours in January to 7.8 terawatt-hours in May, before increasing to 11.3 terawatt-hours by December.
In 2019, monthly hydro electricity generation decreased from 40.0 terawatt-hours in January to 26.5 terawatt-hours in June, before increasing to 37.9 terawatt-hours in December. In 2020, monthly hydro electricity generation decreased from 38.7 terawatt-hours in January to 28.2 terawatt-hours in June, before increasing to 38.5 terawatt-hours in December.
Monthly nuclear electricity generation remained relatively flat in both 2019 and 2020, between 6.7 and 9.0 terawatt-hours.
In 2019, monthly electricity generation from wind and solar was between 3.8 and 2.1 terawatt-hours. In 2020, monthly electricity generation from wind and solar was between 4.0 and 2.2 terawatt-hours.
Overall, consumption of refined petroleum products (RPPs) declined by about 15% compared to 2019. Gasoline consumption decreased the most, followed closely by jet fuel, then diesel fuel. For all three fuels, consumption was the lowest in April 2020. Diesel consumption recovered to 2019 levels by September. Gasoline consumption, although close, did not reach 2019 levels by December 2020. In contrast, monthly consumption of jet fuel remained well below half of that seen in 2019 from April through December of 2020.
Natural gas demand was less affected, declining on aggregate by about 4% in 2020 relative to 2019. However, this overall decrease hid trends across different parts of the economy; on average, monthly industrial and commercial consumption decreased (by 2.6% and 6.5% respectively), while residential consumption increased (by 1.8%) relative to 2019.
Similarly, pandemic-related measures affected total electricity consumption, which fell for the first time since 2015, and declined by about 2.5% in 2020. This contributed to a decline in overall electricity generation of 0.8% in 2020. Generation from hydro increased slightly, and nuclear generation decreased slightly. Notably, generation from the combustion of fossil fuels (primarily natural gas and coal) decreased by 7.9% relative to 2019. Over two-thirds of this decrease was in Alberta, with the remainder spread between British Columbia, New Brunswick, Saskatchewan, and Nova Scotia. Electricity generation from wind and solar moved in the other direction, increasing by 12.3% over the year. Wind accounted for 97% of this growth, with the largest growth split evenly between Alberta, Ontario, and British Columbia. Almost all of the national total growth in solar generation from 2019 to 2020 (about 120 megawatt hours) was in Ontario.
In 2020, lower consumption of fossil fuels likely led to lower Canadian greenhouse gas (GHG) emissions compared to previous years. Recent analysis by Environment and Climate Change Canada estimates an 11% reduction in GHG emissions relative to 2019 levels, which mirrors estimates for U.S. and global emission trends. Additionally, trends in the monthly data summarized above are similar to the projected values found in the CER’s Canada’s Energy Future 2020.
Although energy demand was significantly affected by pandemic measures in spring 2020, consumption patterns for most fuels have since returned to pre-pandemic levels (with the exception of gasoline and jet fuel). By December 2020, consumption of diesel fuel, natural gas, and electricity generated by burning fossil fuels returned close to 2019 levels, as will have their associated GHG emissions. Going forward, many factors will influence energy demand and GHG emissions in Canada, including the speed and nature of economic recovery, market dynamics, and government policy.
- Date modified: