Market Snapshot: COVID-19 pandemic and lower oil prices lead to decrease in Alberta’s electricity consumption
Connect/Contact Us
Please send comments, questions, or suggestions for Market Snapshot topics to snapshots@cer-rec.gc.ca
Release date: 2020-07-29
Since March 2020, the COVID-19 pandemic and low oil prices have been impacting Canadian provinces, including Alberta. This is leading to lower electricity demand and flattening of the daily electricity demand curve. 46% of Alberta’s total electricity demand comes from the industrial sector; the largest share of industrial sector demand in Canada. Extremely low oil prices in April 2020 led to a partial shutdown of operations and production shut-ins for many companies, causing a decrease in power demand in Alberta’s industrial sector. COVID-19 restrictions, such as stay-at-home measures, have increased residential power demand, flattening the morning ramp and decreasing the commercial load.
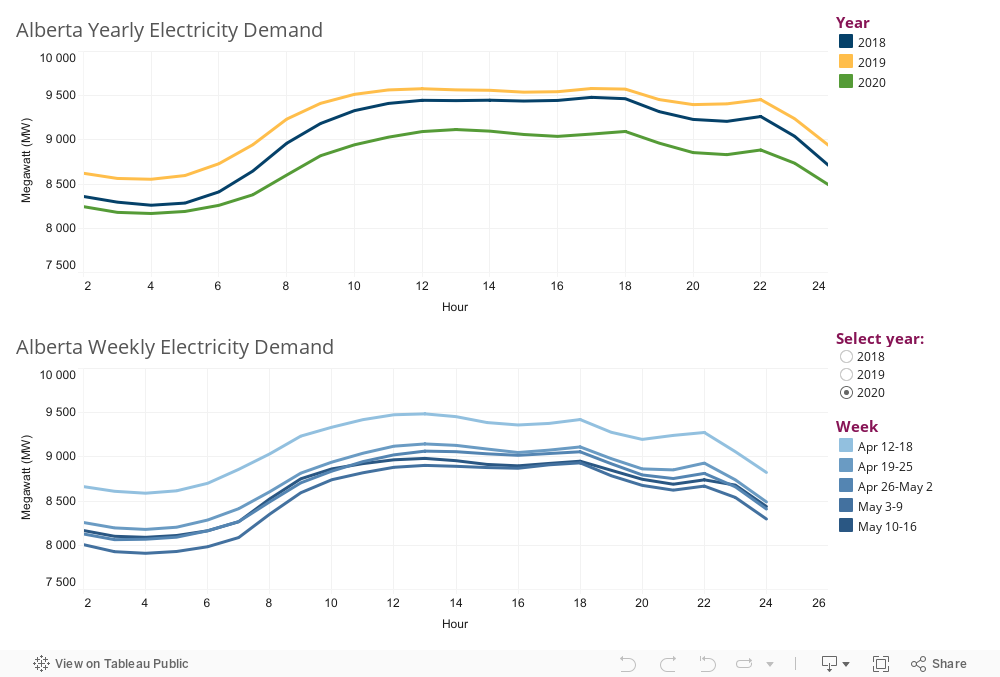
Figure 1. Average daily electricity demand in Alberta in mid-April – mid-May of 2018, 2019 and 2020, by year and by week
Source and Description
Source: AESO
Description: This figure illustrates average daily electricity demand in Alberta, between mid-April and mid-May for 2018, 2019 and 2020. The horizontal axis represents the hours of the day, between 1:00 am and midnight. The lines represent average hourly demand for each of the given weeks. The vertical axis represents power demand, in megawatts (MW). There is a decline in power demand between mid-April and mid-May 2020, compared to the same weeks of 2019 and 2018.
Power consumption declined in 2020 compared to the same period in 2019 and 2018. Weekly average power consumption dropped by 5.5% between 12 April 2020, and 10 May 2020. During the same period in 2019 and 2018, weekly average power consumption decreased by only 2% and 1%, respectively.
Weekly average electricity demand charts track the gradual decrease in power consumption from the earlier stages of Alberta’s COVID-19 response, when more businesses were in operation and people were still going to the office, to the later stages, when most people were working from home and many businesses were closed.
Appendix:
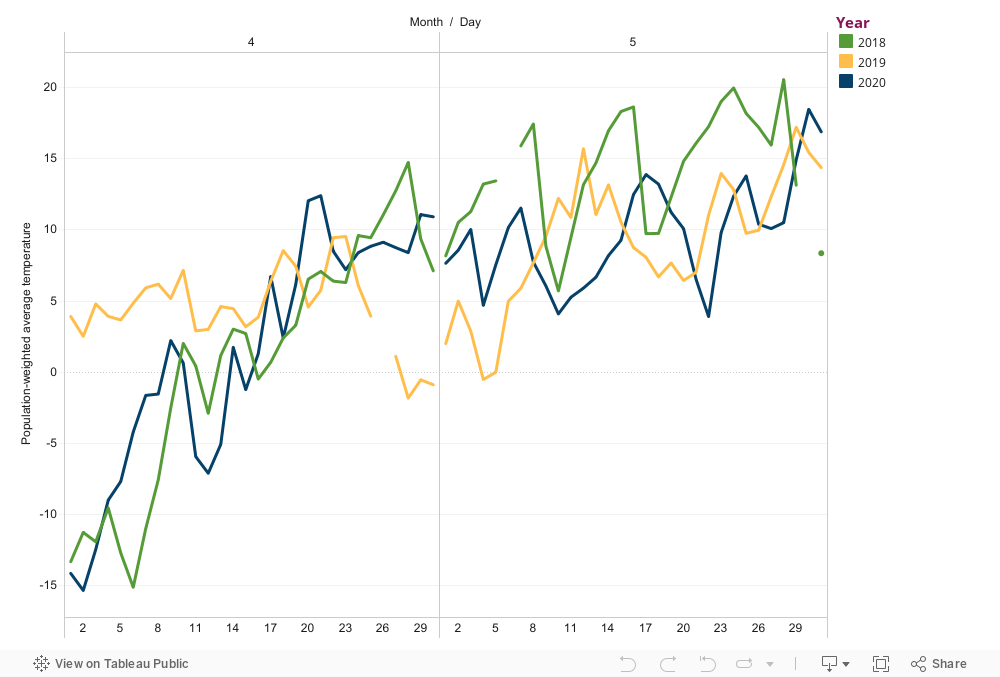
To remove the effect of seasonality, 2020 data was compared to the same time-frame from 2019 and 2018. Lower temperatures increase electricity demand for heatingFootnote 1. From mid-April to mid-May, average temperatures for Alberta’s largest cities by population (Calgary and Edmonton) in 2020 were often higher than in 2019, but lower than in 2018 (Figure A.1). In spite of colder weather, power consumption for the week of 12 April – 18 April, 2020 was still lower than for the same week of 2019 and 2018.
Figure A.1. Average daily temperature in Edmonton and Calgary, Alberta: mid-April – mid-May of 2018, 2019 and 2020
Source and Description
Source: Environment and Climate Change Canada
Description: This figure shows population-weighted average daily temperature in Alberta (Calgary and Edmonton), in degrees °C, between mid-April and mid-May for 2018, 2019 and 2020. On average, the temperature in both Calgary and Edmonton during this time was between 5 and 10°C, with a couple of weeks of lower temperatures (around 0°C) in the weeks of 26 April – 2 May and 3 May – 9 May 2019, and several days of below 0°C temperatures (as low as -8.5°C) from 12 to 15 April 2020.
- Date modified: