Market Snapshot: Solar power generation in Canada is highly seasonal
Release date: 2019-02-20
In high latitude countries like Canada, the amount of sunlight received by solar panels is highly seasonal. In particular, the further north one lives means more hours of daylight in the spring and summer and fewer hours of daylight in the fall and winter. In a recent report called The Economics of Solar Power in Canada (ESPC), the NEB modeled the amount of electricity various types of solar projects might generate in over 20 000 Canadian communities.
ESPC data shows that solar panels in Canada generate significantly more electricity in the spring and summer than they do in the fall and winter. The territories have bigger seasonal differences than the provinces, because territories are located further north.
More than just hours of daylight, seasonal differences in solar power can also be from seasonal changes in cloudiness, changes in snowfall, or other differences in climate. However, cooler times of the year do have one advantage over warmer times: panels are more efficient at generating electricity in winter, because cooler temperatures decrease resistance in the electric wiring, meaning more energy is available to convert to electricity.
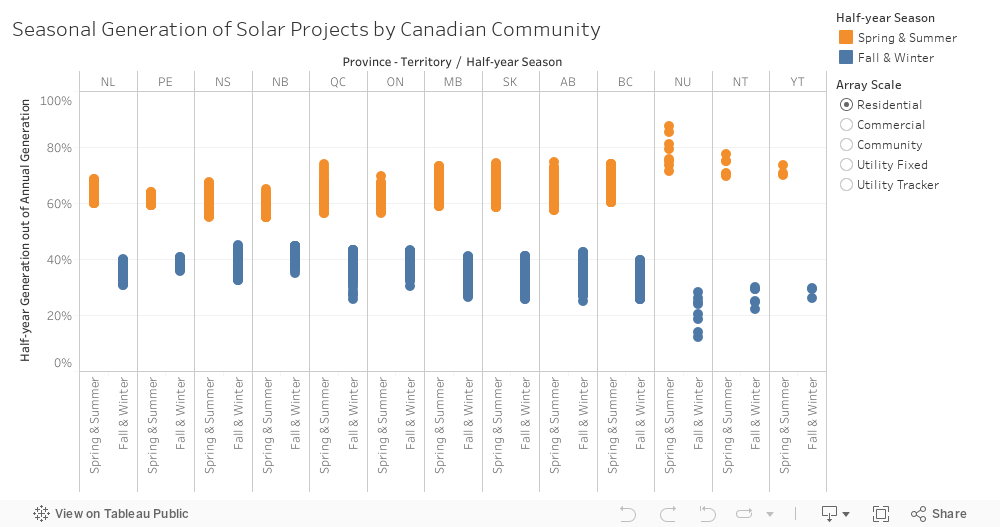
Figure 1. Seasonal generation of solar panel projects by Canadian community
Source and Description
Source: NEB
Description: This figure is a chart that contains plotted points for the percent of power generated in the spring and summer and in the fall and winter for most communities in Canada, and as separated by province. In the spring and summer, the amount of provincial generation ranges from 55% to 75% of the annual total. In the fall and winter, the amount of provincial generation ranges from 25% to 45% of the annual total. In the spring and summer, the amount of territorial generation ranges from 65% to 85% of the annual total. In the fall and winter, the amount of territorial generation ranges from 15% to 35% of the annual total.
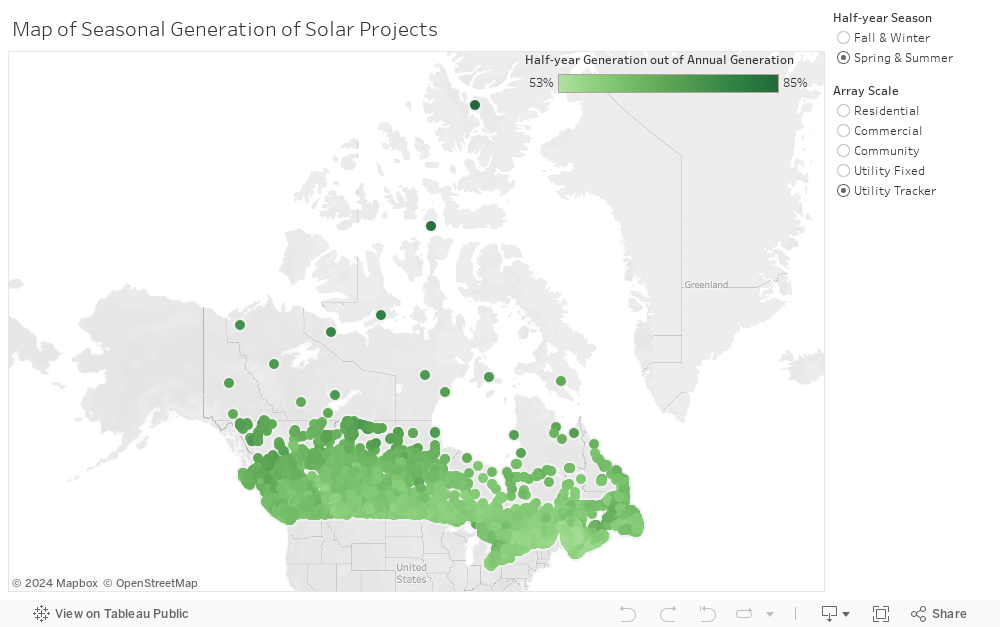
Figure 2. Map of seasonal generation of Canadian solar projects
Source and Description
Source: NEB
Description: This figure is a map that contains plotted points for the percent of power generated in the spring and summer and in the fall and winter for most communities in Canada. In the spring and summer, the amount of provincial generation ranges from 55% to 75% of the annual total. In the fall and winter, the amount of provincial generation ranges from 25% to 45% of the annual total. In the spring and summer, the amount of territorial generation ranges from 65% to 85% of the annual total. In the fall and winter, the amount of territorial generation ranges from 15% to 35% of the annual total. In general, communities located further north have a larger share of their annual generation during the spring and summer.
- Date modified: